WO2022162953A1 - 解像度測定方法、解像度測定システム、およびプログラム - Google Patents
解像度測定方法、解像度測定システム、およびプログラム Download PDFInfo
- Publication number
- WO2022162953A1 WO2022162953A1 PCT/JP2021/004940 JP2021004940W WO2022162953A1 WO 2022162953 A1 WO2022162953 A1 WO 2022162953A1 JP 2021004940 W JP2021004940 W JP 2021004940W WO 2022162953 A1 WO2022162953 A1 WO 2022162953A1
- Authority
- WO
- WIPO (PCT)
- Prior art keywords
- test chart
- resolution
- image
- camera
- distortion
- Prior art date
- Legal status (The legal status is an assumption and is not a legal conclusion. Google has not performed a legal analysis and makes no representation as to the accuracy of the status listed.)
- Ceased
Links
Images






Classifications
-
- H—ELECTRICITY
- H04—ELECTRIC COMMUNICATION TECHNIQUE
- H04N—PICTORIAL COMMUNICATION, e.g. TELEVISION
- H04N17/00—Diagnosis, testing or measuring for television systems or their details
- H04N17/002—Diagnosis, testing or measuring for television systems or their details for television cameras
-
- G—PHYSICS
- G01—MEASURING; TESTING
- G01M—TESTING STATIC OR DYNAMIC BALANCE OF MACHINES OR STRUCTURES; TESTING OF STRUCTURES OR APPARATUS, NOT OTHERWISE PROVIDED FOR
- G01M11/00—Testing of optical apparatus; Testing structures by optical methods not otherwise provided for
- G01M11/02—Testing optical properties
-
- G—PHYSICS
- G01—MEASURING; TESTING
- G01M—TESTING STATIC OR DYNAMIC BALANCE OF MACHINES OR STRUCTURES; TESTING OF STRUCTURES OR APPARATUS, NOT OTHERWISE PROVIDED FOR
- G01M11/00—Testing of optical apparatus; Testing structures by optical methods not otherwise provided for
- G01M11/02—Testing optical properties
- G01M11/0242—Testing optical properties by measuring geometrical properties or aberrations
- G01M11/0257—Testing optical properties by measuring geometrical properties or aberrations by analyzing the image formed by the object to be tested
- G01M11/0264—Testing optical properties by measuring geometrical properties or aberrations by analyzing the image formed by the object to be tested by using targets or reference patterns
-
- G—PHYSICS
- G03—PHOTOGRAPHY; CINEMATOGRAPHY; ANALOGOUS TECHNIQUES USING WAVES OTHER THAN OPTICAL WAVES; ELECTROGRAPHY; HOLOGRAPHY
- G03B—APPARATUS OR ARRANGEMENTS FOR TAKING PHOTOGRAPHS OR FOR PROJECTING OR VIEWING THEM; APPARATUS OR ARRANGEMENTS EMPLOYING ANALOGOUS TECHNIQUES USING WAVES OTHER THAN OPTICAL WAVES; ACCESSORIES THEREFOR
- G03B43/00—Testing correct operation of photographic apparatus or parts thereof
-
- G—PHYSICS
- G06—COMPUTING OR CALCULATING; COUNTING
- G06T—IMAGE DATA PROCESSING OR GENERATION, IN GENERAL
- G06T3/00—Geometric image transformations in the plane of the image
- G06T3/18—Image warping, e.g. rearranging pixels individually
-
- G—PHYSICS
- G06—COMPUTING OR CALCULATING; COUNTING
- G06T—IMAGE DATA PROCESSING OR GENERATION, IN GENERAL
- G06T7/00—Image analysis
- G06T7/80—Analysis of captured images to determine intrinsic or extrinsic camera parameters, i.e. camera calibration
-
- G—PHYSICS
- G03—PHOTOGRAPHY; CINEMATOGRAPHY; ANALOGOUS TECHNIQUES USING WAVES OTHER THAN OPTICAL WAVES; ELECTROGRAPHY; HOLOGRAPHY
- G03B—APPARATUS OR ARRANGEMENTS FOR TAKING PHOTOGRAPHS OR FOR PROJECTING OR VIEWING THEM; APPARATUS OR ARRANGEMENTS EMPLOYING ANALOGOUS TECHNIQUES USING WAVES OTHER THAN OPTICAL WAVES; ACCESSORIES THEREFOR
- G03B37/00—Panoramic or wide-screen photography; Photographing extended surfaces, e.g. for surveying; Photographing internal surfaces, e.g. of pipe
- G03B37/06—Panoramic or wide-screen photography; Photographing extended surfaces, e.g. for surveying; Photographing internal surfaces, e.g. of pipe involving anamorphosis
Definitions
- the present invention relates to camera resolution measurement technology.
- the slanted edge method has a smaller test pattern than the contrast method, and is applicable to various cameras such as a camera with distortion aberration such as a fisheye camera.
- image processing edge enhancement processing
- there have been phenomena such as deterioration in reproducibility and a value of limit resolution that is better than visual evaluation.
- the contrast method has fewer problems than the inclined edge method.
- the MTF measurement by the contrast method patterns of different frequencies with constant amplitude are photographed, and the luminance amplitude of each frequency of the photographed image is measured to obtain the MTF (for example, Patent Document 1).
- the contrast method if the test pattern is distorted, the waveform shape changes, harmonic components are generated, and the frequency interval changes, so accurate MTF measurement cannot be performed. That is, the contrast method is an MTF measurement method that assumes that the test pattern has no distortion. Therefore, the conventional contrast method cannot be applied to a camera such as a fish-eye camera that causes distortion in the field of view.
- the present invention has been made in view of such problems.
- one aspect of the present invention is a camera resolution measuring method executed by a computer device, comprising: a step of generating a distortion map representing a correspondence relationship between the coordinates of all pixels of the first test chart in the captured image and the generating a distorted test chart, which is a distorted image of a second test chart for measuring resolution in a specific area within a first test chart; and using the distorted test chart, the camera corresponding to the specific area. and performing a resolution measurement by a contrast method in a part of the field of view of the image.
- Another aspect of the present invention is a computer device that executes the above resolution measuring method.
- Another aspect of the present invention is a program for causing a computer device to execute the above resolution measuring method.
- Yet another aspect of the present invention is a computer-readable medium storing computer-executable instructions which, when executed, cause a computer device to perform the above-described resolution measuring method. is a medium.
- FIG. 4 is a diagram showing an example of a correspondence relationship between pixels of a checkerboard image and pixels of a distorted checkerboard image
- FIG. 4 is a diagram showing an example of the data structure of a distortion map
- FIG. 10 is a diagram showing an example of a white test chart image corresponding to a checkerboard image area in a photographed image, and an example of an undistorted image of a measurement test chart drawn thereafter;
- FIG. 4 is a diagram showing an example of a correspondence relationship between pixels of a checkerboard image and pixels of a distorted checkerboard image
- FIG. 4 is a diagram showing an example of the data structure of a distortion map
- FIG. 10 is a diagram showing an example of a white test chart image corresponding to a checkerboard image area in a photographed image, and an example of an undistorted image of a measurement test chart drawn thereafter;
- FIG. 4 is a diagram showing an example of a correspondence relationship between pixels of a checkerboard image and pixels of a distorted checkerboard
- FIG. 4 is a flowchart showing an example of processing in the computer device of the resolution measurement system according to one embodiment of the present invention. It is a figure which shows an example of the hardware constitutions of the computer apparatus of the resolution measuring system which concerns on one Embodiment of this invention.
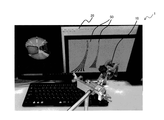
- FIG. 1 is an example of the appearance of a resolution measuring system according to this embodiment.
- a resolution measurement system 1 according to the present embodiment is a system for measuring the resolution of a camera such as a fisheye camera that causes distortion in the field of view.
- the resolution measurement system 1 of this embodiment employs a contrast method with good reproducibility, and performs distortion correction on the test chart in accordance with the camera to be inspected.
- the camera 10 which is the object of resolution measurement, is arranged so as to photograph the test chart 50 displayed on the display 20 within its angle of view. More specifically, the camera 10 and the display 20 are arranged so that the test chart is included in the screen range of the display 20 at any point within the angle of view of the camera 10 where the resolution is to be measured.
- FIG. 2 is a diagram showing an example of the configuration of the resolution measurement system according to this embodiment.
- the resolution measurement system 1 includes a camera 10, a display 20, and a computer device 30.
- the camera 10 is a camera to be inspected for resolution measurement, and is a camera such as a fish-eye camera in which distortion occurs in the field of view. Note that the dashed arrow extending from the camera 10 in FIG. 2 indicates an example of the angle of view range of the camera 10 .
- a display 20 displays an image such as a test chart, and the image is captured by the camera 10 .
- the computer device 30 acquires the image data captured by the camera 10 and uses it together with the image data of the test chart displayed on the display to perform processing for correcting distortion of the test chart.
- the display 20 (test chart) is not limited to a specific position as long as the test chart is photographed so as to include an arbitrary portion of the angle of view of the camera 10 where the resolution is to be measured. However, the relative positions of the camera 10 and the display 20 are fixed so as not to change while the resolution of the location is being measured.
- the computer device 30 includes a data input/output unit 302, a distortion map generation unit 304, a back projection image generation unit 306, and a resolution measurement unit 308.
- the distortion map generation unit 304 generates the coordinates of all pixels of a first test chart (such as a checkerboard image 50 to be described later) and the first test chart (distortion to be described later) in an image captured by the camera 10 that causes distortion in the imaging field of view.
- a distortion map representing the correspondence between coordinates of all pixels of a checkerboard image 50d, etc.) is generated.
- the first test chart is, for example, a grid-like image such as a checkerboard image 50 to be described later.
- the distortion map generating unit 304 generates, for example, the coordinates of each lattice point of the distorted checkerboard image 50 (first test chart) in the photographed image of the camera 10, and the entire distortion of the first test chart in the photographed image. Pixel coordinates are calculated by an interpolation process such as cubic spline interpolation.
- the resolution measurement unit 308 uses the distortion test chart generated by the back projection image generation unit 306 to measure the resolution by the contrast method in a part of the field of view of the camera 10 corresponding to the specific area. Also, when performing resolution measurement, the distortion test chart generated by the backprojection image generator 306 is output to the display 20 . In the present embodiment, the distortion test chart generated by the backprojection image generation unit 306 is captured as a distortion-corrected (without distortion) image when captured by the camera 10. Therefore, the contrast method is used. can be performed similarly to conventional contrast methods.
- the back projection image generation unit 306 generates a plurality of distorted test charts, which are distorted images of the plurality of second test charts corresponding to the plurality of spatial frequencies.
- a test chart may be used to perform a resolution measurement.
- a checkerboard image displayed on the display 20 is photographed at an arbitrary position within the angle of view of the camera 10 (area including the portion whose resolution is to be measured). be.
- the distortion of all pixels of the checkerboard image is obtained by interpolation processing.
- the interpolation process includes, for example, a cubic spline interpolation process, but is not limited to this. Other interpolation methods may be used.
- Data indicating the correspondence between the pixels of the original checkerboard image and the pixels of the photographed and distorted checkerboard image is stored as a distortion map. Then, based on this distortion map, a test chart for measurement is generated so that the resolution can be measured by the contrast method even with the camera 10 in which the field of view is distorted.
- FIG. 3 is a diagram showing an example of the imaging field of view of the camera 10.
- FIG. 3 first, a checkerboard image 50 is displayed on the display 20 as a test chart. The relative positions of the display 20 and the camera 10 are adjusted so that the checkerboard image 50 is captured so as to include the area whose resolution is to be measured within the angle of view of the camera 10 . Also, the data input/output unit 302 of the computer device 30 acquires the data of the captured image of the camera 10 as shown in FIG. 3 from the camera 10 .
- FIG. 4 is a diagram showing an example of the correspondence relationship between the pixels of the checkerboard image 50 and the pixels of the distorted checkerboard image 50d in the captured image acquired from the camera 10.
- the checkerboard image 50 is assumed to have a size of 2560 pixels ⁇ 1664 pixels.
- FIG. 5 is a diagram showing an example of the data structure of a distortion map.
- the distortion map data includes the coordinates (x, y) of all pixels of the test chart 50 and the coordinates (x , y) can be implemented as a two-dimensional array.
- the test chart (checkerboard image) 50 is 2560 pixels ⁇ 1664 pixels, so the distortion map data is a two-dimensional array of size 2560 (pixels) ⁇ 1664 (pixels) ⁇ 2 (x coordinates, y coordinates). (however, this example is an example and is not limited to this). More specifically, in this example, each coordinate of a checkerboard grid point is measured. Each measured coordinate can then be stored in a matrix for each xy coordinate.
- the coordinates of all the pixels of the checkerboard image 50d can be obtained by interpolation processing.
- the x-coordinate and y-coordinate of the checkerboard image 50d for all pixels of the checkerboard image 50 are two-dimensionally interpolated by the griddedInterpolant function of "MATLAB", a product of MathWorks Inc., and converted to a distortion map. It can be realized by saving.
- the undistorted image 62 of the measurement test chart is back projected to generate a distorted measurement test chart image. More specifically, it depends on which coordinates (x, y) of the checkerboard image 50 of the distortion map shown in FIG. Then, the distorted measurement test chart image can be generated by inverse transforming the coordinates (x, y) of each pixel of the undistorted image 62 .
- FIG. 7 is a diagram showing an example of a distorted measurement test chart 62d generated by back-projecting the undistorted image 62 of the measurement test chart.
- FIG. 9 shows an example of the field of view 10a when the measurement test chart image 62d with distortion generated as described above is displayed on the display 20 and the measurement test chart image 62d is captured by the camera 10. It is a figure which shows. It can be seen that in the field of view 10a, the measurement test chart image 62a is projected without distortion, like the distortion-free image 62 of FIG. As a result, it is possible to measure the resolution by the contrast method at the portion where the measurement test chart image 62a is projected in the field of view of the camera 10. FIG. This resolution measurement can be performed by a conventional contrast method technique. In addition, resolution measurement can be performed in the same manner at other locations in the same white test chart image 50w.
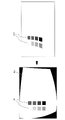
- a distorted step chart image 63d is displayed on the display 20 as in FIG.
- a distortion-free step chart is projected in the field of view 10a of the camera 10.
- the brightness data is corrected based on a brightness linearization LUT (Look-Up Table) generated according to the step chart images 63 and 63d.
- the relative position between the display 20 (test chart) and the camera 10 is changed, and the location where the resolution measurement is performed is marked with a checkerboard.
- the camera Resolution can be measured at a plurality of locations in the imaging field of view.
- test charts are displayed on the display 20 in this embodiment, the present invention is not limited to this.
- the test chart may be printed on paper.
- a method such as printing a test chart on paper is effective.
- a test chart (displayed on display 20 or printed on paper) is prepared so that it includes any portion of the angle of view of camera 10 where resolution is to be measured. It should be arranged. The relative position between the camera 10 and the test chart is fixed so as not to change until the distortion map is generated from the checkerboard image 50, the test chart 62d with distortion is generated, and the resolution is measured. need to be
- the relative position between the camera 10 and the display 20 (test charts 50, 50d, 62d, 62a) changes during the period from when the distortion map is generated until the resolution is measured.
- the inspection distance between the camera 10 and the display 20 (test charts 50, 50d, 62d, 62a) and the distance between the camera 10 and the display 20 (test charts 50, 50d, 62d, 62a)
- the position is not limited to a specific one (it can be changed each time the resolution is measured).
- a distorted test chart image 62d is generated based on the correspondence between the coordinates of the pixels of the checkerboard image 50 and the coordinates of the pixels of the distorted checkerboard 50d in the camera image, and the resolution is measured by the contrast method. executed. Therefore, resolution measurement can be performed even with a camera whose distortion characteristic formula is unknown.
- the conventional contrast method it is common to use a relatively large test pattern such as the test chart 62 capable of measuring resolution for a plurality of spatial frequencies. Therefore, in the conventional contrast method, it is difficult to measure the resolution within a narrow range within the angle of view of the camera 10 .
- a plurality of measurement test charts (bar charts) 62d corresponding to a plurality of spatial frequencies are created. A distortion map is generated for these measurement test charts as described above, and a distorted test chart 62d is generated based on the distortion map.
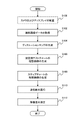
- FIG. 11 is a flowchart showing an example of processing in the computer device 30 of the resolution measurement system 1 according to this embodiment.
- step S102 the data input/output unit 302 acquires captured image data of the distorted checkerboard image 50d captured by the camera 10 for the checkerboard image 50 displayed on the display 20.
- step S106 the back projection image generation unit 306 generates an image 62 without distortion of the measurement test chart at a specific location (rectangle 61) designated by the user with a mouse or the like in the white test chart image 50w. Also, at this time, a distortion-free image of a plurality of test chart images for measurement as shown in FIG. 10 may be generated. Similarly, in step S108, the back projection image generation unit 306 generates a distortion-free image 63 of the step chart for correcting the linearity of the luminance data. Note that the processing order of steps S106 and S108 may be reversed, or they may be processed in parallel.
- step S112 by photographing the distorted measurement test chart image 62d (displayed on the display 20 or printed on paper) with the camera 10, the contrast using the undistorted measurement test chart image 62a is determined. Perform a resolution measurement by the method. Also, when performing the resolution measurement, the luminance data is corrected based on a luminance linearization LUT generated according to the step chart images 63, 63d. At this time, a plurality of measurement test chart images 62d may be displayed and output on the display 20 in a time-division manner, thereby performing resolution measurement for a plurality of spatial frequencies.
- the resolution measurement method according to this processing flow can also be implemented as a computer program to be executed by a computer device. It is also possible to record such a computer program in a computer-readable recording medium.
- FIG. 12 is a diagram showing an example of the hardware configuration of the computer device 30. As shown in FIG. A computer device 40 shown in FIG.
- a processor 41 includes, as an example, a processor 41, a RAM (Random Access Memory) 42, a ROM (Read Only Memory) 43, a built-in hard disk device 44, an external hard disk device, a CD, a DVD , a removable memory 45 such as a USB memory, a memory stick, an SD card, an input/output user interface 46 (keyboard, mouse, touch panel, speaker, microphone, lamp, etc.) for the user to exchange data with the computer device 40, A wired/wireless communication interface 47 capable of communicating with the camera 10, the display 20, or other devices, and a display 48 (which may also be used as the display 20) are provided.
- a processor 41 includes, as an example, a processor 41, a RAM (Random Access Memory) 42, a ROM (Read Only Memory) 43, a built-in hard disk device 44, an external hard disk device, a CD, a DVD , a removable memory 45 such as a USB memory, a memory stick, an SD card, an input/out
- the functions of the computer device 30 according to the present embodiment are such that, for example, the processor 41 reads a program stored in advance in the hard disk device 44, the ROM 43, the removable memory 45, etc., into a memory such as the RAM 42, and stores the above-described data necessary for processing. , the hard disk device 44, the ROM 43, the removable memory 45, or the like, while executing the program.
- the hardware configuration shown in FIG. 12 is merely an example, and the present invention is not limited to this.
Landscapes
- Engineering & Computer Science (AREA)
- Physics & Mathematics (AREA)
- General Physics & Mathematics (AREA)
- Signal Processing (AREA)
- Health & Medical Sciences (AREA)
- Biomedical Technology (AREA)
- General Health & Medical Sciences (AREA)
- Multimedia (AREA)
- Theoretical Computer Science (AREA)
- Chemical & Material Sciences (AREA)
- Analytical Chemistry (AREA)
- Computer Vision & Pattern Recognition (AREA)
- Geometry (AREA)
- Image Processing (AREA)
- Testing, Inspecting, Measuring Of Stereoscopic Televisions And Televisions (AREA)
- Exposure Control For Cameras (AREA)
- Camera Bodies And Camera Details Or Accessories (AREA)
- Testing Of Optical Devices Or Fibers (AREA)
Abstract
Description
本発明は、このような課題に鑑みてなされたものである。
(解像度測定システムの構成)
図1は、本実施形態に係る解像度測定システムの外観の一例である。本実施形態に係る解像度測定システム1は、魚眼カメラのような撮影視野に歪みが発生するカメラの解像度を測定するためのシステムである。本実施形態の解像度測定システム1は、再現性の良いコントラスト法を採用し、被検カメラに合わせてテストチャートに対して歪み補正を行う。図1に示されるように、解像度測定の対象であるカメラ10は、ディスプレイ20に表示されるテストチャート50をその画角内で撮影するように配置される。より具体的には、カメラ10の画角内のうち解像度を測定しようとする任意の箇所がテストチャートがディスプレイ20の画面範囲内に含まれるようにカメラ10とディスプレイ20とが配置される。
以下、ディストーションマップ生成部304におけるディストーションマップの生成方法の具体例について詳述する。本実施形態においてはディストーションマップを生成するために、カメラ10の画角内の任意の位置(解像度を測定しようとする部分を含むエリア)において、ディスプレイ20に表示されるチェッカーボードの画像が撮影される。そして、得られた当該チェッカーボードの撮影画像の座標点に基づいて、チェッカーボード画像の全画素の歪みが補間処理により求められる。なお、補間処理としては、例えば、3次スプライン補間処理などが挙げられるが、これに限定されない。他の補間方法を用いてもよい。この元のチェッカーボード画像の画素と撮影されて歪曲したチェッカーボード画像の画素との対応関係を示すデータがディストーションマップとして保存される。そして、このディストーションマップに基づいて撮影視野に歪みが生じるカメラ10であってもコントラスト法による解像度測定が可能となるように測定用テストチャートが生成される。
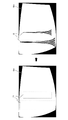
ディストーションマップ生成部304においてディストーションマップが生成されると、次に、逆投影画像生成部306において、解像度測定を行う際に用いられる測定用テストチャートの逆投影画像が生成される。図6は、カメラの撮影画像におけるチェッカーボード画像領域に対応する白色のテストチャート画像50wと、その後に描画された測定用テストチャートの歪みの無い画像62の一例を示す図である。より具体的には、歪みのあるチェッカーボード画像50dの画像範囲を示す白色のテストチャート画像50wにおいて、例えばコンピュータ装置30のユーザがマウス等の入力装置を用いて解像度を測定しようとする箇所を示す矩形61を指定する(描画する)。そして、この矩形61が指定された箇所において、測定用テストチャートの歪みの無い画像62が描画される。
図11は、本実施形態に係る解像度測定システム1のコンピュータ装置30における処理の一例を示すフロー図である。
上記説明されたコンピュータ装置30の構成は、一般的なコンピュータ装置と同様のハードウェア構成によって実現可能である。図12は、コンピュータ装置30のハードウェア構成の一例を示す図である。図12に示されるコンピュータ装置40は、一例として、プロセッサ41と、RAM(Random Access Memory)42と、ROM(Read Only Memory)43と、内蔵のハードディスク装置44と、外付けハードディスク装置、CD、DVD、USBメモリ、メモリスティック、SDカード等のリムーバブルメモリ45と、ユーザがコンピュータ装置40とデータのやり取りを行うための入出力ユーザインタフェース46(キーボード、マウス、タッチパネル、スピーカ、マイク、ランプ等)と、カメラ10、ディスプレイ20、またはその他の装置と通信可能な有線/無線の通信インタフェース47と、ディスプレイ48(ディスプレイ20と兼用であってよい)と、を備える。本実施形態に係るコンピュータ装置30の機能は、例えば、プロセッサ41が、ハードディスク装置44やROM43、リムーバブルメモリ45等にあらかじめ格納されたプログラムをRAM42等のメモリに読み出し、処理に必要な上述したデータを、ハードディスク装置44やROM43、リムーバブルメモリ45等から適宜読み出しながらプログラムを実行することで実現されうる。なお、図12に示されるハードウェア構成はあくまで一例であって、これに限定されるものではない。
10 被検カメラ
20 ディスプレイ(テストチャート)
30 コンピュータ装置
302 データ入出両部
304 ディストーションマップ生成部
306 逆投影画像生成部
308 解像度測定部
40 コンピュータ装置
41 プロセッサ
42 RAM
43 ROM
44 ハードディスク装置
45 リムーバブルメモリ
46 入出力ユーザインタフェース
47 通信インタフェース
48 ディスプレイ
Claims (7)
- コンピュータ装置によって実行されるカメラの解像度測定方法であって、
第1テストチャートの全画素の座標と、撮影視野に歪みが生じるカメラによって撮影された撮影画像における前記第1テストチャートの全画素の座標と、の対応関係を表すディストーションマップを生成するステップと、
前記ディストーションマップによって表される前記対応関係に応じて、前記撮影画像中の前記第1テストチャート内における特定エリアにおいて解像度の測定を行うための第2テストチャートの歪曲した画像である歪曲テストチャートを生成するステップと、
前記歪曲テストチャートを用いて前記特定エリアに対応する前記カメラの撮影視野の一部においてコントラスト法による解像度の測定を実行するステップと、
を含む解像度測定方法。 - 前記第1テストチャートは格子状の画像であり、
前記ディストーションマップを生成するステップにおいて、前記撮影画像における前記第1テストチャートの各格子点の座標から前記撮影画像における前記第1テストチャートの全画素の座標を補間処理によって算出する、請求項1に記載の解像度測定方法。 - 前記解像度の測定を実行するステップにおいて、前記歪曲テストチャートが外部のディスプレイ装置に出力される、請求項1に記載の解像度測定方法。
- 前記歪曲テストチャートを生成するステップにおいて、複数の空間周波数に対応した複数の前記第2テストチャートの歪曲した画像である複数の前記歪曲テストチャートが生成され、
前記解像度の測定を実行するステップにおいて、前記複数の歪曲テストチャートを用いて前記解像度の測定を実行する、
請求項1に記載の解像度測定方法。 - 請求項1から4のいずれか一項に記載の解像度測定方法を実行するコンピュータ装置。
- 請求項1から4のいずれか一項に記載の解像度測定方法を実行するコンピュータ装置と、撮影視野に歪みが生じるカメラと、ディスプレイ装置と、を含む解像度測定システムであって、
前記ディスプレイ装置は、前記コンピュータ装置が生成する前記歪曲テストチャートを表示し、
前記コンピュータ装置は、前記ディスプレイ装置によって表示される前記歪曲テストチャートを前記カメラが撮影することによって、前記解像度の測定を実行するステップを実行する、
解像度測定システム。 - コンピュータ実行可能命令を格納したコンピュータ可読媒体であって、前記コンピュータ実行可能命令が実行されると、コンピュータ装置に、請求項1から4のいずれか一項に記載の解像度測定方法を実行させる、コンピュータ可読媒体。
Priority Applications (4)
| Application Number | Priority Date | Filing Date | Title |
|---|---|---|---|
| KR1020237029450A KR102811503B1 (ko) | 2021-02-01 | 2021-02-10 | 해상도 측정 방법, 해상도 측정 시스템, 및 프로그램 |
| EP21922962.2A EP4286823B1 (en) | 2021-02-01 | 2021-02-10 | Resolution measurement method, resolution measurement system, and program |
| CN202180092268.0A CN116829918B (zh) | 2021-02-01 | 2021-02-10 | 分辨率测定方法、分辨率测定系统以及程序 |
| US18/263,690 US20240121380A1 (en) | 2021-02-01 | 2021-02-10 | Resolution measurement method, resolution measurement system, and program |
Applications Claiming Priority (2)
| Application Number | Priority Date | Filing Date | Title |
|---|---|---|---|
| JP2021-014283 | 2021-02-01 | ||
| JP2021014283A JP7304641B2 (ja) | 2021-02-01 | 2021-02-01 | チャート生成方法、解像度測定方法、解像度測定システム、およびプログラム |
Publications (1)
| Publication Number | Publication Date |
|---|---|
| WO2022162953A1 true WO2022162953A1 (ja) | 2022-08-04 |
Family
ID=82653240
Family Applications (1)
| Application Number | Title | Priority Date | Filing Date |
|---|---|---|---|
| PCT/JP2021/004940 Ceased WO2022162953A1 (ja) | 2021-02-01 | 2021-02-10 | 解像度測定方法、解像度測定システム、およびプログラム |
Country Status (7)
| Country | Link |
|---|---|
| US (1) | US20240121380A1 (ja) |
| EP (1) | EP4286823B1 (ja) |
| JP (1) | JP7304641B2 (ja) |
| KR (1) | KR102811503B1 (ja) |
| CN (1) | CN116829918B (ja) |
| TW (1) | TWI858231B (ja) |
| WO (1) | WO2022162953A1 (ja) |
Cited By (2)
| Publication number | Priority date | Publication date | Assignee | Title |
|---|---|---|---|---|
| CN115824282A (zh) * | 2022-08-25 | 2023-03-21 | 廊坊市大华夏神农信息技术有限公司 | 一种适用于多种传感器分辨力检测的计算方法和设备 |
| CN119984765A (zh) * | 2025-04-11 | 2025-05-13 | 浙江舜宇光学有限公司 | 近眼显示模组的视场角的测量方法及测量系统 |
Citations (5)
| Publication number | Priority date | Publication date | Assignee | Title |
|---|---|---|---|---|
| JPH11142292A (ja) * | 1997-11-05 | 1999-05-28 | Matsushita Electric Ind Co Ltd | Mtf測定用チャートおよびmtf測定装置 |
| JP2010281626A (ja) | 2009-06-03 | 2010-12-16 | Opto Device Corporation Co Ltd | 光学特性検査装置 |
| US20120057053A1 (en) * | 2007-06-26 | 2012-03-08 | Airbus Opertations (S.A.S) | Method for high precision lens distortion calibration and removal |
| WO2018034181A1 (ja) * | 2016-08-18 | 2018-02-22 | 株式会社Qdレーザ | 画像検査装置、画像検査方法、及び画像検査装置用部品 |
| JP6539812B1 (ja) * | 2018-07-18 | 2019-07-10 | ナルックス株式会社 | レンズの検査方法 |
Family Cites Families (16)
| Publication number | Priority date | Publication date | Assignee | Title |
|---|---|---|---|---|
| US20030035100A1 (en) * | 2001-08-02 | 2003-02-20 | Jerry Dimsdale | Automated lens calibration |
| US7308157B2 (en) * | 2003-02-03 | 2007-12-11 | Photon Dynamics, Inc. | Method and apparatus for optical inspection of a display |
| WO2005069216A1 (ja) * | 2004-01-15 | 2005-07-28 | Matsushita Electric Industrial Co., Ltd. | 光学的伝達関数の測定方法、画像復元方法、およびデジタル撮像装置 |
| CN201173856Y (zh) * | 2007-06-29 | 2008-12-31 | 北京创世都旅科技发展有限公司 | 用于检测数码相机整机性能的检测系统 |
| US8223193B2 (en) * | 2009-03-31 | 2012-07-17 | Intuitive Surgical Operations, Inc. | Targets, fixtures, and workflows for calibrating an endoscopic camera |
| GB2482022A (en) * | 2010-07-16 | 2012-01-18 | St Microelectronics Res & Dev | Method for measuring resolution and aberration of lens and sensor |
| DE102011107371A1 (de) * | 2011-07-14 | 2013-01-17 | Forschungszentrum Jülich GmbH | Verfahren zur Bestimmung der Übertragungsfunktion eines signalverarbeitenden Systems ohne bekanntes Eingangssignal |
| EP2873028A4 (en) * | 2012-06-28 | 2016-05-25 | Pelican Imaging Corp | SYSTEMS AND METHOD FOR DETECTING DEFECTIVE CAMERA ARRAYS, OPTICAL ARRAYS AND SENSORS |
| US8866913B1 (en) * | 2013-04-08 | 2014-10-21 | Omnivision Technologies, Inc. | Systems and methods for calibration of a 360 degree camera system |
| CN106162157B (zh) * | 2015-03-24 | 2018-06-26 | 惠州市德赛西威汽车电子股份有限公司 | 鱼眼摄像头的空间频率响应的测试方法 |
| US10067029B2 (en) * | 2016-02-12 | 2018-09-04 | Google Llc | Systems and methods for estimating modulation transfer function in an optical system |
| WO2018073577A2 (en) * | 2016-10-18 | 2018-04-26 | Aston Eyetech Limited | Lens examination equipment and method |
| CN108931357B (zh) * | 2017-05-22 | 2020-10-23 | 宁波舜宇车载光学技术有限公司 | 测试标靶和相应的镜头mtf检测系统及方法 |
| EP3702750B1 (en) * | 2019-03-01 | 2025-07-02 | Valeo Vision | Method for correcting a light pattern, automotive lighting device and automotive lighting assembly |
| EP3715819A1 (en) * | 2019-03-27 | 2020-09-30 | Valeo Vision | Method for correcting a light pattern, automotive lighting device and automotive lighting assembly |
| CN111610001B (zh) * | 2020-05-25 | 2021-09-21 | 中国科学院长春光学精密机械与物理研究所 | 一种宽幅遥感图像mtf地面模拟测试装置 |
-
2021
- 2021-02-01 JP JP2021014283A patent/JP7304641B2/ja active Active
- 2021-02-10 KR KR1020237029450A patent/KR102811503B1/ko active Active
- 2021-02-10 EP EP21922962.2A patent/EP4286823B1/en active Active
- 2021-02-10 CN CN202180092268.0A patent/CN116829918B/zh active Active
- 2021-02-10 WO PCT/JP2021/004940 patent/WO2022162953A1/ja not_active Ceased
- 2021-02-10 US US18/263,690 patent/US20240121380A1/en active Pending
- 2021-02-19 TW TW110105722A patent/TWI858231B/zh active
Patent Citations (5)
| Publication number | Priority date | Publication date | Assignee | Title |
|---|---|---|---|---|
| JPH11142292A (ja) * | 1997-11-05 | 1999-05-28 | Matsushita Electric Ind Co Ltd | Mtf測定用チャートおよびmtf測定装置 |
| US20120057053A1 (en) * | 2007-06-26 | 2012-03-08 | Airbus Opertations (S.A.S) | Method for high precision lens distortion calibration and removal |
| JP2010281626A (ja) | 2009-06-03 | 2010-12-16 | Opto Device Corporation Co Ltd | 光学特性検査装置 |
| WO2018034181A1 (ja) * | 2016-08-18 | 2018-02-22 | 株式会社Qdレーザ | 画像検査装置、画像検査方法、及び画像検査装置用部品 |
| JP6539812B1 (ja) * | 2018-07-18 | 2019-07-10 | ナルックス株式会社 | レンズの検査方法 |
Non-Patent Citations (1)
| Title |
|---|
| See also references of EP4286823A4 |
Cited By (2)
| Publication number | Priority date | Publication date | Assignee | Title |
|---|---|---|---|---|
| CN115824282A (zh) * | 2022-08-25 | 2023-03-21 | 廊坊市大华夏神农信息技术有限公司 | 一种适用于多种传感器分辨力检测的计算方法和设备 |
| CN119984765A (zh) * | 2025-04-11 | 2025-05-13 | 浙江舜宇光学有限公司 | 近眼显示模组的视场角的测量方法及测量系统 |
Also Published As
| Publication number | Publication date |
|---|---|
| EP4286823A4 (en) | 2024-11-13 |
| CN116829918A (zh) | 2023-09-29 |
| EP4286823A1 (en) | 2023-12-06 |
| CN116829918B (zh) | 2026-04-14 |
| US20240121380A1 (en) | 2024-04-11 |
| JP2022117666A (ja) | 2022-08-12 |
| TWI858231B (zh) | 2024-10-11 |
| TW202232936A (zh) | 2022-08-16 |
| KR20230140457A (ko) | 2023-10-06 |
| KR102811503B1 (ko) | 2025-05-22 |
| EP4286823B1 (en) | 2026-04-08 |
| JP7304641B2 (ja) | 2023-07-07 |
Similar Documents
| Publication | Publication Date | Title |
|---|---|---|
| JP7372199B2 (ja) | 投影システム、投影装置及びその表示画像の校正方法 | |
| JP4010754B2 (ja) | 画像処理装置と画像処理方法及びコンピュータ読み取り可能な記録媒体 | |
| CN108028900B (zh) | 投影设备、投影方法和程序存储介质 | |
| US8511835B2 (en) | Image processing apparatus and image processing method | |
| JP2014131257A (ja) | 画像補正システム、画像補正方法及びプログラム | |
| JP5644461B2 (ja) | 画像処理装置及びプログラム | |
| JP7304641B2 (ja) | チャート生成方法、解像度測定方法、解像度測定システム、およびプログラム | |
| JP2003283804A (ja) | 綴じ部の湾曲の補正方法およびシステム | |
| CN115086631B (zh) | 图像生成方法和信息处理装置 | |
| JP2019220887A (ja) | 画像処理装置、画像処理方法およびプログラム | |
| CN112562028B (zh) | 一种带摩尔纹图像的构造方法、装置、设备及存储介质 | |
| CN115100658A (zh) | 一种图像中纸张矫正方法、系统及存储介质 | |
| JP6742180B2 (ja) | Mtf測定装置及びそのプログラム | |
| JP2005234698A (ja) | 歪みパラメータの生成方法及び映像発生方法並びに歪みパラメータ生成装置及び映像発生装置 | |
| JP2005018195A (ja) | 画像処理装置および画像処理プログラム | |
| JP2022117666A5 (ja) | チャート生成方法、解像度測定方法、解像度測定システム、およびプログラム | |
| JP3627103B2 (ja) | 大画面表示装置 | |
| JP6748504B2 (ja) | Mtf測定用チャート | |
| JP2004165944A (ja) | 投影情報補正方法、投影情報補正装置、プログラム、および記録媒体 | |
| JP7206739B2 (ja) | 撮影装置およびプログラム | |
| JP2005228134A (ja) | 画象処理装置、画像処理方法及びプログラム | |
| JP2020038730A (ja) | 画像処理装置、画像処理方法、及びプログラム | |
| JP4484037B2 (ja) | 画像処理装置、画像処理システム、撮像装置および画像処理方法 | |
| JP4277868B2 (ja) | 画像処理装置、画像処理方法及び画像処理プログラム | |
| CN115842905B (zh) | 投射方法以及投射系统 |
Legal Events
| Date | Code | Title | Description |
|---|---|---|---|
| 121 | Ep: the epo has been informed by wipo that ep was designated in this application |
Ref document number: 21922962 Country of ref document: EP Kind code of ref document: A1 |
|
| WWE | Wipo information: entry into national phase |
Ref document number: 202180092268.0 Country of ref document: CN |
|
| WWE | Wipo information: entry into national phase |
Ref document number: 18263690 Country of ref document: US |
|
| WWE | Wipo information: entry into national phase |
Ref document number: 202317057135 Country of ref document: IN |
|
| ENP | Entry into the national phase |
Ref document number: 20237029450 Country of ref document: KR Kind code of ref document: A |
|
| WWE | Wipo information: entry into national phase |
Ref document number: 2021922962 Country of ref document: EP |
|
| NENP | Non-entry into the national phase |
Ref country code: DE |
|
| ENP | Entry into the national phase |
Ref document number: 2021922962 Country of ref document: EP Effective date: 20230901 |
|
| WWG | Wipo information: grant in national office |
Ref document number: 2021922962 Country of ref document: EP |