WO2022172852A1 - 閾値決定方法 - Google Patents
閾値決定方法 Download PDFInfo
- Publication number
- WO2022172852A1 WO2022172852A1 PCT/JP2022/004247 JP2022004247W WO2022172852A1 WO 2022172852 A1 WO2022172852 A1 WO 2022172852A1 JP 2022004247 W JP2022004247 W JP 2022004247W WO 2022172852 A1 WO2022172852 A1 WO 2022172852A1
- Authority
- WO
- WIPO (PCT)
- Prior art keywords
- image
- threshold
- staining
- determination
- threshold value
- Prior art date
- Legal status (The legal status is an assumption and is not a legal conclusion. Google has not performed a legal analysis and makes no representation as to the accuracy of the status listed.)
- Ceased
Links
Images







Classifications
-
- G—PHYSICS
- G06—COMPUTING OR CALCULATING; COUNTING
- G06T—IMAGE DATA PROCESSING OR GENERATION, IN GENERAL
- G06T7/00—Image analysis
- G06T7/0002—Inspection of images, e.g. flaw detection
- G06T7/0012—Biomedical image inspection
-
- G—PHYSICS
- G06—COMPUTING OR CALCULATING; COUNTING
- G06T—IMAGE DATA PROCESSING OR GENERATION, IN GENERAL
- G06T7/00—Image analysis
- G06T7/10—Segmentation; Edge detection
- G06T7/11—Region-based segmentation
-
- G—PHYSICS
- G01—MEASURING; TESTING
- G01N—INVESTIGATING OR ANALYSING MATERIALS BY DETERMINING THEIR CHEMICAL OR PHYSICAL PROPERTIES
- G01N1/00—Sampling; Preparing specimens for investigation
- G01N1/28—Preparing specimens for investigation including physical details of (bio-)chemical methods covered elsewhere, e.g. G01N33/50, C12Q
- G01N1/30—Staining; Impregnating ; Fixation; Dehydration; Multistep processes for preparing samples of tissue, cell or nucleic acid material and the like for analysis
-
- G—PHYSICS
- G06—COMPUTING OR CALCULATING; COUNTING
- G06T—IMAGE DATA PROCESSING OR GENERATION, IN GENERAL
- G06T2207/00—Indexing scheme for image analysis or image enhancement
- G06T2207/10—Image acquisition modality
- G06T2207/10024—Color image
-
- G—PHYSICS
- G06—COMPUTING OR CALCULATING; COUNTING
- G06T—IMAGE DATA PROCESSING OR GENERATION, IN GENERAL
- G06T2207/00—Indexing scheme for image analysis or image enhancement
- G06T2207/10—Image acquisition modality
- G06T2207/10056—Microscopic image
-
- G—PHYSICS
- G06—COMPUTING OR CALCULATING; COUNTING
- G06T—IMAGE DATA PROCESSING OR GENERATION, IN GENERAL
- G06T2207/00—Indexing scheme for image analysis or image enhancement
- G06T2207/30—Subject of image; Context of image processing
- G06T2207/30004—Biomedical image processing
- G06T2207/30024—Cell structures in vitro; Tissue sections in vitro
Definitions
- This invention relates to a method for determining a threshold value when evaluating the staining state of a stained biological specimen by image analysis.
- tissue specimen When the tissue specimen is evaluated as it is, unlike flow cytometry, which uses samples that have been pre-separated into cell units, there are a wide variety of artifact factors. For this reason, optimization of the threshold often requires subjective judgment and adjustment by an expert. However, the number of cells contained in tissue specimens is enormous, and the optimum threshold is not necessarily unique and may vary depending on specimen and imaging conditions. Furthermore, in a situation in which multiple immunohistochemical stainings (immunohistochemistry) are sequentially applied to the same specimen to analyze a large number of biological substances (referred to as multiplex immunostaining), single staining cannot occur. It is necessary to be aware of the possibility of inconsistent results such as this.
- the present invention has been made in view of the above-mentioned problems, and is a technology that can efficiently optimize the threshold value used in determining the staining state from the image of the immunohistochemically stained specimen, with human judgment. intended to provide
- One aspect of the present invention is a threshold value determination method for evaluating a stained biological specimen, and in order to achieve the above object, cells corresponding to individual cells in a processed image obtained by imaging the biological specimen are a region identifying step of identifying a region; setting a predetermined threshold for image density of the image to be processed; comparing the density with the threshold for each of the cell regions; a determination step of determining the staining state of whether the staining state of each of the cell regions is displayed, and a reception step of receiving a user's operation input for changing the determination result for each of the cell regions; and a resetting step of resetting the threshold according to the changed determination result.
- the staining state of each cell region extracted from the processed image is determined by a preset threshold value. automatically determined based on However, since the threshold value at this time is not necessarily the optimum value, the threshold value is optimized by reflecting the judgment of an expert.
- the threshold value can be corrected in the direction of approaching the optimum value.
- the thresholds can be changed and set by the user, and the judgment results based on the set thresholds are displayed so that the user can evaluate the appropriateness.
- this method a large number of cell regions appear in various places in the image, where the determination result is affected by the change of the threshold. For this reason, the task of confirming the presence or absence of such a change and the validity thereof and converging the threshold value to the optimum value is a heavy burden for the user.
- the user instead of allowing the user to directly operate the threshold value, the user receives input to modify the displayed judgment result and resets the threshold value according to the result. Therefore, if the user finds a determination result that requires correction, he/she only has to point it out, and does not need to check the results for all cell regions. Therefore, it is possible to greatly improve the efficiency of the work and reduce the burden on the user.
- the present invention judges the staining state based on the temporarily set threshold for the image of the stained biological specimen, and displays the result. Then, a change in the determination result by an operation input from the user is received, and the threshold value is reset accordingly. As a result, it is possible to efficiently optimize the threshold value for determining the staining state while making a judgment by a person.
- FIG. 4 is a flow chart showing a sample analysis method to which the threshold determination method according to the present invention is applied;
- FIG. 4 is a diagram schematically showing an example of a specimen image;
- 4 is a flow chart showing threshold determination processing of the present embodiment.
- FIG. 10 is a diagram schematically showing an example of a cell region extraction result; It is a figure which shows the example of a determination result typically. It is a figure which shows the example of a determination result typically. It is a figure which shows the example of a determination result typically. It is a figure which shows the example of a determination result typically. It is a figure which shows the example of a determination result typically.
- FIG. 10 is a diagram schematically showing an example of an image showing a determination result and a change input; FIG.
- FIG. 10 is a diagram schematically showing an example of an image showing a determination result and a change input;
- FIG. 10 is a diagram showing the principle of threshold determination processing combining a plurality of sample images;
- FIG. 10 is a diagram showing the principle of threshold determination processing combining a plurality of sample images;
- FIG. 10 is a diagram showing the principle of threshold determination processing combining a plurality of sample images;
- FIG. 10 is a diagram showing an example of an interface screen when a plurality of determination results are merged;
- FIG. 10 is a diagram showing an example of an interface screen when a plurality of determination results are merged;
- FIG. 1 is a flow chart showing an outline of a sample analysis method to which the threshold value determination method according to the present invention can be applied.
- This sample analysis method is a method for performing so-called image cytometry, in which a multi-immunostained tissue sample is imaged and the image is analyzed to obtain various types of quantitative information.
- the sample image to be processed is collected. Specifically, a tissue sample to be analyzed is stained by a predetermined staining method (step S101), and digital image data of the image is acquired (step S102). The tissue sample after imaging is decolorized (step S103). This operation is repeated until imaging is completed for all of the plurality of types of staining methods prepared in advance (step S104). In this way, a plurality of sample images corresponding to the number of staining types are collected. These specimen images are images obtained by applying different stainings to the same tissue specimen.
- a part of the tissue sample is set as an analysis target region to be analyzed (step S105). Then, from each sample image, a partial image corresponding to the analysis target region is cut out as an analysis target image. These analysis target images are aligned (registered) so that their corresponding positions match each other (step S106).
- cell regions corresponding to cells in the tissue are extracted from each analysis target image (step S107).
- Various methods are known for extracting a cell region from an image. Also in this embodiment, it is possible to appropriately select and apply such known methods. For example, it is possible to adopt a method of inputting an image to be analyzed into a learning model or artificial intelligence, which is trained in advance using various stained images as teacher images using an appropriate learning algorithm. By doing so, a cell region can be extracted from the image. Further, for example, a method of distinguishing a cell region from other regions by binarization processing of an image with an appropriate threshold, a method of specifying a contour of a cell by edge extraction, or the like can be adopted.
- the image to be analyzed may not be suitable for extracting cell regions.
- an image to be analyzed in which a specific structure inside a cell such as a cell nucleus is selectively stained does not necessarily clearly show the outline of the cell.
- such images may not be suitable for use in identifying areas occupied by individual cells in the image.
- extraction results in images stained with other staining methods that clearly show the area occupied by the cells can be used. That is, the registration process (step S106) enables alignment between the stained images. Therefore, a region corresponding to a cell region extracted from one or more other stained images can be regarded as a cell region in the analysis target image.
- the cell region in each analysis target image may be specified by a method of directly extracting the cell region from the analysis target image by image processing.
- a method of directly extracting the cell region from the analysis target image by image processing even by an indirect identification method in which regions corresponding to individual cell regions extracted using one or more images stained with other staining methods are regarded as individual cell regions in the image to be analyzed. good.
- FIG. 2 is a diagram schematically showing an example of a specimen image.
- the specimen image Is is an image containing, as a subject, at least a portion of a tissue specimen S that has been collected from a living body or produced by culturing and then stained with an appropriate staining method. Imaging can be performed, for example, by optical microscope imaging. One sample image Is is acquired for each type of staining.
- a partial image corresponding to at least a partial area Ra to be analyzed is cut out of the specimen image Is as an analysis target image Ia.
- the image to be analyzed Ia includes images of a plurality of cells C that constitute tissue.
- a cell region Rc corresponding to the cell C is extracted by appropriate image processing for region extraction.
- the cells C are represented by circles of the same size.
- cells have various sizes and shapes, and may contain multiple types of cells.
- the purpose of this processing is to calculate quantitative information on these cells C, such as their types, numbers, sizes, shapes, densities, distributions in tissues, and amounts of specific substances.
- At least one quantitative value related to the staining density is calculated for each extracted cell region (step S108).
- Various values that quantitatively represent the degree of staining of cells or biological substances in cells are used as quantitative values. For example, the average concentration of the entire cell area, the maximum concentration or the average concentration of the area where the color corresponding to the staining is particularly strong in the cell area (for example, the center or the periphery of the cell) can be used. This makes it possible to quantify how much the staining affects individual cell regions. Hereinafter, this value will be referred to as "staining density”.
- a threshold is determined for determining the staining state exhibited by the cells in the tissue with respect to the staining (step S109).
- the term “staining state” as used herein is an index that indicates whether or not cells are stained with one type of staining.
- the staining concentration is higher than a predetermined threshold value, the cell is determined to be "positive” for the staining.
- the staining density is lower than the threshold, the cell is determined to be "negative” for the staining.
- Step S109 is processing for determining a threshold for this purpose, and the threshold determination method of the present invention is applied here. The specific processing contents will be described later.
- the stained state of each cell region is determined (step S110). Furthermore, cytometry is performed to obtain various types of quantitative information representing properties of each cell region (step S111). The content of cytometry processing and the type of quantitative information obtained thereby are arbitrary. Such information is used for various pathological diagnoses and research together with images of tissue specimens. As such, this embodiment belongs to the image cytometry technique for analyzing a tissue sample in units of single cells without separating the tissue sample into individual cells.
- the threshold determination process of the present embodiment is devised so as to be able to efficiently carry out the work therefor while incorporating the user's judgment.
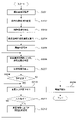
- FIG. 3 is a flowchart showing the threshold determination process of this embodiment.
- This processing is processing for reducing the influence of artifacts by optimizing the threshold value set for the staining concentration for determining the staining state (positive/negative) of cells.
- this threshold determination process is performed for each of a plurality of types of staining. That is, a threshold is set for each specimen image captured with one stain. In practice it is possible to perform thresholding for several stains simultaneously. However, in order to explain the principle, the processing for determining the threshold value for one stain will be described below.
- This processing can be realized by executing a predetermined control program by a processing device having an appropriate arithmetic function, such as a general-purpose computer device.
- a processing device for this purpose requires an arithmetic processing unit having an arithmetic function, an accepting unit for accepting an operation input from a user, and a display unit for displaying an image.
- a processing device having a general hardware configuration such as a personal computer can be used. Therefore, a detailed description of the device configuration for executing this process is omitted here.
- a sample image Is for each stain is acquired (step S201).
- An analysis target area Ra is set therein (step S202), and an analysis target image Ia is cut out.
- a cell region Rc is extracted from the clipped analysis target image Ia (step S203), and the staining density is calculated for each cell region (step S204).
- FIG. 4 is a diagram schematically showing an example of extraction results of cell regions.
- the image to be analyzed Ia is divided into a cell region Rc corresponding to the cell C and a surrounding background region by appropriate image processing.
- the following quantification processing is performed for each of these cell regions Rc.
- an appropriate threshold is provisionally set for the dyeing density (step S205).
- the staining concentration which is a quantitative value regarding the concentration of each cell region Rc obtained previously
- the threshold value By comparing the staining concentration, which is a quantitative value regarding the concentration of each cell region Rc obtained previously, with the threshold value, the staining state of each cell, that is, whether the cell is positive or negative for the staining is determined. (step S206). Specifically, the staining density obtained for each cell region Rc is compared with a set threshold value, and if the staining density is higher than the threshold value, the cell region Rc is determined to be positive for the staining. On the other hand, if the staining density is lower than the threshold, this cell region Rc is determined to be negative for the staining. Whether the staining density is determined to be positive or negative when the staining concentration is equal to the threshold value may be determined as long as the determination criteria are constant.
- the threshold at this time is a provisionally set initial value.
- the initial value may be a predetermined value, or may be a value designated by the user's setting input.
- the image may be analyzed by a known image processing algorithm used for image binarization, such as the discriminant analysis method or Otsu's method, and the calculated threshold value may be applied as the initial value.
- the determination result is displayed on an appropriate display device, for example, the display screen of a computer device, and presented to the user (step S207).
- the display of the determination result is a display in which visual information representing the determination result is superimposed on the original analysis target image Ia.
- the original analysis target image Ia that has not been processed and the image representing the determination result may be displayed side by side.
- FIG. 5A to 5D are diagrams schematically showing examples of determination results.
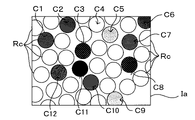
- FIG. 5A is a diagram schematically showing an example of the analysis target image Ia. Each cell in the stained tissue specimen is stained to various densities. In the analysis target image Ia obtained by picking up this, each cell region Rc has various brightnesses according to the staining density of the cells. Cells denoted by symbols C1 to C12 in FIG. 5A are cells stained at a certain level or higher, and FIG. 5B is a graph showing these staining densities.
- the circles represented by symbols C1, C2, etc. in each figure after FIG. 5A are regions in the image in which there is an image corresponding to the cell C in the sample S, that is, the "cell region” Rc.
- cell regions in images may also be simply referred to as “cells” unless there is a particular need to distinguish them.
- 5C and 5D schematically show an example in which the analysis target image Ia shown in FIG. 5A and an image in which the image processing indicating the cells determined to be positive by hatching are superimposed and added are arranged.
- FIG. 5C corresponds to this situation, with each cell listed here hatched.
- the left figure is an image Ia1 superimposed with hatching representing the determination result while leaving the density information of the cells in the original analysis target image Ia, and the right figure shows only the outline of the cell and the determination result. It is.
- FIG. 5D shows the state at this time. Also in this case, the left figure is an image Ia2 in which hatching indicating the determination result is superimposed on the density information of the cells, and the right figure shows only the outline of the cell and the determination result.
- the judgment results change, but it is not necessarily easy for the user to intuitively perceive the change. That is, for example, when the user manually changes the set value of the threshold value, the determination result changes accordingly, and the change can appear in various modes at various positions within the image. For this reason, it is not easy for the user to check them one by one and accurately determine in a short time whether or not the change in the threshold is in the direction of approaching the optimum value.
- the determination result for each cell is presented to the user by screen display. Then, a change input is accepted, and the threshold value is recalculated so as to reflect the change result. That is, the threshold value is corrected by the user instructing the correct determination for the cells determined to require modification because the determination result is not appropriate. Thereby, the judgment of a user having specialized knowledge can be reflected in the threshold.
- the threshold value instead of directly manipulating the threshold value, it is only necessary to look over the image to which the determination result is added and change the determination of those deemed to require correction. Therefore, the user can perform operation input based on more intuitive judgment.
- step S207 shows the determination result of the staining state (positive/negative) based on the current threshold.
- operation input can be received from an appropriate input device such as a keyboard, mouse, or touch panel.
- step S208 When an operation input indicating that no correction is necessary is received (NO in step S208), the threshold at that time is determined as the optimum value (step S209), and the threshold determination process ends. On the other hand, if the user makes an input for change, it is determined that correction is necessary (YES in step S208). In this case, the change input is accepted (step S210) until the user indicates the intention to complete the input (step S211). When the change input by the user is completed (YES in step S211), the threshold is reset so as to reflect the changed result (step S212).
- step S206 the staining state of each cell is determined again using the reset threshold value (step S206), and the result is displayed (step S207). Thereby, the user can confirm the determination result based on the newly set threshold value. Then, in the same manner as described above, by repeating the process of changing the determination result as necessary and resetting the threshold accordingly, the threshold can be brought closer to the optimum value.
- FIGs. 6A and 6B are diagrams schematically showing examples of images showing determination results and change inputs.
- An image Ia3 shown in the upper part of FIG. 6A is an image obtained by adding hatching to the original analysis target image Ia to show the determination result based on the initially set threshold value Th1.
- the shading of each cell region Rc in the figure represents the staining density of the corresponding cell.
- FIG. 6B is a graph of the staining densities of the cells C1 to C12, and the staining densities are the same as those shown in FIG. 5B.
- the hatched ones represent that the cells corresponding to the cell region were determined to be positive.
- Cell regions corresponding to cells C1 to C3, C6, C8, C10, and C11 having staining densities higher than the threshold Th1 are hatched to indicate positive determination.
- non-hatched cells indicate that the cells were determined to be negative.
- cells determined to be negative may include cells with no or little staining, as well as cells that are affected by staining to some extent but whose concentration does not reach the threshold.
- the image displayed in step S206 may be an image obtained by superimposing information representing the determination result on the original analysis target image Ia, or may be an image representing only the determination result, as exemplified here. . In this case, it is more preferable to display the unprocessed analysis target image Ia and the image Ia3 representing the determination result side by side in order to facilitate the user's observation. Furthermore, it may be an image in which an unprocessed image to be analyzed Ia and an image Ia3 superimposed with the determination result are arranged.
- the user can change the determination result for the image in which each cell region is given a positive or negative determination result.
- the user can designate a cell for which the determination result is to be changed.
- a cell region corresponding to cell C7 is specified.
- the user can express his/her intention to change the determination by, for example, clicking the mouse.
- FIG. 6A shows an example Ia4 of the image after the change input, and the cell C7 designated by the user is newly hatched. This indicates that the judgment result has changed from negative to positive. Conversely, if the specified cell was determined to be positive, the determination result is changed to negative. In this case, the hatching is removed from the changed image Ia4. In this manner, the user can sequentially select cells to be changed and change the determination result.
- Such a change operation by the user can be considered as a teaching input by the user regarding the suitability of the judgment result. That is, it can be said that the user instructed that the determination result of the cell for which the determination was changed was an erroneous determination. On the other hand, it can be said that the user has instructed that the automatically determined result is correct even for the cells that have not been changed. However, it does not mean that all determination results after inputting changes are correct. This is because it may include erroneous judgments overlooked by the user and cases in which the user's change itself is erroneous. In principle, it is practically impossible to appropriately determine the staining state of all cells with only a single threshold value. For this reason, it is preferable to reset the threshold value by regarding the results of the change work by the user, including those that have not been changed, as a "tentatively correct answer".
- the reset threshold does not need to return a judgment result that completely matches the judgment result after the change by the user. That is, the threshold may be adjusted so that the result of re-determination based on the new threshold is as close as possible to the determination result after the change by the user. Specifically, the discrepancy between the judgment result obtained when the judgment is executed based on the reset threshold and the judgment result after the change by the user is caused when the threshold is temporarily set. It suffices if the divergence between the previous determination result and the determination result after the change by the user is smaller. Thereby, the determination result based on the threshold value can be made closer to the subjectivity of the user.
- the threshold is smaller when the former is significantly higher, and vice versa.
- change the threshold to be larger By doing so, the instruction by the user can be reflected in the threshold value.
- the threshold For example, it is possible to statistically process staining densities of cells for which determination has been changed by the user, and to use, for example, an average value or a median value as a new threshold value.
- the cell staining density value changed from "negative to positive” and the cell staining density value changed from "positive to negative” can be handled separately. For example, they may be weighted differently and used for calculation.
- the value of the staining density of cells whose determination results have not been changed may be taken into account in the calculation.
- the cell densities of all cells may be used, or only the cell densities of some cells whose cell densities are close to the threshold value may be used.
- various automatic calculation methods can be applied to bisect the area in the distribution indicated by the staining density of each cell.
- the aforementioned Otsu method, discriminant analysis method, multivariate analysis such as support vector machine (SVM), and calculation methods using machine learning algorithms can be applied.
- SVM support vector machine
- the machine learning method it is also possible to apply fine-tuning in which additional learning is performed using data changed by the user from the learned state.
- the threshold is changed from the initial value Th1 to the value Th3 as shown in FIG. 6B.
- This value Th3 is a threshold value for newly determining the cell C7 as positive.
- cell C7 which was originally determined to be negative, was treated as positive, while cell C12, which was determined to be negative and was not changed, was treated with a higher staining density than cell C12 in order to maintain the determination result.
- a threshold will be set to a value lower than the staining density. If the determination is changed for the cell C12 as well, the value will be lower than the staining density. Conversely, for example, if the positive determination of the cell C10 has been changed to negative, the threshold is changed in the direction of determining the cell C10 as negative, that is, to a larger value.
- the result of re-determination based on the new threshold is displayed (steps S207 and S208).
- visual information different from other cell regions is given to the cell region for which a result different from the previous determination is obtained, in order to facilitate the discovery of the cell region. For example, it is possible to emphasize the outline of the cell region, blink the cell region, or alternately display the previous determination result and the new determination result temporally. This makes it easier for the user to find a cell whose determination has changed.
- An image representing the previous determination result and an image representing the new determination result may be displayed side by side.
- the displayed image has a high magnification.
- a lower-magnification image is preferable in order to confirm the overall determination result. Therefore, the high-magnification image and the low-magnification image each superimposed with the determination result may be displayed selectively or simultaneously.
- the field of view of the low-magnification image includes the entire field of view of the high-magnification image, in other words, the high-magnification image is an enlarged part of the low-magnification image.
- FIGS. 7A to 7C are diagrams showing the principle of threshold determination processing combining a plurality of sample images.
- FIGS. 7A and 7B show images obtained by staining the same specimen with two different staining methods and capturing images.
- the staining method corresponding to FIG. 7A is called “staining A”
- the staining method corresponding to FIG. 7B is called “staining B”.
- these two staining methods do not stain the same cells.
- the same cell is not positive for both staining A and staining B.
- proteins known to be expressed in T cells such as CD3, CD4, and CD8, are not expressed in B cells, and conversely, proteins such as CD20 and CD79a, which are expressed in B cells, are not expressed in T cells. .
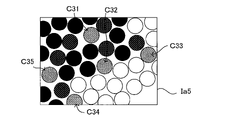
- image Ia5 shown in FIG. 7A cells stained with various concentrations of stain A are distributed mainly in the upper left part of the figure.
- image Ia6 shown in FIG. 7B cells stained with stain B are distributed mainly in the lower right side of the figure.
- staining A and staining B are not inherently expressed together in one cell.
- the image Ia7 shown in the upper part of FIG. 7C is an image in which the dyeing state determination results obtained by temporarily setting appropriate threshold values for the dyeing A and the dyeing B are superimposed on each other.
- the threshold can be readjusted. That is, the user can check the determination result and, when determining that correction is necessary, specify the cell and instruct the correct determination. Specifically, for example, as shown as image Ia8 after correction in the lower part of FIG. With regard to C34, one of the determinations can be changed based on the staining state, comparison with surrounding cells, and the like. In this example, the cell C32 is changed from positive to negative by staining B, and the cells C33 and C34 are changed from negative to positive by staining A. In this way, it is possible to eliminate inconsistency in the determination result with the provisionally set threshold value.
- the confirmation and correction work can be performed comprehensively by the user by looking at the images Ia5 and Ia6 representing the staining results and the image Ia7 combining the individual judgment results.
- the images Ia5 to Ia7 are displayed side by side on the same screen.
- at least two of these images Ia5 to Ia7 may be superimposed and displayed. While viewing the display screen, the user can determine which cells require correction based on the degree of staining of each cell, comparison with surrounding cells, and the like.
- the threshold for the staining is recalculated and a new threshold is set.
- the specific method is as described above. If the decision has not changed, the current threshold can be established as the optimal value for that stain.
- the determination can be changed for both staining A and staining B here, the specification may be such that the determination can be changed for only one type of staining, for example. For example, in a state in which the threshold for stain A has already been optimized, it is not preferable to change the determination result for stain A in order to determine the threshold for stain B. In this case, dyeing A can be prohibited from being changed.
- FIGS. 8A and 8B are diagrams showing an example of an interface screen when a plurality of determination results are merged and a change input is received.
- FIG. 8A when the user designates a cell for which the determination result is to be confirmed by operating the mouse or the like with the pointer 61, the determination result for the cell is popped up.
- the cell C33 is specified, and on the pop-up screen P, check boxes for both staining A and staining B are checked. This means that the determination result was positive for each of staining A and staining B.
- the user can perform an operation input to change the determination from positive to negative by performing an operation to uncheck the staining for which the determination is to be changed. Conversely, when changing from negative to positive, a new check should be added to the corresponding staining. Even when three or more stainings are combined, it is possible to display the determination results on the pop-up screen P and make changes in the same manner.
- the user interface for inputting changes is not limited to this.
- the judgment results are displayed together, but if the change input is accepted only for staining B, the judgment is changed when the cell area corresponding to the cell is clicked, as in the previous example. You may do so.
- one threshold value is set for the rectangular analysis target region Ra selected by the user from the sample image Is.
- the tissue within the analysis target region contains a plurality of mutually different structures, even cells of the same type may have different staining densities. This is the case, for example, when the tissue is divided into cortex and medulla.
- the division of the analysis target area can be performed, for example, as follows.
- Various area division methods can be used as a method for automatically dividing by image processing.
- the image within the analysis target area can be smoothed by low-pass filter processing, and the image can be divided into a plurality of areas according to the difference in density.
- a specific method for example, from a sample image stained with proteins expressed by cells known to exist in a specific area, an area where stained cells exist at high density is extracted, and that area and other areas are extracted. can be considered.
- a skilled user can, for example, use an image in which cell nuclei are stained to distinguish structural differences from cell shape and arrangement.
- the area can be specified by drawing a free-form curve on the image of the analysis target area displayed on the screen.
- the analysis target region Ra is selected by the user, but the analysis target region Ra may be automatically determined from the specimen image Is.
- the sample image Is may be automatically divided into several blocks of the same size, and these block images may be given priority and presented as the analysis target region Ra in order.
- it is effective to reduce the influence of artifacts, for example, by preferentially setting blocks that may contain many artifacts as analysis target regions.
- the tissue sample S corresponds to the "specimen” of the present invention
- the sample image Is and the analysis target image Ia obtained by capturing this are the "original image” and “image” of the present invention, respectively.
- “Image to be processed" For example, the images shown in FIGS. 5C and 6A correspond to the "result image” of the present invention.
- steps S201 to S203 correspond to the "region identifying process” of the present invention
- steps S205 to S206 correspond to the "determining process” of the present invention.
- steps S207 to S211 correspond to the "accepting step” of the present invention
- step S212 corresponds to the "resetting step” of the present invention.
- step S207 executed after execution of step S212 corresponds to the "redisplay step” of the present invention.
- the present invention is not limited to the above-described embodiments, and various modifications other than those described above can be made without departing from the spirit of the present invention.
- the combination of multiple types of staining results is not limited to this and is arbitrary.
- Specimen images obtained by staining methods such as nuclear staining, which can effectively stain specific cells and biological substances, serve effectively as objects for comparison with specimen images obtained by other staining methods. is. Therefore, it is reasonable to combine such images with other images to perform threshold optimization in the other images.
- the threshold determination process of the above embodiment is a process of optimizing the thresholds for each of staining A and staining B using specimen images for staining A and staining B and their determination results.
- dyeing A and dyeing B are treated equally.
- priorities may be set for a plurality of types of staining, and the thresholds may be optimized in order according to the priorities. For example, an optimal threshold can first be established for a stain that serves as a basis for setting thresholds for other stains, and the results can be used to optimize thresholds for other stains. This makes it possible to stabilize the optimization result.
- the threshold for staining A is optimized in consideration of the results of staining B, staining C, etc., and the thresholds for other stainings are optimized based on that. method can be adopted. It should be noted that there may be a plurality of types of dyeing used as a reference.
- the user interface in the above embodiment is an example.
- the method of presenting the determination result to the user and the method of accepting the operation input from the user are not limited to the above, and any method can be used.
- a result image obtained by superimposing information representing the determination result on the image to be processed is displayed.
- the image to be processed and the resulting image may be displayed on the same screen.
- the biological specimen may be multiple immunohistochemically stained.
- determination results of multiple types of immunohistochemical staining may be displayed.
- the staining state is determined for each of the multiple types of immunohistochemical staining
- operation input is received for each of the multiple types of immunohistochemical staining
- the resetting step multiple types of immune tissue staining are performed.
- the configuration may be such that the threshold value is reset for each tissue staining. According to such a configuration, the optimization of thresholds for multiple types of staining can proceed in parallel.
- the determination step, reception step, and resetting step may be performed for each of a plurality of types of immunohistochemical staining.
- this corresponds to a process of sequentially determining threshold values for a plurality of staining types one by one. According to such a configuration, it is possible to improve work efficiency by optimizing the threshold values in descending order of priority among the plurality of types of dyeing.
- the threshold determination method in the resetting step, the discrepancy between the determination result obtained when the determination step is executed based on the reset threshold and the determination result after the change based on the operation input is assumed to be It is preferable that the threshold is reset so as to be smaller than the deviation between the determination result in the previous determination step executed based on the set threshold and the determination result after the change based on the operation input. According to such a configuration, it is possible to obtain a determination result closer to the user's subjective determination by resetting the threshold.
- the image to be processed may be divided into a plurality of regions, and thresholds may be set individually for the plurality of regions. Even the same cells may have different staining states depending on the state of the surrounding tissue or the formation of a specific structure. By setting a threshold value for each region obtained by dividing the image to be processed into a plurality of regions, it is possible to perform appropriate determination regardless of such a difference in staining state.
- the processed image is obtained by cutting out a partial area from the original image of the biological specimen, and the threshold is set individually for each of the multiple processed images at different positions in the original image.
- the threshold is set individually for each of the multiple processed images at different positions in the original image.
- a result display step may be provided for executing the determination step based on the reset threshold value and displaying a new determination result.
- the user can verify the adjustment result by presenting the determination result based on the reset threshold value to the user.
- the determination process, the reception process, and the reset process may be executed again based on the reset threshold. According to such a configuration, it is possible to bring the threshold value closer to the optimum value by repeating resetting of the threshold value, verification thereof, and readjustment of the threshold value based thereon.
- This invention is applicable in the fields of medical and biological research to the determination of the staining state based on the image of an immunohisto-stained tissue specimen.
- it is suitable for use in single-cell analysis of multiple immunostained specimens.
Landscapes
- Engineering & Computer Science (AREA)
- Computer Vision & Pattern Recognition (AREA)
- Theoretical Computer Science (AREA)
- General Physics & Mathematics (AREA)
- Physics & Mathematics (AREA)
- Medical Informatics (AREA)
- Quality & Reliability (AREA)
- Radiology & Medical Imaging (AREA)
- Nuclear Medicine, Radiotherapy & Molecular Imaging (AREA)
- Health & Medical Sciences (AREA)
- General Health & Medical Sciences (AREA)
- Investigating Or Analysing Biological Materials (AREA)
- Investigating Or Analysing Materials By Optical Means (AREA)
- Image Analysis (AREA)
Abstract
Description
Ia 解析対象画像(被処理画像)
Is 標本画像(原画像)
Ra 解析対象領域
Rc 細胞領域
S 組織標本(標本)
S201~S203 領域特定工程
S205~S206 判定工程
S207~S211 受付工程、再表示工程
S212 再設定工程
Claims (11)
- 染色された生物標本を評価するための閾値決定方法であって、
前記生物標本を撮像した被処理画像のうち個々の細胞に対応する細胞領域を特定する領域特定工程と、
前記被処理画像の画像濃度に対して閾値を仮設定し、前記細胞領域各々につきその濃度と前記閾値とを比較して、染色に対し陽性であるか陰性であるかの染色状態を判定する判定工程と、
前記細胞領域各々の前記染色状態の判定結果を表示し、前記判定結果を変更するためのユーザーの操作入力を前記細胞領域ごとに受け付ける受付工程と、
変更後の前記判定結果に応じて前記閾値を再設定する再設定工程と
を備える閾値決定方法。 - 前記受付工程では、前記被処理画像に前記判定結果を表す情報を重畳した結果画像を表示する請求項1に記載の閾値決定方法。
- 前記被処理画像と前記結果画像とを同一画面に表示する請求項2に記載の閾値決定方法。
- 前記生物標本は多重免疫組織染色されたものであり、前記受付工程では複数種の免疫組織染色における判定結果を表示する請求項1ないし3のいずれかに記載の閾値決定方法。
- 前記判定工程では、複数種の免疫組織染色のそれぞれについて前記染色状態の判定を行い、
前記受付工程では、複数種の免疫組織染色のそれぞれについて前記操作入力を受け付け、
前記再設定工程では、複数種の免疫組織染色のそれぞれについて前記閾値の再設定を行う請求項4に記載の閾値決定方法。 - 前記生物標本は多重免疫組織染色されたものであり、複数種の免疫組織染色のそれぞれについて、前記判定工程、前記受付工程および前記再設定工程を実行する請求項1ないし3のいずれかに記載の閾値決定方法。
- 前記再設定工程では、再設定された前記閾値に基づき前記判定工程を実行した場合に得られる判定結果と前記操作入力に基づく変更後の判定結果との乖離が、仮設定された前記閾値に基づき実行された先の前記判定工程における判定結果と前記操作入力に基づく変更後の判定結果との乖離よりも小さくなるように、前記閾値を再設定する請求項1ないし6のいずれかに記載の閾値決定方法。
- 前記被処理画像を複数の領域に分割し、該複数の領域に対し個別に前記閾値を設定する請求項1ないし7のいずれかに記載の閾値決定方法。
- 前記被処理画像は、前記生物標本を撮像した原画像のうち一部領域を切り出したものであり、前記原画像中の位置が互いに異なる複数の前記被処理画像のそれぞれについて個別に前記閾値を設定する請求項1ないし8のいずれかに記載の閾値決定方法。
- 再設定された前記閾値に基づき前記判定工程を実行し、新たな判定結果を表示する結果表示工程を備える請求項1ないし9のいずれかに記載の閾値決定方法。
- 再設定された前記閾値に基づき、前記判定工程、前記受付工程および前記再設定工程を再度実行する請求項1ないし10のいずれかに記載の閾値決定方法。
Priority Applications (2)
| Application Number | Priority Date | Filing Date | Title |
|---|---|---|---|
| EP22752679.5A EP4293616A4 (en) | 2021-02-12 | 2022-02-03 | METHOD FOR DETERMINING THRESHOLD VALUE |
| US18/276,535 US12505542B2 (en) | 2021-02-12 | 2022-02-03 | Threshold determination method |
Applications Claiming Priority (2)
| Application Number | Priority Date | Filing Date | Title |
|---|---|---|---|
| JP2021020829A JP7653267B2 (ja) | 2021-02-12 | 2021-02-12 | 閾値決定方法 |
| JP2021-020829 | 2021-02-12 |
Publications (1)
| Publication Number | Publication Date |
|---|---|
| WO2022172852A1 true WO2022172852A1 (ja) | 2022-08-18 |
Family
ID=82837839
Family Applications (1)
| Application Number | Title | Priority Date | Filing Date |
|---|---|---|---|
| PCT/JP2022/004247 Ceased WO2022172852A1 (ja) | 2021-02-12 | 2022-02-03 | 閾値決定方法 |
Country Status (4)
| Country | Link |
|---|---|
| US (1) | US12505542B2 (ja) |
| EP (1) | EP4293616A4 (ja) |
| JP (1) | JP7653267B2 (ja) |
| WO (1) | WO2022172852A1 (ja) |
Cited By (1)
| Publication number | Priority date | Publication date | Assignee | Title |
|---|---|---|---|---|
| WO2024176518A1 (ja) * | 2023-02-21 | 2024-08-29 | 株式会社Screenホールディングス | 画像表示方法、画像表示装置およびプログラム |
Families Citing this family (3)
| Publication number | Priority date | Publication date | Assignee | Title |
|---|---|---|---|---|
| JP2024016378A (ja) * | 2022-07-26 | 2024-02-07 | 株式会社Screenホールディングス | 解析支援方法、プログラムおよび解析支援装置 |
| JP2024135131A (ja) * | 2023-03-22 | 2024-10-04 | 株式会社Screenホールディングス | 領域選定支援方法、領域選定支援装置およびプログラム |
| JP2025044522A (ja) | 2023-09-20 | 2025-04-02 | 株式会社Screenホールディングス | 染色強度取得方法、プログラムおよび染色強度取得装置 |
Citations (3)
| Publication number | Priority date | Publication date | Assignee | Title |
|---|---|---|---|---|
| JP2010252648A (ja) * | 2009-04-22 | 2010-11-11 | Olympus Corp | 細胞解析方法 |
| WO2016027542A1 (ja) * | 2014-08-18 | 2016-02-25 | 株式会社Screenホールディングス | 閾値決定方法、画像処理方法および画像処理装置 |
| JP6187989B2 (ja) | 2012-04-30 | 2017-08-30 | ゼネラル・エレクトリック・カンパニイ | 生物組織に共局在するバイオマーカーを解析するためのシステム及び方法 |
Family Cites Families (5)
| Publication number | Priority date | Publication date | Assignee | Title |
|---|---|---|---|---|
| GB0410499D0 (en) | 2004-05-11 | 2004-06-16 | Fairfield Imaging Ltd | Method and apparatus for use in the image analysis of biological specimens |
| KR20090074155A (ko) | 2006-08-04 | 2009-07-06 | 아이코니시스 인코포레이티드 | 현미경 시스템의 이미지 처리 방법 |
| US20100303809A1 (en) * | 2009-06-01 | 2010-12-02 | Targeted Molecular Diagnostics, Llc | Methods for the detection and quantitation of pten |
| CA3012360C (en) * | 2016-03-01 | 2021-12-14 | Ventana Medical Systems, Inc. | Improved image analysis algorithms using control slides |
| US12039796B2 (en) * | 2019-02-01 | 2024-07-16 | Sartorius Bioanalytical Instruments, Inc. | Method for classifying cells |
-
2021
- 2021-02-12 JP JP2021020829A patent/JP7653267B2/ja active Active
-
2022
- 2022-02-03 WO PCT/JP2022/004247 patent/WO2022172852A1/ja not_active Ceased
- 2022-02-03 EP EP22752679.5A patent/EP4293616A4/en active Pending
- 2022-02-03 US US18/276,535 patent/US12505542B2/en active Active
Patent Citations (3)
| Publication number | Priority date | Publication date | Assignee | Title |
|---|---|---|---|---|
| JP2010252648A (ja) * | 2009-04-22 | 2010-11-11 | Olympus Corp | 細胞解析方法 |
| JP6187989B2 (ja) | 2012-04-30 | 2017-08-30 | ゼネラル・エレクトリック・カンパニイ | 生物組織に共局在するバイオマーカーを解析するためのシステム及び方法 |
| WO2016027542A1 (ja) * | 2014-08-18 | 2016-02-25 | 株式会社Screenホールディングス | 閾値決定方法、画像処理方法および画像処理装置 |
Non-Patent Citations (1)
| Title |
|---|
| See also references of EP4293616A4 |
Cited By (1)
| Publication number | Priority date | Publication date | Assignee | Title |
|---|---|---|---|---|
| WO2024176518A1 (ja) * | 2023-02-21 | 2024-08-29 | 株式会社Screenホールディングス | 画像表示方法、画像表示装置およびプログラム |
Also Published As
| Publication number | Publication date |
|---|---|
| EP4293616A4 (en) | 2025-01-01 |
| JP2022123488A (ja) | 2022-08-24 |
| JP7653267B2 (ja) | 2025-03-28 |
| US20230419483A1 (en) | 2023-12-28 |
| US12505542B2 (en) | 2025-12-23 |
| EP4293616A1 (en) | 2023-12-20 |
Similar Documents
| Publication | Publication Date | Title |
|---|---|---|
| WO2022172852A1 (ja) | 閾値決定方法 | |
| EP3588382B1 (en) | A deep learning method for tumor cell scoring on cancer biopsies | |
| Gilles et al. | DiAna, an ImageJ tool for object-based 3D co-localization and distance analysis | |
| JP6763781B2 (ja) | 複数の染色で染色されている生物組織サンプルから取得されるマルチチャネル画像を分析するための画像処理方法及びシステム | |
| US10685045B2 (en) | Systems and methods for cluster matching across samples and guided visualization of multidimensional cytometry data | |
| JP2022527145A (ja) | 予測的組織パターン特定のためのマルチプルインスタンスラーナ | |
| US11062168B2 (en) | Systems and methods of unmixing images with varying acquisition properties | |
| Ozcan et al. | Automated detection of soma location and morphology in neuronal network cultures | |
| US10586376B2 (en) | Automated method of predicting efficacy of immunotherapy approaches | |
| WO2020004101A1 (ja) | 表示制御装置、表示制御方法及び表示制御プログラム | |
| US12087454B2 (en) | Systems and methods for the detection and classification of biological structures | |
| Ferrer‐Font et al. | Ensuring full spectrum flow cytometry data quality for high‐dimensional data analysis | |
| US9785848B2 (en) | Automated staining and segmentation quality control | |
| Ramin et al. | Counting the number of cells in immunocytochemical images using genetic algorithm | |
| US20050273271A1 (en) | Method of characterizing cell shape | |
| EP3576096A1 (en) | Sensitivity analysis for digital pathology | |
| CN106802346A (zh) | 一种基于免疫组化技术的病理辅助分析方法 | |
| US11908130B2 (en) | Apparatuses and methods for digital pathology | |
| Samanta et al. | Deep learning fuzzy inference: An interpretable model for detecting indirect immunofluorescence patterns associated with nasopharyngeal cancer | |
| Bannah et al. | Real-Time Nuclei Classification and Allred Scoring in PR-IHC Stained Breast Cancer Histopathology Images | |
| Saidul et al. | The utility of a deep learning-based approach in Her-2/neu assessment in breast cancer | |
| Sergeev et al. | Development of automated computer vision methods for cell counting and endometrial gland detection for medical images processing | |
| Shu et al. | Biomarker detection in whole slide imaging based on statistical color models | |
| Roszkowiak et al. | Improvements to segmentation method of stained lymphoma tissue section images | |
| US12620069B2 (en) | Processing multiplex images and analysis of immune enriched spatial proteomic data |
Legal Events
| Date | Code | Title | Description |
|---|---|---|---|
| 121 | Ep: the epo has been informed by wipo that ep was designated in this application |
Ref document number: 22752679 Country of ref document: EP Kind code of ref document: A1 |
|
| WWE | Wipo information: entry into national phase |
Ref document number: 18276535 Country of ref document: US |
|
| WWE | Wipo information: entry into national phase |
Ref document number: 2022752679 Country of ref document: EP |
|
| NENP | Non-entry into the national phase |
Ref country code: DE |
|
| ENP | Entry into the national phase |
Ref document number: 2022752679 Country of ref document: EP Effective date: 20230912 |