WO2022230107A1 - ダイヤモンドの窒素濃度の測定方法およびダイヤモンドの窒素濃度の測定装置 - Google Patents
ダイヤモンドの窒素濃度の測定方法およびダイヤモンドの窒素濃度の測定装置 Download PDFInfo
- Publication number
- WO2022230107A1 WO2022230107A1 PCT/JP2021/016972 JP2021016972W WO2022230107A1 WO 2022230107 A1 WO2022230107 A1 WO 2022230107A1 JP 2021016972 W JP2021016972 W JP 2021016972W WO 2022230107 A1 WO2022230107 A1 WO 2022230107A1
- Authority
- WO
- WIPO (PCT)
- Prior art keywords
- diamond
- nitrogen concentration
- visible light
- integrating sphere
- reflectance
- Prior art date
- Legal status (The legal status is an assumption and is not a legal conclusion. Google has not performed a legal analysis and makes no representation as to the accuracy of the status listed.)
- Ceased
Links
Images






Classifications
-
- G—PHYSICS
- G01—MEASURING; TESTING
- G01N—INVESTIGATING OR ANALYSING MATERIALS BY DETERMINING THEIR CHEMICAL OR PHYSICAL PROPERTIES
- G01N21/00—Investigating or analysing materials by the use of optical means, i.e. using sub-millimetre waves, infrared, visible or ultraviolet light
- G01N21/84—Systems specially adapted for particular applications
- G01N21/87—Investigating jewels
-
- G—PHYSICS
- G01—MEASURING; TESTING
- G01J—MEASUREMENT OF INTENSITY, VELOCITY, SPECTRAL CONTENT, POLARISATION, PHASE OR PULSE CHARACTERISTICS OF INFRARED, VISIBLE OR ULTRAVIOLET LIGHT; COLORIMETRY; RADIATION PYROMETRY
- G01J3/00—Spectrometry; Spectrophotometry; Monochromators; Measuring colours
- G01J3/46—Measurement of colour; Colour measuring devices, e.g. colorimeters
-
- G—PHYSICS
- G01—MEASURING; TESTING
- G01N—INVESTIGATING OR ANALYSING MATERIALS BY DETERMINING THEIR CHEMICAL OR PHYSICAL PROPERTIES
- G01N21/00—Investigating or analysing materials by the use of optical means, i.e. using sub-millimetre waves, infrared, visible or ultraviolet light
- G01N21/17—Systems in which incident light is modified in accordance with the properties of the material investigated
- G01N21/25—Colour; Spectral properties, i.e. comparison of effect of material on the light at two or more different wavelengths or wavelength bands
- G01N21/27—Colour; Spectral properties, i.e. comparison of effect of material on the light at two or more different wavelengths or wavelength bands using photo-electric detection ; circuits for computing concentration
-
- G—PHYSICS
- G01—MEASURING; TESTING
- G01N—INVESTIGATING OR ANALYSING MATERIALS BY DETERMINING THEIR CHEMICAL OR PHYSICAL PROPERTIES
- G01N21/00—Investigating or analysing materials by the use of optical means, i.e. using sub-millimetre waves, infrared, visible or ultraviolet light
- G01N21/17—Systems in which incident light is modified in accordance with the properties of the material investigated
- G01N21/25—Colour; Spectral properties, i.e. comparison of effect of material on the light at two or more different wavelengths or wavelength bands
- G01N21/31—Investigating relative effect of material at wavelengths characteristic of specific elements or molecules, e.g. atomic absorption spectrometry
-
- G—PHYSICS
- G01—MEASURING; TESTING
- G01N—INVESTIGATING OR ANALYSING MATERIALS BY DETERMINING THEIR CHEMICAL OR PHYSICAL PROPERTIES
- G01N21/00—Investigating or analysing materials by the use of optical means, i.e. using sub-millimetre waves, infrared, visible or ultraviolet light
- G01N21/17—Systems in which incident light is modified in accordance with the properties of the material investigated
- G01N21/55—Specular reflectivity
-
- G—PHYSICS
- G02—OPTICS
- G02B—OPTICAL ELEMENTS, SYSTEMS OR APPARATUS
- G02B27/00—Optical systems or apparatus not provided for by any of the groups G02B1/00 - G02B26/00, G02B30/00
-
- G—PHYSICS
- G01—MEASURING; TESTING
- G01N—INVESTIGATING OR ANALYSING MATERIALS BY DETERMINING THEIR CHEMICAL OR PHYSICAL PROPERTIES
- G01N21/00—Investigating or analysing materials by the use of optical means, i.e. using sub-millimetre waves, infrared, visible or ultraviolet light
- G01N21/17—Systems in which incident light is modified in accordance with the properties of the material investigated
- G01N21/25—Colour; Spectral properties, i.e. comparison of effect of material on the light at two or more different wavelengths or wavelength bands
- G01N21/31—Investigating relative effect of material at wavelengths characteristic of specific elements or molecules, e.g. atomic absorption spectrometry
- G01N21/35—Investigating relative effect of material at wavelengths characteristic of specific elements or molecules, e.g. atomic absorption spectrometry using infrared light
- G01N2021/3595—Investigating relative effect of material at wavelengths characteristic of specific elements or molecules, e.g. atomic absorption spectrometry using infrared light using FTIR
-
- G—PHYSICS
- G01—MEASURING; TESTING
- G01N—INVESTIGATING OR ANALYSING MATERIALS BY DETERMINING THEIR CHEMICAL OR PHYSICAL PROPERTIES
- G01N2201/00—Features of devices classified in G01N21/00
- G01N2201/06—Illumination; Optics
- G01N2201/065—Integrating spheres
Definitions
- the present disclosure relates to a diamond nitrogen concentration measuring method and a diamond nitrogen concentration measuring apparatus.
- Patent Document 1 Japanese Patent Application Laid-Open No. 57-48642 describes a method for evaluating the color of gems such as diamonds.
- Patent Document 2 Japanese Patent Laid-Open No. 58-7278
- Patent Document 3 Japanese Patent Laid-Open No. 58-92920
- the method for measuring the nitrogen concentration of diamond includes a first step, a second step, and a third step.
- first step diamond is placed inside the integrating sphere.
- second step visible light is incident on the interior of the integrating sphere, reflected by the inner surface of the integrating sphere, and visible light transmitted or reflected by the diamond arranged inside the integrating sphere is received.
- the nitrogen concentration of the diamond is calculated based on the received visible light data and the mass of the diamond.
- a diamond nitrogen concentration measuring apparatus includes an integrating sphere, a light emitting unit, a light receiving unit, and a calculating unit.
- the light emitting section makes visible light enter the integrating sphere.
- the light receiving part receives visible light reflected by the inner surface of the integrating sphere and transmitted or reflected by the diamond.
- the calculator calculates the nitrogen concentration of the diamond based on the data of the visible light received by the light receiver and the mass of the diamond.
- FIG. 1 is a schematic partial cross-sectional view showing the configuration of a diamond nitrogen concentration measuring apparatus according to the present embodiment.
- FIG. 2 is a flow chart schematically showing the method for measuring the nitrogen concentration of diamond according to this embodiment.
- FIG. 3 is a schematic partial cross-sectional view showing the process of arranging the diamond inside the integrating sphere.
- FIG. 4 is a schematic diagram showing the relationship between reflectance and wavelength.
- FIG. 5 is a diagram showing the relationship between the reflectance ratio of diamond and the nitrogen concentration of diamond when the mass of diamond is 3/4 carat.
- FIG. 6 is a diagram showing the relationship between the reflectance ratio of diamond and the nitrogen concentration of diamond when the mass of diamond is 1/2 carat.
- FIG. 1 is a schematic partial cross-sectional view showing the configuration of a diamond nitrogen concentration measuring apparatus according to the present embodiment.
- FIG. 2 is a flow chart schematically showing the method for measuring the nitrogen concentration of diamond according to this embodiment.
- FIG. 3 is a schematic partial cross-sectional view showing the process of
- FIG. 7 is a diagram showing the relationship between the reflectance ratio of diamond and the nitrogen concentration of diamond when the mass of diamond is 1 ⁇ 3 carat.
- FIG. 8 is a diagram showing the relationship between the reflectance ratio of diamond and the nitrogen concentration of diamond when the mass of diamond is 1 carat.
- FIG. 9 is a schematic partial cross-sectional view showing a configuration in the case of directly irradiating a diamond to be measured with visible light.
- FIG. 10 is a schematic partial cross-sectional view showing a configuration in which visible light is indirectly applied to a diamond to be measured.
- FIG. 11 is a schematic diagram showing a method of arranging diamonds to be measured.
- FIG. 12 is a diagram showing the relationship between the reflectance ratio in Table 1 and the nitrogen concentration of diamond.
- FIG. 13 is a diagram showing the relationship between the reflectance ratio in Table 2 and the nitrogen concentration of diamond.
- FIG. 14 is a diagram showing the relationship between the reflectance ratio in Table 3 and the nitrogen concentration of diamond.
- a method for measuring the nitrogen concentration of diamond there is a visual comparison method using a color tone sample.
- a color sample is created using the property that the color of diamond changes depending on the nitrogen concentration.
- a plurality of diamonds with different color tones are prepared, and the diamonds are processed into flat plates.
- the nitrogen concentration of the diamond is measured using the FT-IR (Fourier Transform-Infrared Spectrometer) method.
- FT-IR Fastier Transform-Infrared Spectrometer
- Another method for measuring the nitrogen concentration of diamonds is to directly measure the nitrogen concentration of diamonds using the FT-IR method.
- the problem that the measurement results of the nitrogen concentration vary depending on the inspector is resolved.
- the FT-IR measurement itself is non-destructive, in order to measure the nitrogen concentration of diamonds with high accuracy, diamonds of various shapes and sizes must be prepared in a standardized shape for measurement (previously It is necessary to process it into a flat plate with a set thickness. Therefore, if the standardized shape for the measurement does not match the final use shape of the object to be measured, this measuring method cannot be adopted. Therefore, when using the FT-IR method, it was necessary to process the diamond to change the shape of the diamond into a standardized shape for the measurement. In other words, the FT-IR method was essentially a destructive inspection.
- the present disclosure has been made in view of the above problems, and its purpose is to accurately measure the nitrogen concentration of diamond without changing the shape and size of the diamond, regardless of the shape and size of the diamond. It is an object of the present invention to provide a diamond nitrogen concentration measuring method and a diamond nitrogen concentration measuring apparatus capable of
- a diamond nitrogen concentration measuring method and a diamond nitrogen concentration capable of accurately measuring the nitrogen concentration of a diamond without changing the shape of the diamond regardless of the shape and size of the diamond. can provide a measuring device for
- the method for measuring the nitrogen concentration of diamond 10 includes a first step, a second step, and a third step.
- first step diamond is placed in the interior 31 of the integrating sphere 1 .
- second step visible light is incident on the interior 31 of the integrating sphere 1, reflected by the inner surface 9 of the integrating sphere 1, and visible light transmitted or reflected by the diamond 10 arranged in the interior 31 of the integrating sphere 1 is received. be done.
- the nitrogen concentration of diamond 10 is calculated based on the received visible light data and the mass of diamond 10 .
- the diamond 10 is arranged inside 31 of the integrating sphere 1 .
- the light emitting unit 2 allows visible light to enter the interior 31 . Visible light that has entered the interior 31 is reflected by the inner surface 9 of the integrating sphere 1 , illuminates the diamond 10 from various directions, passes through or is reflected by the diamond 10 , and is finally received by the light receiving section 3 .
- the calculator 11 calculates the nitrogen concentration of the diamond 10 based on the data of the visible light received by the light receiver 3 and the mass of the diamond 10 .
- the visible light is irradiated to the diamond 10 from almost all directions, so the visible light averaged over the diamond 10 as a whole (the diamond is irradiated from all directions by the integrating sphere, transmitted through the diamond, or reflected visible light) is received. Therefore, compared with the case of measuring the nitrogen concentration of diamond 10 using a visual comparison method, the nitrogen concentration of diamond 10 can be measured with high accuracy.
- the nitrogen concentration of diamond 10 can be measured without changing the shape of diamond 10 .
- the nitrogen concentration of diamond 10 can be measured regardless of the shape and size of diamond 10. .
- the reflectance of visible light in the first wavelength range is defined as the first reflectance
- the reflectance of visible light in the second wavelength range is defined as the second reflectance. If there are two reflectances and the reflectance ratio is a value obtained by dividing the second reflectance by the first reflectance, the visible light data may include the reflectance ratio.
- the lower limit of the first wavelength band may be smaller than 540 nm and smaller than the lower limit of the second wavelength band.
- the upper limit of the second wavelength band may be greater than 580 nm.
- the upper limit of the first wavelength band may be smaller than the upper limit of the second wavelength band.
- the carat number of the diamond is calculated based on the mass of the diamond, the coefficient A1 and the coefficient A2 in Equation 1 are determined based on the calculated carat number of the diamond, and the nitrogen concentration of the diamond based on Equation 1 may be calculated.
- the nitrogen concentration of the diamond is calculated. Therefore, the nitrogen concentration of diamond is more accurately calculated than when calculating the nitrogen concentration of diamond using only the reflectance of the first wavelength region, the reflectance of the second wavelength region, or the reflectance of the third wavelength region. can be measured.
- the first wavelength band does not have to overlap with the second wavelength band. Thereby, the nitrogen concentration of diamond can be measured with higher accuracy.
- the upper limit of the first wavelength range may be smaller than 540 nm.
- the lower limit of the second wavelength band may be greater than 580 nm.
- the visible light incident inside the integrating sphere is integrated at least once. After being reflected on the inner surface of the sphere, it may be transmitted or reflected by a diamond placed inside the integrating sphere.
- the device for measuring the nitrogen concentration of diamond 10 includes integrating sphere 1 , light emitting section 2 , light receiving section 3 , and calculating section 11 .
- the light emitting unit 2 allows visible light to enter the interior 31 of the integrating sphere 1 .
- the light receiving portion 3 receives visible light reflected by the inner surface 9 of the integrating sphere 1 and transmitted or reflected by the diamond 10 .
- the calculator 11 calculates the nitrogen concentration of the diamond 10 based on the data of the visible light received by the light receiver 3 and the mass of the diamond 10 .
- the apparatus for measuring the nitrogen concentration of diamond 10 has integrating sphere 1 , light emitting section 2 , light receiving section 3 and calculating section 11 .
- the calculation unit 11 calculates the data of the "averaged visible light (the visible light that is irradiated to the diamond 10 from all directions by the integrating sphere 1 and is transmitted or reflected by the diamond 10)" received by the light receiving unit 3 and the mass of the diamond 10. Calculation of the nitrogen concentration of the diamond 10 is performed based on. Therefore, compared with the case of measuring the nitrogen concentration of diamond 10 using a visual comparison method, the nitrogen concentration of diamond 10 can be measured with high accuracy.
- the apparatus for measuring the nitrogen concentration of diamond 10 according to the above (6) does not require processing diamond 10 to be measured into a flat plate like in the case of measuring the nitrogen concentration of diamond 10 using the FT-IR method. . Therefore, the nitrogen concentration of diamond 10 can be measured without changing the shape of diamond 10 .
- the nitrogen concentration of diamond 10 can be measured regardless of the shape and size of diamond 10. .
- integrating sphere 1 may be provided with sample insertion hole 4 .
- the light emitting part 2 may be arranged so that a straight line along the incident direction A of visible light does not pass through the sample insertion hole 4 and intersects the inner surface 9 . This prevents the visible light that enters the integrating sphere from directly entering the diamond before being scattered on the inner surface of the integrating sphere (most of the incident light enters the diamond from a specific direction). Ensure that the visible light received by the light-receiving part is "averaged visible light (visible light irradiated to the diamond 10 from all directions by the integrating sphere 1 and transmitted or reflected by the diamond 10)" can do. Therefore, regardless of the arrangement of the diamond 10, the nitrogen concentration of the diamond 10 can be measured with higher accuracy.
- FIG. 1 is a schematic partial cross-sectional view showing the configuration of the apparatus for measuring the nitrogen concentration of diamond 10 according to this embodiment.
- an apparatus 100 for measuring the nitrogen concentration of diamond 10 includes an integrating sphere 1, a light emitting section 2, a light receiving section 3, a spectroscope 7, an analysis PC (Personal Computer) 8, and a housing. It mainly has a body 6 and a sample stage 5 . Integrating sphere 1 is arranged in housing 6 . Integrating sphere 1 has an inner surface 9 .
- the inner surface 9 of the integrating sphere 1 is spherical. Although the diameter of integrating sphere 1 is not particularly limited, it is, for example, 40 mm or more and 80 mm or less.
- the inner surface 9 of the integrating sphere 1 is made of a material with high reflectance and excellent diffusivity. The material is, for example, Spectralon. The material may be, for example, barium sulfate or magnesium oxide (MgO).
- the integrating sphere 1 is provided with an entrance hole 32 , an exit hole 33 and a sample insertion hole 4 .
- the light emitting section 2 is attached to the incident hole 32 .
- the light emitting unit 2 allows visible light to enter the interior 31 of the integrating sphere 1 .
- the light emitting unit 2 can emit visible light.
- the light emitting section 2 is a light source.
- Light emitting unit 2 is, for example, a halogen lamp.
- the light receiving section 3 is attached to the emission hole 33 .
- the light receiving unit 3 is an optical sensor.
- the light receiving section 3 can detect visible light.
- the light receiving section 3 receives visible light reflected by the inner surface 9 of the integrating sphere 1 .
- the light receiving section 3 is, for example, a photodiode.
- the sample insertion hole 4 is provided vertically below the integrating sphere 1, for example. Although the diameter of the sample insertion hole 4 is not particularly limited, it is, for example, 1 mm or more and 10
- the sample table 5 supports the diamond 10 to be measured.
- the sample table 5 is cylindrical, for example.
- the sample stage 5 has a mounting surface 15 .
- the mounting surface 15 is planar.
- the mounting surface 15 may be coated with a material having high reflectance and excellent diffusivity.
- the diameter of the mounting surface 15 is not particularly limited, it is, for example, 20 mm or more and 30 mm or less.
- a diamond 10 to be measured is arranged on the mounting surface 15 .
- the diamond 10 mounted (or fixed) on the mounting surface 15 is arranged in the interior 31 of the integrating sphere 1, and the sample insertion hole 4 is closed by the mounting surface 15 ( (2) the mounting surface 15 is separated from the sample insertion hole 4, and the diamond 10 is mounted on the mounting surface 15; (or fixed) and a position (diamond exchange position) where the diamond 10 mounted (or fixed) on the mounting surface 15 can be removed from the mounting surface 15 .
- the spectroscope 7 is connected to the light receiving section 3.
- the spectroscope 7 can separate the light detected by the light receiving section 3 for each wavelength.
- the spectroscope 7 obtains the relationship between the intensity of the light detected by the light receiving section 3 and the wavelength.
- the analysis PC 8 mainly has a calculation section 11 , a storage section 12 and an input section 13 .
- the calculation unit 11 is typically an arithmetic processing unit such as a CPU (Central Processing Unit) or MPU (Micro Processing Unit).
- the calculator 11 calculates the nitrogen concentration of the diamond 10 based on the data sent from the spectroscope 7 . Specifically, the calculator 11 calculates the nitrogen concentration of the diamond 10 based on the data of the visible light received by the light receiver 3 and the mass of the diamond 10 .
- the storage unit 12 is a non-volatile memory such as RAM (Random Access Memory), ROM (Read Only Memory), or flash memory.
- the storage unit 12 stores data used for calculation by the calculation unit 11 .
- the storage unit 12 stores an equation for calculating the nitrogen concentration.
- the storage unit 12 stores the mass or volume of the diamond 10 to be measured.
- Input unit 13 is, for example, a keyboard. Data input by the input unit 13 is stored in the storage unit 12 . Using the input unit 13, coefficients of formulas for calculating the nitrogen concentration are input to the PC 8 for analysis.
- the light emitting section 2 may be arranged so that the diamond to be measured is not directly irradiated with visible light. Specifically, the light emitting section 2 may be arranged so that the straight line C along the incident direction A of the visible light does not pass through the sample insertion hole 4 . The light emitting section 2 is arranged such that a straight line C along the incident direction A of visible light intersects the inner surface 9 of the integrating sphere 1 . From another point of view, the straight line passing through the sample insertion hole 4 and the center 34 of the integrating sphere 1 is inclined with respect to the straight line C along the incident direction A of visible light. A straight line C along the incident direction A of visible light may or may not pass through the center 34 of the integrating sphere 1 .
- the light emitting unit 2 In order to allow visible light to enter the diamond 10 from all directions and stabilize the measurement result (avoid incident light from entering the diamond 10 with deviation from a specific direction), the light emitting unit 2 It is desirable that the light be arranged so that it does not directly irradiate the diamond 10 to be measured, but is reflected in the interior 31 of the integrating sphere 1 at least once before being incident on the diamond 10 .
- the position where the sample insertion hole 4 is provided is 0°
- the position where the spectroscope 7 is provided is 90°
- the vertically upward direction is 180°
- the spectroscope 7 is provided.
- the light emitting section 2 is provided at a position larger than 90° and smaller than 180°, for example.
- Light emitting unit 2 may be provided at a position larger than 180° and smaller than 270°, for example.
- a straight line passing through the center of integrating sphere 1 and sample insertion hole 4 is inclined with respect to a straight line passing through center 34 of integrating sphere 1 and entrance hole 32 .
- the light receiving section 3 is provided at a position rotated by 90° from the sample insertion hole 4 as viewed from the center of the integrating sphere 1, for example.
- FIG. 2 is a flow chart schematically showing a method for measuring the nitrogen concentration of diamond 10 according to this embodiment.
- the method for measuring the nitrogen concentration of diamond 10 according to the present embodiment comprises a step of placing diamond inside an integrating sphere (S10), and receiving visible light reflected on the inner surface of the integrating sphere. It mainly has a step (S20) and a step (S30) of calculating the nitrogen concentration of diamond.
- a step (S10) of arranging a diamond inside the integrating sphere is performed.
- the diamond 10 to be measured is mounted on the mounting surface 15 of the sample table 5 .
- Diamond 10 may be single crystal diamond 10 or polycrystalline diamond 10 .
- Diamond 10 is, for example, an artificially synthesized single crystal diamond 10 .
- the single-crystal diamond 10 is synthesized by using an ultrahigh-pressure, high-temperature press apparatus to press, for example, a capsule containing raw material carbon and a solvent metal under high temperature.
- the synthetic pressure is, for example, 5 GPa or higher.
- the synthesis temperature is, for example, 1300° C. or higher.
- the artificially synthesized single crystal diamond 10 has facets. From another point of view, the artificially synthesized single crystal diamond 10 has exposed facet surfaces.
- the shape of the facet surface is not particularly limited as long as it is an arbitrary polygon.
- the shape of the facet surface is, for example, triangular, quadrangular, hexagonal, octagonal or other polygons. It may be rectangular.
- the number of facet surfaces is not particularly limited as long as it is one or more.
- the number of facet surfaces may be 2 or more, 6 or more, or 12 or more.
- a facet plane is a plane perpendicular to a particular crystal orientation.
- the facet planes are, for example, ⁇ 100 ⁇ planes, ⁇ 110 ⁇ planes, and ⁇ 111 ⁇ planes. Natural diamonds usually do not have facets.
- the single crystal diamond 10 has, for example, a first facet 21, a second facet 22, a third facet 23 and a fourth facet 24.
- the second facet surface 22 is opposite the first facet surface 21 .
- the fourth facet surface 24 is opposite the third facet surface 23 .
- the first facet surface 21 is inclined with respect to the third facet surface 23 .
- the second facet surface 22 is inclined with respect to the fourth facet surface 24 .
- the diamond 10 is placed on the sample stage 5 such that the second facet surface 22 is in contact with the mounting surface 15, for example.
- the second facet surface 22 is substantially parallel to the mounting surface 15 of the sample stage 5 .
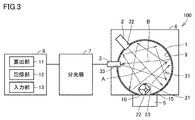
- FIG. 3 is a schematic partial cross-sectional view showing the process of arranging the diamond 10 in the interior 31 of the integrating sphere 1.
- FIG. 3 diamond 10 is placed inside 31 of integrating sphere 1 .
- Diamond 10 is inserted into interior 31 of integrating sphere 1 through sample insertion hole 4 .
- the sample insertion hole 4 is closed by the mounting surface 15 of the sample stage 5 .
- the mounting surface 15 is arranged along the inner surface 9 of the integrating sphere 1 .
- the step of receiving visible light reflected by the inner surface of the integrating sphere is performed. Specifically, the inside 31 of the integrating sphere 1 is irradiated with visible light from the light emitting unit 2 . The incident direction A of the visible light is adjusted so that the visible light is not directly incident on the diamond 10 to be measured. The visible light from the light-emitting portion 2 is irradiated onto the inner surface 9 of the integrating sphere 1, repeatedly reflected on the inner surface 9, and incident on the diamond 10 from various directions. The visible light is transmitted or reflected inside the diamond 10 , and further reflected repeatedly on the inner surface 9 , and finally received as reflected light B by the light receiving section 3 . The wavelength range of visible light is set to a range of 380 nm or more and 780 nm or less.
- FIG. 4 is a schematic diagram showing the relationship between reflectance and wavelength.
- the horizontal axis indicates the wavelength of visible light received by the light receiving section 3 .
- the vertical axis indicates the reflectance of visible light.
- the reflectance of visible light is the intensity of visible light received with the diamond 10 placed in the interior 31 of the integrating sphere 1, and the intensity of visible light received with the diamond 10 not placed in the interior 31 of the integrating sphere 1. is the value obtained by dividing
- the nitrogen concentration of diamond sample X is 69 ppm.
- the nitrogen concentration of diamond sample Y is 232 ppm.
- the nitrogen concentration of diamond sample Z is 303 ppm.
- the state in which the diamond 10 is not placed in the interior 31 of the integrating sphere 1 means that the sample insertion hole 4 is closed by the mounting surface 15 in a state in which the diamond 10 is not mounted (or fixed) on the mounting surface 15. state.
- the reflectance of the diamond sample hardly changes even when the nitrogen concentration of the diamond sample is changed. From another point of view, in the third wavelength region S3, the reflectance of the diamond sample has approximately the same value regardless of the nitrogen concentration of the diamond sample.
- the range of the third wavelength region S3 is, for example, 540 nm or more and 580 nm or less.
- the lower limit of the third wavelength range S3 is, for example, 540 nm.
- the upper limit of the third wavelength range S3 is, for example, 580 nm.
- the first wavelength range S1 is a wavelength range including wavelengths lower than the third wavelength range S3.
- the lower limit of the first wavelength range S1 is smaller than the lower limit (540 nm) of the third wavelength range S3.
- the second wavelength range S2 is a wavelength range including higher wavelengths than the third wavelength range S3.
- the upper limit value of the wavelength range of the second wavelength range S2 is greater than the upper limit value (580 nm) of the third wavelength range S3.
- the lower limit of the first wavelength range S1 is smaller than the lower limit of the second wavelength range S2.
- the upper limit of the first wavelength range S1 is smaller than the upper limit of the second wavelength range S2.
- the upper limit value of the first wavelength region S1 may be smaller than the lower limit value of the third wavelength region S3, or may be within the range of the third wavelength region S3. It doesn't matter if it's big.
- the lower limit of the second wavelength region S2 may be smaller than the lower limit of the third wavelength region S3, may be within the range of the third wavelength region S3, or may be larger than the upper limit of the third wavelength region S3. I do not care.
- the upper and lower limits of the first wavelength region S1 and the upper limit of the second wavelength region S2 are set so as to reduce the overlapping portion of the first wavelength region S1 and the second wavelength region S2. It is desirable to set a value and a lower limit. It is more desirable to set the upper limit and lower limit of the first wavelength range S1 and the upper limit and lower limit of the second wavelength range S2 so that the first wavelength range S1 and the second wavelength range S2 do not overlap. Most preferably, the upper limit of the first wavelength region S1 is set smaller than the lower limit of the third wavelength region S3, and the lower limit of the second wavelength region S2 is set larger than the upper limit of the third wavelength region S3. desirable. From another point of view, it is most preferable to set the first wavelength region S1 on the shorter wavelength side than the third wavelength region S3 and set the second wavelength region S2 on the longer wavelength side than the third wavelength region S3. desirable.
- the first wavelength region S1 is, for example, a range from 380 nm to 530 nm.
- the lower limit of the first wavelength region S1 is not particularly limited, it may be, for example, 400 nm or more, or 420 nm or more.
- the upper limit of the first wavelength region S1 is not particularly limited, it may be, for example, 510 nm or less, or 490 nm or less.
- the first wavelength region S1 may be 380 nm or more and 510 nm or less, or may be 380 nm or more and 490 nm or less.
- the first wavelength region S1 may be 400 nm or more and 530 nm or less, 400 nm or more and 510 nm or less, or 400 nm or more and 490 nm or less.
- the first wavelength region S1 may be 420 nm or more and 530 nm or less, 420 nm or more and 510 nm or less, or 420 nm or more and 490 nm or less.
- the second wavelength region S2 is, for example, a range of 580 nm or more and 780 nm or less.
- the lower limit of the second wavelength region S2 is not particularly limited, it may be, for example, 600 nm or more, or 620 nm or more.
- the upper limit of the second wavelength region S2 is not particularly limited, it may be, for example, 760 nm or less, or 740 nm or less.
- the second wavelength region S2 may be 580 nm or more and 760 nm or less, or may be 580 nm or more and 740 nm or less.
- the second wavelength region S2 may be 600 nm or more and 780 nm or less, 600 nm or more and 760 nm or less, or 600 nm or more and 740 nm or less.
- the second wavelength region S2 may be 620 nm or more and 780 nm or less, 620 nm or more and 760 nm or less, or 620 nm or more and 740 nm or less.
- the received visible light data includes, for example, reflectance ratios.
- the reflectance ratio means that the second reflectance is the first reflectance. It is a value divided by the reflectance.
- the reflectance ratio is, for example, a value obtained by dividing the integrated value of the reflectance of visible light in the second wavelength range S2 by the integrated value of the reflectance of visible light in the first wavelength range S1.
- the wavelength pitch used for calculating the integral value is, for example, 1 nm.
- the reflectance ratio may be, for example, a value obtained by dividing the average reflectance of visible light in the second wavelength range S2 by the average reflectance of visible light in the first wavelength range S1.
- FIG. 5 is a diagram showing the relationship between the reflectance ratio of the diamond 10 and the nitrogen concentration of the diamond 10 when the mass of the diamond 10 is 3/4 carat.
- FIG. 6 is a diagram showing the relationship between the reflectance ratio of the diamond 10 and the nitrogen concentration of the diamond 10 when the mass of the diamond 10 is 1/2 carat.
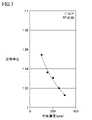
- FIG. 7 is a diagram showing the relationship between the reflectance ratio of diamond 10 and the nitrogen concentration of diamond 10 when the mass of diamond 10 is 1 ⁇ 3 carat.
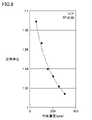
- FIG. 8 is a diagram showing the relationship between the reflectance ratio of diamond 10 and the nitrogen concentration of diamond 10 when the mass of diamond 10 is 1 carat.
- the coefficient of determination (R 2 ) is 0.98 when the mass of diamond 10 is 3/4 carat. As shown in FIG. 6, the coefficient of determination (R 2 ) is 0.91 when the diamond 10 has a mass of 1/2 carat. As shown in FIG. 7, the coefficient of determination (R 2 ) is 0.99 when the diamond 10 has a mass of 1 ⁇ 3 carat. As shown in FIG. 8, the coefficient of determination (R 2 ) is 0.99 when the diamond 10 has a mass of 1 carat.
- Formula 1 above shows a formula that indicates the nitrogen concentration based on the reflectance ratio.
- the sample of diamond 10 to be measured is sorted by mass.
- diamonds 10 to be measured include a first group of 0.35 carat or less, a second group of greater than 0.35 carat and less than or equal to 0.5 carat, and a second group of greater than 0.5 carat and less than or equal to 0.75 carat.
- factor A1 When measuring diamonds 10 belonging to the first group, factor A1 is 7.0 ⁇ 10 26 and factor A2 is ⁇ 55.9. When measuring diamonds 10 belonging to the second group, factor A1 is 5.0 ⁇ 10 20 and factor A2 is ⁇ 41.8. When measuring diamonds 10 belonging to the third group, factor A1 is 8.0 ⁇ 10 17 and factor A2 is ⁇ 35.43. When measuring diamonds 10 belonging to the fourth group, factor A1 is 3.0 ⁇ 10 17 and factor A2 is ⁇ 34.37. When measuring diamonds 10 belonging to the fifth group, factor A1 is 2.0 ⁇ 10 23 and factor A2 is ⁇ 47.28.
- the nitrogen concentration of diamond 10 is calculated based on the received visible light data and the mass of diamond 10 .
- the received visible light data includes the reflectance ratio of diamond 10 .
- the weight of the diamond 10 to be measured is measured in advance.
- the measuring device converts the weight of the diamond to carats and selects the coefficients A1 and A2 to be applied in Equation 1.
- the nitrogen concentration of diamond 10 is calculated.
- the mass of diamond 10 is measured, for example, with a micro electronic balance.
- the mass of diamond 10 is usually expressed in carats. One carat equals 0.2 grams.
- the mass of diamond 10 may be calculated, for example, based on the volume of diamond 10 determined by an X-ray CT (Computed Tomography) device.
- the mass of diamond 10 is calculated as the product of the volume of diamond 10 and the density of diamond 10 . In calculating the mass of diamond 10, a constant density may be assumed.
- the above formula 1 may be stored in advance in the storage unit 12 of the PC 8 for analysis.
- the mass data of the diamond 10 to be measured may be automatically transferred from the mass measuring device to the analysis PC 8 , or may be input to the analysis PC 8 by the operator through the input unit 13 .
- the calculation unit 11 calculates the nitrogen concentration of the diamond 10 to be measured using the formula stored in the storage unit 12 and the mass of the diamond 10 to be measured.
- the diamond 10 is arranged inside 31 of the integrating sphere 1 .
- the light emitting unit 2 allows visible light to enter the interior 31 . Visible light that has entered the interior 31 is reflected by the inner surface 9 of the integrating sphere 1 , illuminates the diamond 10 from various directions, passes through or is reflected by the diamond 10 , and is finally received by the light receiving section 3 .
- the calculator 11 calculates the nitrogen concentration of the diamond 10 based on the data of the visible light received by the light receiver 3 and the mass of the diamond 10 .
- the visible light is irradiated to the diamond 10 from almost all directions, so the visible light averaged over the diamond 10 as a whole (the diamond is irradiated from all directions by the integrating sphere, transmitted through the diamond, or reflected visible light) is received. Therefore, compared with the case of measuring the nitrogen concentration of diamond 10 using a visual comparison method, the nitrogen concentration of diamond 10 can be measured with high accuracy.
- the nitrogen concentration of diamond 10 can be measured without changing the shape of diamond 10 .
- the nitrogen concentration of diamond 10 can be measured regardless of the shape and size of diamond 10 by considering the mass of diamond 10 .
- the wavelength region (third wavelength region) in which the reflectance transitions from a state in which the reflectance increases to a state in which the reflectance decreases as the nitrogen concentration of the diamond increases.
- the nitrogen concentration of the diamond is calculated. Therefore, the nitrogen concentration of diamond is more accurately calculated than when calculating the nitrogen concentration of diamond using only the reflectance of the first wavelength region, the reflectance of the second wavelength region, or the reflectance of the third wavelength region. can be measured.
- the first wavelength band does not have to overlap with the second wavelength band. Therefore, the nitrogen concentration of diamond can be measured with higher accuracy.
- the upper limit of the first wavelength range may be smaller than 540 nm.
- the lower limit of the second wavelength band may be greater than 580 nm.
- the visible light incident on the inside of the integrating sphere is reflected at least once by the inner surface of the integrating sphere. It may be transmissive or reflective of internally placed diamonds.
- the apparatus for measuring the nitrogen concentration of diamond 10 has an integrating sphere 1 , a light emitting section 2 , a light receiving section 3 and a calculating section 11 .
- the calculation unit 11 calculates the data of the "averaged visible light (the visible light that is irradiated to the diamond 10 from all directions by the integrating sphere 1 and is transmitted or reflected by the diamond 10)" received by the light receiving unit 3 and the mass of the diamond 10. Calculation of the nitrogen concentration of the diamond 10 is performed based on. Therefore, compared with the case of measuring the nitrogen concentration of diamond 10 using a visual comparison method, the nitrogen concentration of diamond 10 can be measured with high accuracy.
- the apparatus for measuring the nitrogen concentration of the diamond 10 does not require processing the diamond 10 to be measured into a flat plate unlike the case of measuring the nitrogen concentration of the diamond 10 using the FT-IR method. Therefore, the nitrogen concentration of diamond 10 can be measured without changing the shape of diamond 10 .
- the nitrogen concentration of diamond 10 can be measured regardless of the shape and size of diamond 10 by considering the mass of diamond 10 .
- integrating sphere 1 may be provided with sample insertion hole 4 .
- the light emitting part 2 may be arranged so that a straight line along the incident direction A of visible light does not pass through the sample insertion hole 4 and intersects the inner surface 9 . This prevents the visible light that enters the integrating sphere from directly entering the diamond before being scattered on the inner surface of the integrating sphere (most of the incident light enters the diamond from a specific direction). Ensure that the visible light received by the light-receiving part is "averaged visible light (visible light irradiated to the diamond 10 from all directions by the integrating sphere 1 and transmitted or reflected by the diamond 10)" can do. Therefore, regardless of the arrangement of the diamond 10, the nitrogen concentration of the diamond 10 can be measured with higher accuracy.
- FIG. 9 is a schematic partial cross-sectional view showing a configuration in which the diamond 10 to be measured is directly irradiated with visible light.
- the light-emitting part 2 was arranged directly above the diamond 10 .
- the visible light incident from the light emitting part 2 was directly irradiated to the diamond 10 .
- FIG. 10 is a schematic partial cross-sectional view showing the configuration when the diamond 10 to be measured is indirectly irradiated with visible light.
- the light-emitting portion 2 was arranged at a position spaced apart from directly above the diamond 10 by about 30° in the circumferential direction.
- the visible light incident from the light-emitting portion 2 was not directly applied to the diamond 10 .
- the nitrogen concentration of the diamond 10 was calculated by measuring the reflectance ratio by the method of the example, processing it into a flat plate for standardization, and measuring it by a known FT-IR method.
- a known FT-IR method the method described in G. S. WOODS et al. and two others, "The nitrogen content of type Ib synthetic diamond", Philosophical Magazine B, 1990, Vol. be done.
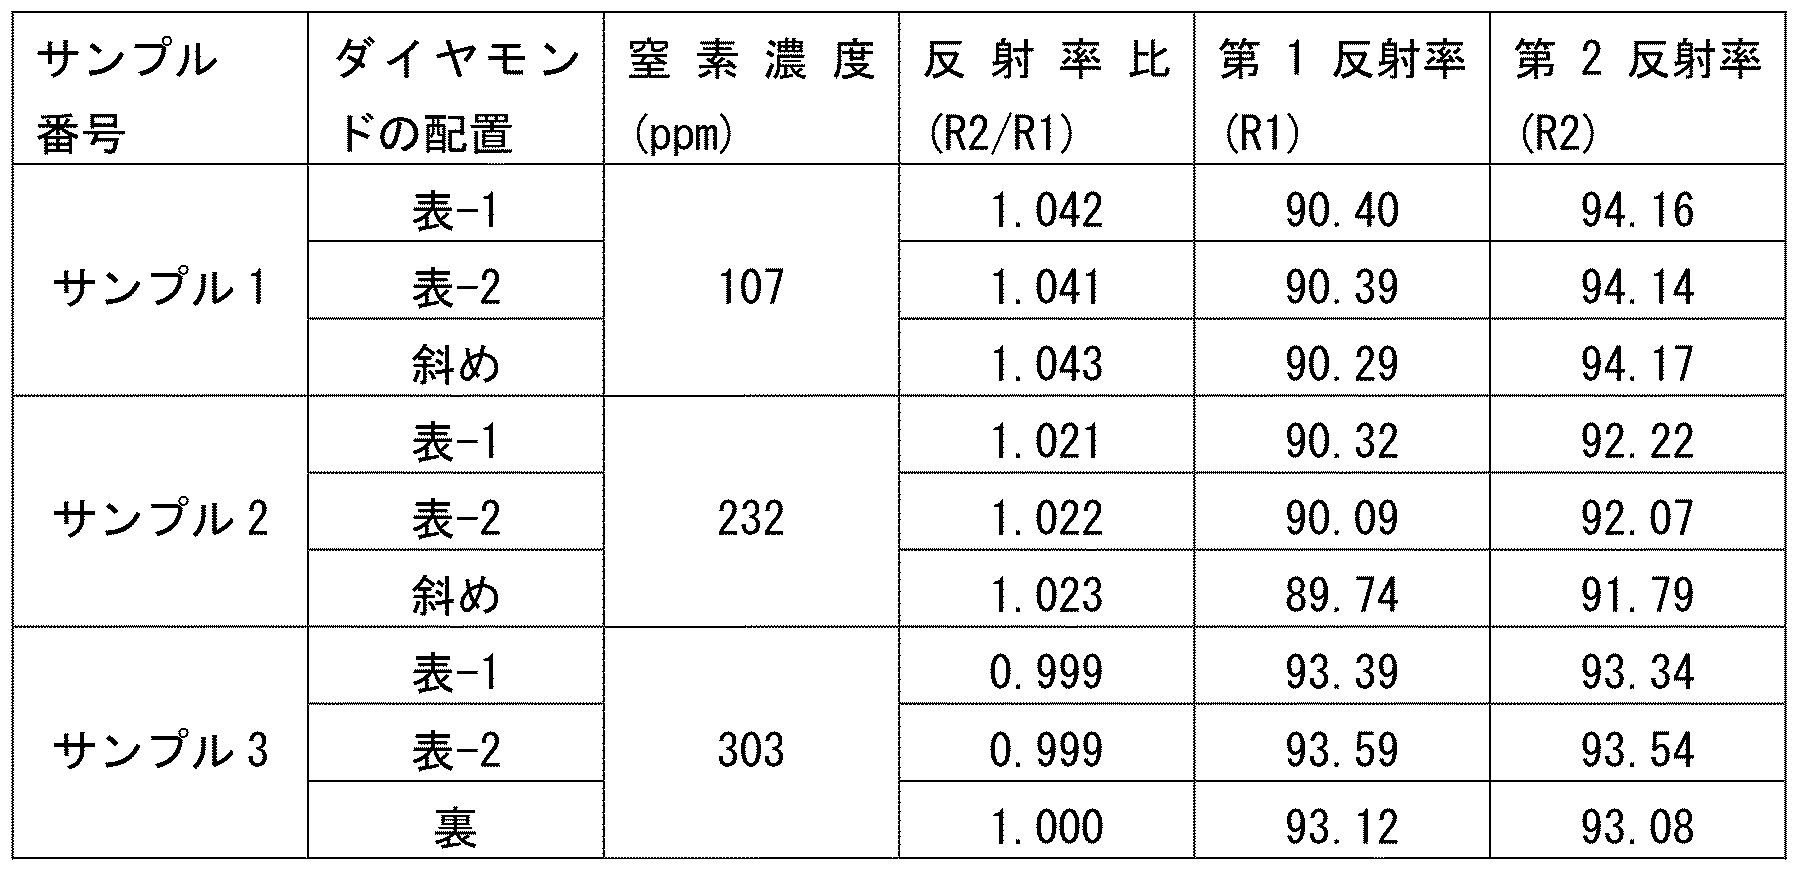
- the nitrogen concentration of diamond 10 of sample 1 calculated by the FT-IR method is 107 ppm.
- the nitrogen concentration of diamond 10 of sample 2 is 232 ppm.
- the nitrogen concentration of diamond 10 of sample 3 is 303 ppm. (Measuring method) FIG.
- FIG. 11 is a schematic diagram showing a method of arranging the diamond 10 to be measured.
- the arrangement method of the diamond 10 was changed.
- the diamond 10 was arranged on the mounting surface 15 so that the second facet surface 22 was in contact with the mounting surface 15 .
- the second facet surface 22 is a square surface.
- the method of arranging the diamonds 10 in Table-2 is obtained by rotating the diamonds 10 in the method of arranging in Table-1 about a straight line perpendicular to the mounting surface 15 by about 90°.
- the diamond 10 was arranged on the mounting surface 15 so that the fourth facet surface 24 adjacent to the second facet surface 22 was in contact with the mounting surface 15 .
- the fourth facet surface 24 is a hexagonal surface.
- the diamond 10 was placed on the mounting surface 15 so that the first facet surface 21 was in contact with the mounting surface 15 .
- the first facet surface 21 is opposite the second facet surface 22 .
- the first facet surface 21 is a square surface.
- Integrating sphere 1 was ISP-REF manufactured by Ocean Photonics.
- the spectroscope 7 was Flame-S manufactured by Ocean Photonics.
- the integration time was 11000 ⁇ s. The average number of times was 30 times.
- the number of pixels was 2048, and the measurement mode was reflectance.
- the storage start wavelength was 380 nm.
- the storage end wavelength was 780 nm.
- the storage pitch wavelength was set to 1 nm.
- the viewing angle was set to 2°.
- a halogen lamp (D65) was used as the light emitting unit 2 .
- the mode is object color. (Measurement result)
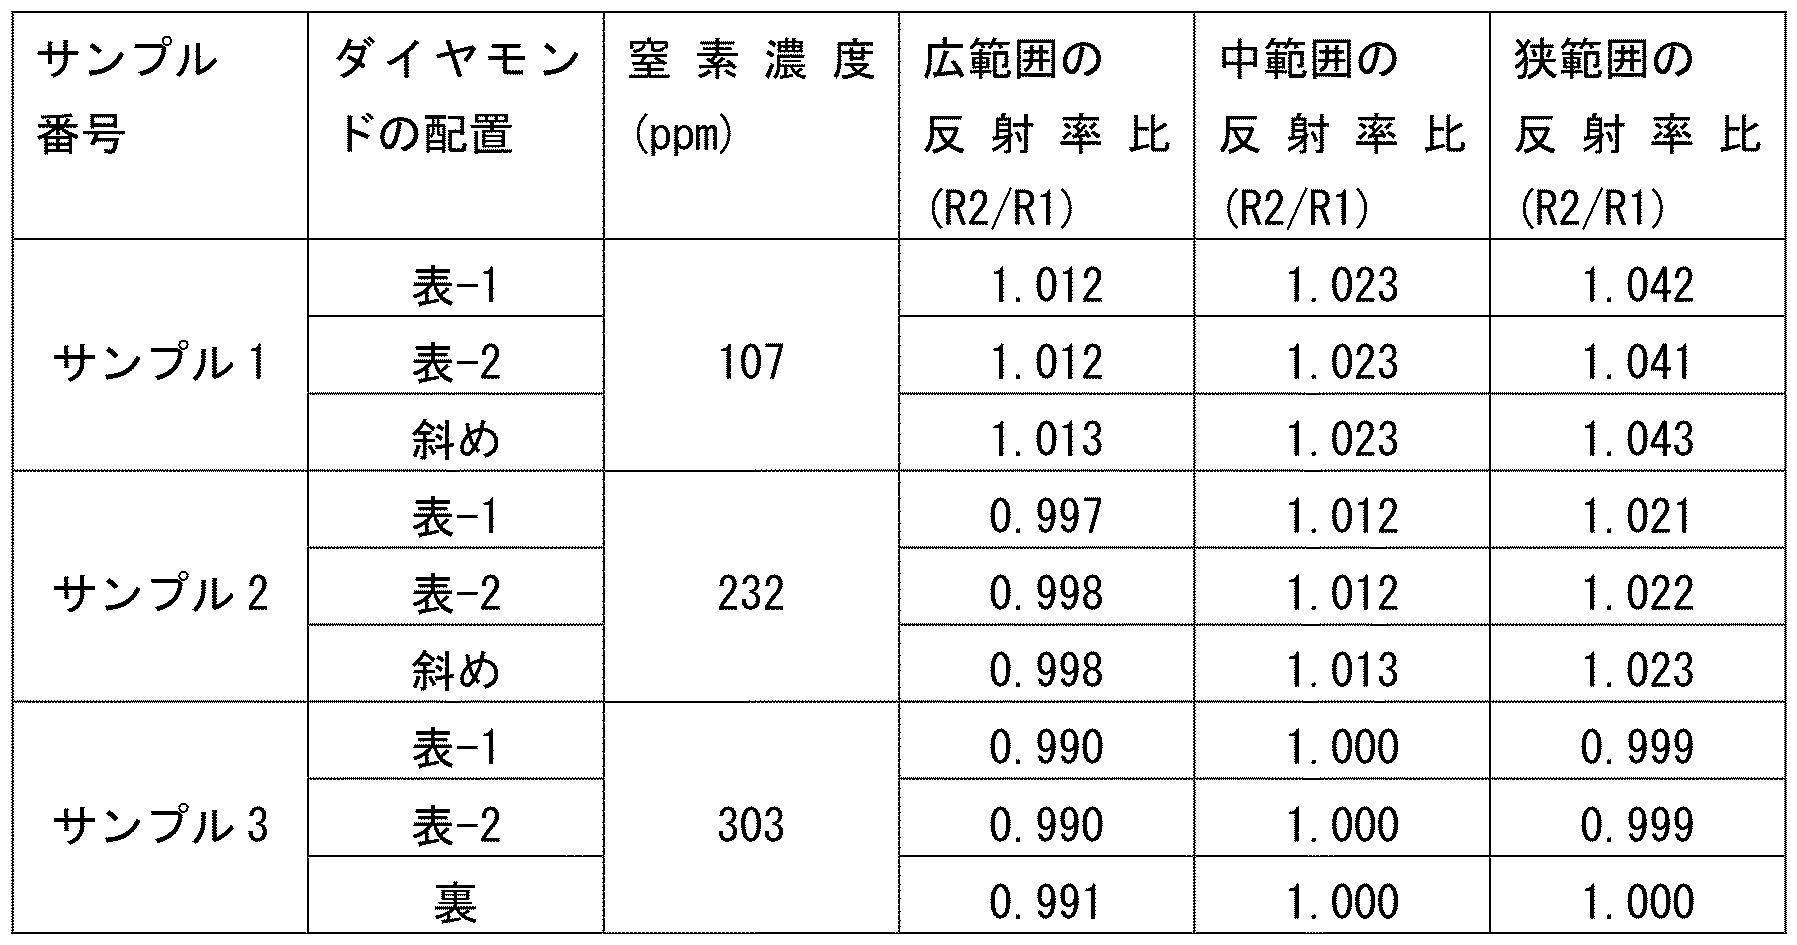
- Table 1 shows the average reflectance (first reflectance R1) in the first wavelength region S1 and the reflectance in the second wavelength region S2 when the diamond 10 to be measured is directly irradiated with visible light. and the reflectance ratio (the value obtained by dividing the second reflectance R2 by the first reflectance R1).
- the first wavelength region S1 was 461 nm to 530 nm.
- the second wavelength region S2 was 580 nm to 630 nm.
- FIG. 12 is a diagram showing the relationship between the reflectance ratio in Table 1 and the nitrogen concentration of the diamond 10. As shown in FIG. As shown in Table 1, the diamonds 10 of each of Sample 1 and Sample 2 were arranged in Table-1, Table-2, and diagonally. In diamond 10 of sample 3, the arrangement was front-1, front-2 and back.
- Table 2 shows the average reflectance (first reflectance R1) of the first wavelength region S1 and the reflectance of the second wavelength region S2 when the diamond 10 to be measured is indirectly irradiated with visible light. and the reflectance ratio (the value obtained by dividing the second reflectance R2 by the first reflectance R1).
- the first wavelength region S1 was 461 nm to 530 nm.
- the second wavelength region S2 was 580 nm to 630 nm.
- FIG. 13 is a diagram showing the relationship between the reflectance ratio in Table 2 and the nitrogen concentration of the diamond 10. As shown in FIG. As shown in Table 2, the diamonds 10 of each of Sample 1 and Sample 2 were arranged in Table-1, Table-2 and diagonally. In diamond 10 of sample 3, the arrangement was front-1, front-2 and back.
- Table 3 shows the reflectance ratio (the value obtained by dividing the second reflectance R2 by the first reflectance R1) when the respective ranges of the first wavelength region S1 and the second wavelength region S2 are changed.
- the first wavelength region S1 is set to the range of 380 nm or more and 580 nm or less
- the second wavelength region S2 is set to the range of 480 nm or more and 730 nm or less.
- the first wavelength range S1 is set to the range of 461 nm to 580 nm
- the second wavelength range S2 is set to the range of 530 nm to 630 nm.
- the first wavelength range S1 is set to the range of 461 nm to 530 nm
- the second wavelength range S2 is set to the range of 580 nm to 630 nm.
- FIG. 14 is a diagram showing the relationship between the reflectance ratio in Table 3 and the nitrogen concentration of the diamond 10.
- Table 3 the diamonds 10 of each of Sample 1 and Sample 2 were arranged in Table-1, Table-2, and diagonally. In diamond 10 of sample 3, the arrangement was front-1, front-2 and back. The diamond 10 to be measured was indirectly irradiated with visible light.
- the absolute value of the slope of the reflectance ratio in the narrow range was 0.0002.
- the absolute value of each slope of the mid-range reflectance ratio and the wide-range reflectance ratio was 0.0001.
- the absolute value of the slope of the reflectance ratio in the narrow range is the absolute value of the slope of the reflectance ratio in the middle range and the reflectance ratio in the wide range.
- Example preparation diamonds 10 according to samples 4, 5 and 6 were prepared.
- the diamonds 10 of each of samples 4, 5 and 6 have different nitrogen concentrations.
- the nitrogen concentrations of diamonds 10 for Samples 4, 5 and 6 were measured using the following first, second and third methods.
- the first method was a visual inspection method using a color sample.
- the nitrogen concentration of the diamond 10 estimated by visual inspection was the average of the nitrogen concentrations determined by multiple inspectors.
- the second method was the integrating sphere method according to the present disclosure. In the second method, the nitrogen concentration was measured using the narrow range reflectance ratios described in Table 3.
- the first wavelength region S1 is set to a range of 461 nm or more and 530 nm or less
- the second wavelength region S2 is set to a range of 580 nm or more and 630 nm or less.
- the nitrogen concentration of diamond 10 was measured using FT-IR. After measuring the nitrogen concentration of the diamond 10 using the second method, the diamond 10 was processed into a flat plate and measured by FT-IR. (Measurement result)
- Table 4 shows the nitrogen concentration of diamond 10 determined using each of the visual inspection method, integrating sphere method and FT-IR method.
- Table 4 shows the difference between the nitrogen concentration measured by the integrating sphere method and the nitrogen concentration measured by the FT-IR method in diamond 10 according to each of samples 4, 5, and 6 was visually It was smaller than the difference between the nitrogen concentration estimated by the inspection method and the nitrogen concentration measured by the FT-IR method. That is, compared to the nitrogen concentration estimated by the visual inspection method, the nitrogen concentration measured by the integrating sphere method according to the present disclosure is closer to the nitrogen concentration measured by the FT-IR method, which is a destructive test. became. It was shown that the integrating sphere method according to the present disclosure can calculate the nitrogen concentration of the diamond 10 with high precision and non-destructively without going through a destructive inspection represented by the FT-IR method.
Landscapes
- Physics & Mathematics (AREA)
- General Physics & Mathematics (AREA)
- Biochemistry (AREA)
- General Health & Medical Sciences (AREA)
- Health & Medical Sciences (AREA)
- Life Sciences & Earth Sciences (AREA)
- Chemical & Material Sciences (AREA)
- Analytical Chemistry (AREA)
- Pathology (AREA)
- Immunology (AREA)
- Spectroscopy & Molecular Physics (AREA)
- Engineering & Computer Science (AREA)
- Mathematical Physics (AREA)
- Theoretical Computer Science (AREA)
- Optics & Photonics (AREA)
- Investigating Or Analysing Materials By Optical Means (AREA)
- Spectrometry And Color Measurement (AREA)
- Investigating Materials By The Use Of Optical Means Adapted For Particular Applications (AREA)
Abstract
Description
ダイヤモンドの窒素濃度を測定方法として、色調見本を用いた目視比較法がある。ダイヤモンドの色調が窒素濃度に応じて変化する特性を利用して色調見本が作成される。まず色調の異なる複数のダイヤモンドが準備され、当該ダイヤモンドが平板状に加工される。次に、当該ダイヤモンドの窒素濃度がFT-IR(Fourier Transform-Infrared Spectrometer)法を用いて測定される。これにより、ダイヤモンドの窒素濃度と色調との対応関係がとれた色調見本が作成される。検査員は、測定対象のダイヤモンドの色調を観察した後、当該ダイヤモンドの色調を色調見本と比較することで、当該ダイヤモンドの窒素濃度を推定する。
本開示によれば、ダイヤモンドの形状および大きさに関わらず、ダイヤモンドの形状を変更することなく、かつ精度良くダイヤモンドの窒素濃度を測定することができるダイヤモンドの窒素濃度の測定方法およびダイヤモンドの窒素濃度の測定装置を提供することができる。
まず、本開示の実施形態を、列挙して説明する。

次に、本開示の実施形態の詳細を、図面を参照しながら説明する。以下の図面においては、同一又は相当する部分に同一の参照符号を付し、重複する説明は繰り返さない。本明細書の結晶学的記載においては、個別方位を[]、集合方位を<>、個別面を()、集合面を{}でそれぞれ示す。結晶学上の指数が負であることは、通常、数字の上に”-”(バー)を付すことによって表現されるが、本明細書では数字の前に負の符号を付すことによって結晶学上の負の指数を表現する。
図2は、本実施形態に係るダイヤモンド10の窒素濃度の測定方法を概略的に示すフローチャートである。図2に示されるように、本実施形態に係るダイヤモンド10の窒素濃度の測定方法は、積分球の内部にダイヤモンドを配置する工程(S10)と、積分球の内面で反射した可視光を受光する工程(S20)と、ダイヤモンドの窒素濃度を算出する工程(S30)とを主に有している。
実施例1において、入射光の入射方向Aと反射率比との関係を調査した。図9は、測定対象のダイヤモンド10に対して直接的に可視光を照射する場合の構成を示す一部断面模式図である。図9に示されるように、発光部2は、ダイヤモンド10の直上に配置された。発光部2から入射される可視光は、ダイヤモンド10に直接照射された。図10は、測定対象のダイヤモンド10に対して間接的に可視光を照射する場合の構成を示す一部断面模式図である。図10に示されるように、発光部2は、ダイヤモンド10の直上から30°程度周方向に離れた位置に配置された。発光部2から入射される可視光は、ダイヤモンド10に直接照射されなかった。ダイヤモンド10の窒素濃度は、当該実施例の方法で反射率比を測定した後、規格化のために平板状に加工し、公知のFT-IR法で測定、算出された。公知のFT-IR法として、G. S. WOODSら外2名、"The nitrogen content of type Ib synthetic diamond", Philosophical Magazine B, 1990, Vol.62, No.6, 589-595、に記載の方法が用いられる。FT-IR法で算出されたサンプル1のダイヤモンド10の窒素濃度は、107ppmである。サンプル2のダイヤモンド10の窒素濃度は、232ppmである。サンプル3のダイヤモンド10の窒素濃度は、303ppmである。
(測定方法)
図11は、測定対象であるダイヤモンド10の配置方法を示す模式図である。試料台5の載置面15にダイヤモンド10を載置する際、ダイヤモンド10の配置方法を変化させた。図11に示されるように、表-1および表-2の各々の配置方法においては、第2ファセット面22が載置面15と接するようにダイヤモンド10が載置面15上に配置された。第2ファセット面22は、4角形の面である。表-2のダイヤモンド10の配置方法は、表-1の配置方法におけるダイヤモンド10を載置面15に対して垂直な直線の周りに90°程度回転したものである。
(測定結果)

実施例2において、サンプル4、サンプル5およびサンプル6に係るダイヤモンド10を準備した。サンプル4、サンプル5およびサンプル6の各々に係るダイヤモンド10においては、窒素濃度が異なっている。
(測定方法)
サンプル4、サンプル5およびサンプル6に係るダイヤモンド10の窒素濃度は、以下の第1方法、第2方法および第3方法を用いて測定された。第1方法は、色見本を用いた目視検査法とした。目視検査法によって見積もられたダイヤモンド10の窒素濃度は、複数の検査員が判定した窒素濃度の平均値とした。第2方法は、本開示に係る積分球法とした。第2方法においては、表3において説明した狭範囲の反射率比を用いて窒素濃度が測定された。具体的には、第1波長域S1を461nm以上530nm以下の範囲とし、第2波長域S2を580nm以上630nm以下とした。第3方法においては、FT-IRを用いてダイヤモンド10の窒素濃度が測定された。第2方法を用いてダイヤモンド10の窒素濃度が測定された後、当該ダイヤモンド10が平板状に加工され、FT-IRによる測定が実施された。
(測定結果)

Claims (7)
- 積分球の内部にダイヤモンドを配置する第1工程と、
前記積分球の内部に可視光を入射し、前記積分球の内面で反射するとともに前記積分球の内部に配置された前記ダイヤモンドを透過又は反射した前記可視光を受光する第2工程と、
受光した前記可視光のデータおよび前記ダイヤモンドの質量に基づいて、前記ダイヤモンドの窒素濃度を算出する第3工程と、を備えた、ダイヤモンドの窒素濃度の測定方法。 - 第1波長域における前記可視光の反射率を第1反射率とし、第2波長域における前記可視光の反射率を第2反射率とし、前記第2反射率を前記第1反射率で除した値を反射率比とすると、
前記可視光のデータは、前記反射率比を含み、
前記第1波長域の下限値は、540nmよりも小さく、かつ前記第2波長域の下限値よりも小さく、
前記第2波長域の上限値は、580nmよりも大きく、
前記第1波長域の上限値は、前記第2波長域の上限値よりも小さく、
前記第3工程において、前記ダイヤモンドの質量に基づいて前記ダイヤモンドのカラット数を算出し、算出された前記ダイヤモンドのカラット数に基づいて数式1における係数A1および係数A2を決定し、前記数式1に基づいて前記ダイヤモンドの窒素濃度が算出される、請求項1に記載のダイヤモンドの窒素濃度の測定方法。

- 前記第1波長域は、前記第2波長域と重複しない、請求項2に記載のダイヤモンドの窒素濃度の測定方法。
- 前記第1波長域の上限値は、540nmよりも小さく、
前記第2波長域の下限値は、580nmよりも大きい、請求項3に記載のダイヤモンドの窒素濃度の測定方法。 - 前記第2工程において、前記積分球の内部に入射された前記可視光は、少なくとも1回は前記積分球の内面で反射した後で前記積分球の内部に配置された前記ダイヤモンドを透過又は反射する、請求項1から請求項4のいずれか1項に記載のダイヤモンドの窒素濃度の測定方法。
- 積分球と、
前記積分球の内部に可視光を入射する発光部と、
前記積分球の内面で反射し、ダイヤモンドを透過又は反射した前記可視光を受光する受光部と、
前記受光部で受光した前記可視光のデータおよび前記ダイヤモンドの質量に基づいて、前記ダイヤモンドの窒素濃度の算出を行う算出部とを備えた、ダイヤモンドの窒素濃度の測定装置。 - 前記積分球には、試料挿入孔が設けられており、
前記発光部は、前記可視光の入射方向に沿った直線が前記試料挿入孔を通らずかつ前記内面に交差するように配置されている、請求項6に記載のダイヤモンドの窒素濃度の測定装置。
Priority Applications (5)
| Application Number | Priority Date | Filing Date | Title |
|---|---|---|---|
| JP2022503547A JP7251042B2 (ja) | 2021-04-28 | 2021-04-28 | ダイヤモンドの窒素濃度の測定方法およびダイヤモンドの窒素濃度の測定装置 |
| PCT/JP2021/016972 WO2022230107A1 (ja) | 2021-04-28 | 2021-04-28 | ダイヤモンドの窒素濃度の測定方法およびダイヤモンドの窒素濃度の測定装置 |
| EP21939268.5A EP4332525A4 (en) | 2021-04-28 | 2021-04-28 | METHOD FOR MEASURING THE NITROGEN CONCENTRATION IN A DIAMOND, AND DEVICE FOR MEASURING THE NITROGEN CONCENTRATION IN A DIAMOND |
| US17/628,773 US12055497B2 (en) | 2021-04-28 | 2021-04-28 | Method of measuring concentration of nitrogen in diamond and apparatus that measures concentration of nitrogen in diamond |
| CN202180097036.4A CN117120831A (zh) | 2021-04-28 | 2021-04-28 | 金刚石的氮浓度的测定方法及金刚石的氮浓度的测定装置 |
Applications Claiming Priority (1)
| Application Number | Priority Date | Filing Date | Title |
|---|---|---|---|
| PCT/JP2021/016972 WO2022230107A1 (ja) | 2021-04-28 | 2021-04-28 | ダイヤモンドの窒素濃度の測定方法およびダイヤモンドの窒素濃度の測定装置 |
Publications (1)
| Publication Number | Publication Date |
|---|---|
| WO2022230107A1 true WO2022230107A1 (ja) | 2022-11-03 |
Family
ID=83848090
Family Applications (1)
| Application Number | Title | Priority Date | Filing Date |
|---|---|---|---|
| PCT/JP2021/016972 Ceased WO2022230107A1 (ja) | 2021-04-28 | 2021-04-28 | ダイヤモンドの窒素濃度の測定方法およびダイヤモンドの窒素濃度の測定装置 |
Country Status (5)
| Country | Link |
|---|---|
| US (1) | US12055497B2 (ja) |
| EP (1) | EP4332525A4 (ja) |
| JP (1) | JP7251042B2 (ja) |
| CN (1) | CN117120831A (ja) |
| WO (1) | WO2022230107A1 (ja) |
Cited By (1)
| Publication number | Priority date | Publication date | Assignee | Title |
|---|---|---|---|---|
| GB2629348A (en) * | 2023-04-24 | 2024-10-30 | Diamond Centre Wales Ltd | Apparatus and method for the assessment of gemstones |
Families Citing this family (1)
| Publication number | Priority date | Publication date | Assignee | Title |
|---|---|---|---|---|
| DE102019123886A1 (de) * | 2019-09-05 | 2021-03-11 | OSRAM Opto Semiconductors Gesellschaft mit beschränkter Haftung | Optoelektronisches bauelement und verfahren zur herstellung eines optoelektronischen bauelements |
Citations (6)
| Publication number | Priority date | Publication date | Assignee | Title |
|---|---|---|---|---|
| JPS5748642A (en) | 1980-06-04 | 1982-03-20 | De Beers Cons Mines Ltd | Method of evaluating color of diamond or other precious stones |
| JPS58728A (ja) | 1981-06-25 | 1983-01-05 | Shimadzu Corp | ダイヤモンドカラ−測定装置 |
| JPS5892920A (ja) | 1981-11-30 | 1983-06-02 | Karuniyuu Kogaku Kogyo Kk | ダイヤモンドカラ−測定装置 |
| JPH05507791A (ja) * | 1990-04-24 | 1993-11-04 | ゲルザン エスタブリッシュメント | 物体検査装置及び方法 |
| CN103090973A (zh) * | 2013-01-07 | 2013-05-08 | 广州标旗电子科技有限公司 | 基于光谱的Ia型钻石颜色快速分级方法 |
| US20190213757A1 (en) * | 2017-12-29 | 2019-07-11 | Goldway Technology Limited | Colour grading process and system for diamonds |
Family Cites Families (10)
| Publication number | Priority date | Publication date | Assignee | Title |
|---|---|---|---|---|
| US4291975A (en) * | 1979-10-03 | 1981-09-29 | Scientific Gem Identification, Inc. | Apparatus for determining the color characteristics of a gem |
| GB2199657B (en) * | 1986-11-12 | 1990-12-12 | De Beers Ind Diamond | Diamond sorting |
| GB9210674D0 (en) * | 1992-05-19 | 1992-07-01 | Gersan Ets | Method and apparatus for examining an object |
| GB0227261D0 (en) * | 2002-11-21 | 2002-12-31 | Element Six Ltd | Optical quality diamond material |
| BE1016537A3 (nl) * | 2004-11-10 | 2007-01-09 | Wetenschappelijk En Tech Onder | Werkwijze voor het onderscheiden van kleurloze en bijna kleurloze diamanten en opstelling voor het uitvoeren van deze werkwijze. |
| JP5874932B2 (ja) * | 2009-06-26 | 2016-03-02 | エレメント シックス リミテッド | ダイヤモンド材料の処理方法及び得られた製品 |
| GB201000768D0 (en) * | 2010-01-18 | 2010-03-03 | Element Six Ltd | CVD single crystal diamond material |
| KR102626684B1 (ko) * | 2015-07-22 | 2024-01-17 | 스미토모덴키고교가부시키가이샤 | 단결정 다이아몬드재, 단결정 다이아몬드칩 및 천공 공구 |
| IL277348B1 (en) * | 2018-03-23 | 2026-02-01 | Ariel Scient Innovations Ltd | Method and apparatus for analyzing and classifying diamonds using radio frequency spectroscopy |
| CA3132073C (en) * | 2019-03-01 | 2023-10-31 | Goldway Technology Limited | System for ascertaining optical characteristics of gemstone |
-
2021
- 2021-04-28 EP EP21939268.5A patent/EP4332525A4/en active Pending
- 2021-04-28 WO PCT/JP2021/016972 patent/WO2022230107A1/ja not_active Ceased
- 2021-04-28 CN CN202180097036.4A patent/CN117120831A/zh active Pending
- 2021-04-28 JP JP2022503547A patent/JP7251042B2/ja active Active
- 2021-04-28 US US17/628,773 patent/US12055497B2/en active Active
Patent Citations (6)
| Publication number | Priority date | Publication date | Assignee | Title |
|---|---|---|---|---|
| JPS5748642A (en) | 1980-06-04 | 1982-03-20 | De Beers Cons Mines Ltd | Method of evaluating color of diamond or other precious stones |
| JPS58728A (ja) | 1981-06-25 | 1983-01-05 | Shimadzu Corp | ダイヤモンドカラ−測定装置 |
| JPS5892920A (ja) | 1981-11-30 | 1983-06-02 | Karuniyuu Kogaku Kogyo Kk | ダイヤモンドカラ−測定装置 |
| JPH05507791A (ja) * | 1990-04-24 | 1993-11-04 | ゲルザン エスタブリッシュメント | 物体検査装置及び方法 |
| CN103090973A (zh) * | 2013-01-07 | 2013-05-08 | 广州标旗电子科技有限公司 | 基于光谱的Ia型钻石颜色快速分级方法 |
| US20190213757A1 (en) * | 2017-12-29 | 2019-07-11 | Goldway Technology Limited | Colour grading process and system for diamonds |
Non-Patent Citations (3)
| Title |
|---|
| G. S. WOODS ET AL.: "The nitrogen content of type Ib synthetic diamond", PHILOSOPHICAL MAGAZINE B, vol. 62, no. 6, 1990, pages 589 - 595 |
| See also references of EP4332525A4 |
| ZAITSEV, A. M. ET AL.: "Nitrogen-doped CVD diamond: Nitrogen concentration, color and internal stress", DIAMOND & RELATED MATERIALS, vol. 105, 3 March 2020 (2020-03-03), pages 1 - 13, XP086184458, DOI: https://doi.org/10.1016/j.diamond.2020.107794 * |
Cited By (1)
| Publication number | Priority date | Publication date | Assignee | Title |
|---|---|---|---|---|
| GB2629348A (en) * | 2023-04-24 | 2024-10-30 | Diamond Centre Wales Ltd | Apparatus and method for the assessment of gemstones |
Also Published As
| Publication number | Publication date |
|---|---|
| EP4332525A1 (en) | 2024-03-06 |
| CN117120831A (zh) | 2023-11-24 |
| EP4332525A4 (en) | 2024-06-19 |
| US12055497B2 (en) | 2024-08-06 |
| JPWO2022230107A1 (ja) | 2022-11-03 |
| JP7251042B2 (ja) | 2023-04-04 |
| US20230358685A1 (en) | 2023-11-09 |
Similar Documents
| Publication | Publication Date | Title |
|---|---|---|
| CN108027328B (zh) | 宝石的颜色测量 | |
| US5258825A (en) | Optical compositional analyzer apparatus and method for detection of ash in wheat and milled wheat products | |
| CN100430713C (zh) | 钻石颜色测量和分析系统、设备与方法 | |
| JP6053506B2 (ja) | 反射特性の測定装置 | |
| JP7251042B2 (ja) | ダイヤモンドの窒素濃度の測定方法およびダイヤモンドの窒素濃度の測定装置 | |
| JP4850701B2 (ja) | 光源波長修正 | |
| US20070296954A1 (en) | Fluorescence measuring device for gemstones | |
| JPH06186159A (ja) | 近赤外透過スペクトルによる果実糖度の非破壊測定法 | |
| CN102235972B (zh) | 一种光谱测色方法 | |
| US7193694B2 (en) | Method for grading gemstone cut and symmetry | |
| CN106679811B (zh) | 一种钻石颜色分级自动测量方法 | |
| Ferrero et al. | An insight into the present capabilities of national metrology institutes for measuring sparkle | |
| EP0041348B1 (en) | A method of assessing the colour in diamonds and other gems | |
| BR112018017343B1 (pt) | Método e aparelho para detectar a presença de micotoxinas em cereais, e, meio legível por computador. | |
| RU2657333C1 (ru) | Интегрально-сцинтилляционный способ исследования вещества с введением его в плазму | |
| Germer et al. | Angle-resolved diffuse reflectance and transmittance | |
| US20100302537A1 (en) | Spectroscopy device and method for its implementation | |
| Moraes et al. | Predicting oleogels properties using non-invasive spectroscopic techniques and machine learning | |
| JP7687667B2 (ja) | 発光測定装置および発光測定方法 | |
| CN1833164A (zh) | 用于预测宝石颜色的方法和系统 | |
| JP7314456B2 (ja) | 牛乳の検査装置 | |
| Meisner et al. | Preliminary analysis of the hemispherical directional reflectance of Alugastrin tablets after 14 days of storage at 40 C | |
| RU2215285C1 (ru) | Рентгенолюминесцентный способ определения концентрации азотных дефектов в алмазах | |
| Kienle et al. | Determining the optical properties of scattering media using a cluster of advanced devices | |
| RU2750292C1 (ru) | Портативный видеоспектрометр |
Legal Events
| Date | Code | Title | Description |
|---|---|---|---|
| ENP | Entry into the national phase |
Ref document number: 2022503547 Country of ref document: JP Kind code of ref document: A |
|
| 121 | Ep: the epo has been informed by wipo that ep was designated in this application |
Ref document number: 21939268 Country of ref document: EP Kind code of ref document: A1 |
|
| WWE | Wipo information: entry into national phase |
Ref document number: 202347071419 Country of ref document: IN |
|
| WWE | Wipo information: entry into national phase |
Ref document number: 2021939268 Country of ref document: EP |
|
| NENP | Non-entry into the national phase |
Ref country code: DE |
|
| ENP | Entry into the national phase |
Ref document number: 2021939268 Country of ref document: EP Effective date: 20231128 |