WO2023013344A1 - 化学分析装置 - Google Patents
化学分析装置 Download PDFInfo
- Publication number
- WO2023013344A1 WO2023013344A1 PCT/JP2022/026667 JP2022026667W WO2023013344A1 WO 2023013344 A1 WO2023013344 A1 WO 2023013344A1 JP 2022026667 W JP2022026667 W JP 2022026667W WO 2023013344 A1 WO2023013344 A1 WO 2023013344A1
- Authority
- WO
- WIPO (PCT)
- Prior art keywords
- chemical analysis
- failure
- data
- analysis device
- diagnosis
- Prior art date
- Legal status (The legal status is an assumption and is not a legal conclusion. Google has not performed a legal analysis and makes no representation as to the accuracy of the status listed.)
- Ceased
Links
Images


Classifications
-
- G—PHYSICS
- G01—MEASURING; TESTING
- G01N—INVESTIGATING OR ANALYSING MATERIALS BY DETERMINING THEIR CHEMICAL OR PHYSICAL PROPERTIES
- G01N21/00—Investigating or analysing materials by the use of optical means, i.e. using sub-millimetre waves, infrared, visible or ultraviolet light
- G01N21/17—Systems in which incident light is modified in accordance with the properties of the material investigated
- G01N21/25—Colour; Spectral properties, i.e. comparison of effect of material on the light at two or more different wavelengths or wavelength bands
- G01N21/27—Colour; Spectral properties, i.e. comparison of effect of material on the light at two or more different wavelengths or wavelength bands using photo-electric detection ; circuits for computing concentration
- G01N21/272—Colour; Spectral properties, i.e. comparison of effect of material on the light at two or more different wavelengths or wavelength bands using photo-electric detection ; circuits for computing concentration for following a reaction, e.g. for determining photometrically a reaction rate (photometric cinetic analysis)
-
- G—PHYSICS
- G01—MEASURING; TESTING
- G01N—INVESTIGATING OR ANALYSING MATERIALS BY DETERMINING THEIR CHEMICAL OR PHYSICAL PROPERTIES
- G01N21/00—Investigating or analysing materials by the use of optical means, i.e. using sub-millimetre waves, infrared, visible or ultraviolet light
- G01N21/17—Systems in which incident light is modified in accordance with the properties of the material investigated
- G01N21/25—Colour; Spectral properties, i.e. comparison of effect of material on the light at two or more different wavelengths or wavelength bands
- G01N21/251—Colorimeters; Construction thereof
- G01N21/253—Colorimeters; Construction thereof for batch operation, i.e. multisample apparatus
-
- G—PHYSICS
- G01—MEASURING; TESTING
- G01N—INVESTIGATING OR ANALYSING MATERIALS BY DETERMINING THEIR CHEMICAL OR PHYSICAL PROPERTIES
- G01N35/00—Automatic analysis not limited to methods or materials provided for in any single one of groups G01N1/00 - G01N33/00; Handling materials therefor
-
- G—PHYSICS
- G01—MEASURING; TESTING
- G01N—INVESTIGATING OR ANALYSING MATERIALS BY DETERMINING THEIR CHEMICAL OR PHYSICAL PROPERTIES
- G01N35/00—Automatic analysis not limited to methods or materials provided for in any single one of groups G01N1/00 - G01N33/00; Handling materials therefor
- G01N35/00584—Control arrangements for automatic analysers
- G01N35/00594—Quality control, including calibration or testing of components of the analyser
- G01N35/00613—Quality control
- G01N35/00623—Quality control of instruments
-
- G—PHYSICS
- G01—MEASURING; TESTING
- G01N—INVESTIGATING OR ANALYSING MATERIALS BY DETERMINING THEIR CHEMICAL OR PHYSICAL PROPERTIES
- G01N35/00—Automatic analysis not limited to methods or materials provided for in any single one of groups G01N1/00 - G01N33/00; Handling materials therefor
- G01N35/02—Automatic analysis not limited to methods or materials provided for in any single one of groups G01N1/00 - G01N33/00; Handling materials therefor using a plurality of sample containers moved by a conveyor system past one or more treatment or analysis stations
- G01N35/025—Automatic analysis not limited to methods or materials provided for in any single one of groups G01N1/00 - G01N33/00; Handling materials therefor using a plurality of sample containers moved by a conveyor system past one or more treatment or analysis stations having a carousel or turntable for reaction cells or cuvettes
Definitions
- the present invention relates to a chemical analysis device, and more particularly to a chemical analysis device equipped with a failure diagnosis function.
- a chemical analyzer consists of an automatic sample and reagent supply mechanism that supplies a sample and reagents to a reaction vessel, an automatic stirring mechanism that agitates the sample and reagents in the reaction vessel, and a ratio that measures the physical properties of the sample during or after the reaction. It has a color measurement unit, an automatic cleaning mechanism that sucks and discharges the sample after measurement and cleans the reaction container, and a control unit that controls these operations.
- the throughput of chemical analyzers ranges from a few hundred tests per hour to over 9000 tests per hour for larger instruments.
- the solution to be measured in the reaction container is irradiated with white light from the light source, and the transmitted light is separated by the spectrometer.
- the absorbance is calculated by measuring the light intensity of a specific wavelength out of the spectrally dispersed light and comparing it with the light intensity of a previously measured standard concentration solution.
- the chemical components in the solution to be measured are analyzed from the absorbance.
- a chemical analyzer uses a halogen lamp as the light source.
- a halogen lamp is a continuous spectrum light source that covers the visible region to the near infrared region. In addition, it has an excellent characteristic that the life of the filament is long due to the halogen cycle.
- a rated life is set for the light source lamp.
- Rated life is defined as the average life of a large number of lamps. Therefore, not all lamps reach the end of their life when they reach their rated life. For example, it may become impossible to light before reaching the rated life.
- a recommended replacement period is set for the lamp.
- the recommended replacement period is set shorter than the rated life. That is, the recommended replacement period is set in consideration of a margin for the rated life. If this margin is too large, the lamp will need to be replaced more frequently, resulting in higher running costs. Therefore, in order to keep running costs down, the recommended replacement period should be set with a small margin for the rated life.
- a phenomenon occurs in which the light amount fluctuates in a short time even if the light amount satisfying the specifications is secured at the end of the life. Fluctuations in the amount of light lead to fluctuations in measurement accuracy. Therefore, there is a limit to setting a recommended lamp replacement period with a small margin.
- Patent Document 1 in order to extend the life of the light source lamp and provide a chemical analysis apparatus capable of ensuring measurement accuracy, the light source driving power is set to a value lower than the rated value in order to extend the life of the lamp. Also, a method of setting the blank absorbance within a predetermined allowable value has been proposed. Further, in Patent Document 1, it is proposed to monitor the light source drive power supplied to the light source to diagnose the life of the light source lamp and to diagnose the failure of the light source lamp, and to monitor the absorbance to diagnose the failure of the light source lamp. ing.
- a sample container holding unit that holds a sample container containing a sample to be measured and a reagent that contains a reagent are disclosed.
- a reagent container holding unit that holds a container
- a reaction container holding unit that holds a reaction container in which a sample and a reagent are stirred
- a sample dispensing unit that aspirates the sample from the sample container and dispenses the sample into the reaction container
- a reagent dispensing unit that aspirates a reagent from a reagent container and dispenses the reagent into a reaction container
- the self-diagnosis of the measurement unit is performed when the automatic analyzer is started, when the measurement of a predetermined unit of samples is started, and when the measurement of a predetermined unit of samples is completed, and based on the measurement values of the measurement unit, the normality of the measurement unit is determined.
- an automatic analyzer has been proposed that includes a control unit that determines an abnormality, and a display unit that displays measured values obtained by self-diagnosis by the measurement unit under the control of the control unit in chronological order.
- Patent Document 1 it is possible to extend the life of the light source lamp and ensure measurement accuracy.
- Patent Document 1 does not describe a method for diagnosing failures other than the light source lamp.
- threshold judgments are made for each of the dispensing mechanism, stirring mechanism, washing mechanism, reaction cell, etc. in order to satisfy the analytical performance of the device, but failure diagnosis for each mechanism is independent, It is difficult to identify the failure point, and it may take time to restore.
- Patent Document 2 even if the measurement unit is determined to be normal at the time of startup, if the measurement unit is determined to be abnormal at the start of measurement of a predetermined unit of samples and at the end of measurement of predetermined units of samples, the measurement unit can be quickly corrected. It is possible to grasp an abnormality and take a predetermined countermeasure, thereby eliminating anomalies in measured values caused by continued use of a measuring unit determined to be abnormal.
- Patent Literature 2 does not describe a method for diagnosing anything other than an abnormality in the measurement unit including the photodetector.
- An object of the present invention is to provide a chemical analysis device that facilitates estimation of failure locations in failure diagnosis.
- the chemical analysis apparatus of the present invention is configured as described in the claims. It should be noted that in the scope of claims, the citation of other claims in the dependent-form claims is a single-claim citation in order to make the description of the dependent-form claims easier to understand. , includes a form of citing a plurality of claims (multiple claim) and a form of citing a plurality of multiple claim(s).
- the chemical analysis apparatus of the present invention includes, for example, a plurality of reaction cells into which specimens and reagents are dispensed.
- a chemical analyzer that measures absorbance with a photometric system that measures light that has passed through the chemical analyzer, and includes a diagnostic unit that performs failure diagnosis.
- a population of photometric data for failure diagnosis is created for each predetermined reaction cell by accumulating time-series photometric system data, and the photometric data of the population of photometric data created for each predetermined reaction cell is set in advance. Failure diagnosis is performed by comparing with a threshold value.
- the diagnosis unit acquires time-series data of various mechanisms that make up the chemical analysis apparatus, such as a dispensing mechanism and a stirring mechanism, and presets the photometric data of the population of the photometric data created for each predetermined reaction cell.
- the failure position is estimated by collating with time-series data of various mechanisms.
- FIG. 1 is a cross-sectional view of a flow chart for explaining the flow of failure diagnosis described in Embodiment 1;
- FIG. 9 is a cross-sectional view of a flow chart for explaining the flow of failure diagnosis described in Embodiment 2;
- FIG. 10 is a diagram illustrating measurement results described in Example 2;
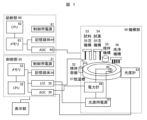
- the chemical analysis apparatus has a control section 30 , a mechanism section 50 and a diagnosis section 60 .
- the control unit 30 has a control power source 31 , a CPU 32 , a memory 33 , a storage medium 34 , an I/O 35 and an AD converter 36 .
- the mechanism unit 50 has a light source power source 41, a light source 42, a multi-wavelength photometer 43, a power meter 44, a sample dispensing mechanism 53, a reagent dispensing mechanism 54, a stirring mechanism 55, a washing mechanism 56, and a constant temperature bath 57. .
- the diagnostic unit 60 has a control power supply 61 , a CPU 62 , a memory 63 , a storage medium 64 and an AD converter 66 .
- the control section 30 drives each section of the mechanism section 50 via the I/O 35 .
- a sample dispensing mechanism 53 dispenses a sample in a specimen container (sample container) 51 into a reaction cell (reaction container) 52 .
- a reagent dispensing mechanism 54 injects a reagent into the reaction container 52 .
- the stirring mechanism 55 stirs the liquid mixture in the reaction cell (reaction vessel) 52 to cause the sample and the reagent to react.
- the cleaning mechanism 56 cleans the reaction cell (reaction container) 52 .
- a constant temperature bath 57 keeps the reaction system at a constant temperature in order to stabilize the reaction.
- the light from the light source 42 is applied to the mixture contained in the reaction cell (reaction vessel) 52 .
- the multi-wavelength photometer 43 detects light of a predetermined wavelength out of the light that has passed through the mixture.
- the AD converter 36 converts analog signals from the multi-wavelength photometer 43 into digital signals.
- the control unit 30 calculates the absorbance by comparing the light intensity detected by the multi-wavelength photometer 43 with the light intensity of the previously measured reference concentration solution.
- the controller 30 analyzes the sample based on the absorbance.
- the light source 42 and multi-wavelength photometer 43 constitute a photometric system.
- a power meter 44 measures the light source driving power, ie, the light source driving current or the light source driving voltage.
- Methods for measuring the light source drive current include a method using a hall element with the light source power supply 41 as a DC power supply, and a method using a current transformer with the light source power supply 41 as an AC power supply.
- the method using the Hall element has the advantage of being able to suppress power loss because the current is measured without contact.
- As a method of measuring the light source driving voltage there is a method of using a shunt resistor to measure the potential difference occurring across the resistor.
- the light source power source 41 supplies power to the light source 42 .
- the light source power source 41 controls power supplied to the light source 42 based on the control signal from the control section 30 .
- the storage medium 34 stores various programs for operating the chemical analyzer.
- the memory 33 stores absorbance and light source drive power in real time.
- a control power supply 31 is a power supply for the control unit 30 .
- the CPU 32 reads programs stored in the storage medium 34 and controls the operation of the control section 30 .
- the measured values of the dynamic characteristics of each mechanism of the mechanism section 50 are transmitted to the ADC 66 of the diagnosis section 60 .
- the storage medium 64 stores threshold values and various programs for estimating the failure location of the chemical analysis device.
- the memory 63 stores the dynamic characteristics of each mechanism of the mechanism section 50 and the measurement results of the photometric system in real time.
- a control power supply 61 is a power supply for the diagnosis section 60 .
- the CPU 62 reads the threshold values and programs stored in the storage medium 64 and controls the operation of the control section 30 .
- the chemical analysis apparatus of the present embodiment includes (1) an absorbance calculation process for calculating the absorbance by comparing the light intensity detected by the multi-wavelength photometer 43 with the light intensity of a previously measured reference concentration solution, and (2) lamp life extension mode operation processing for operating the chemical analyzer in the lamp life extension mode; (3) life determination processing for determining that the light source lamp has reached the end of its life and issuing a warning to that effect; It determines that various mechanisms have failed, and performs failure determination processing for issuing a warning to that effect, (5) failure location estimation processing when various mechanisms have failed, and the like.
- a program for performing these processes (1) to (4) is stored in the storage medium 34.
- FIG. A program for performing the process (5) is stored in the storage medium 64 . The processing of (5) will be described in detail below.
- the measurement values of the photometric system are repeatedly accumulated without changing the conditions to create a population, and the degree of variation is determined by a threshold value.
- one photometric system performs temporally series measurements. Therefore, in most cases, it is diagnosed that a failure or anomaly has occurred at the time when the threshold value has changed as a result of threshold determination. After that, after confirming the failure by going back to the timing at which the failure occurred, in the estimation of the location of the failure, the location of the failure is empirically investigated and the presence or absence of the failure is confirmed.
- the lifetime of each mechanism it is possible to predict failure of each mechanism, but it is necessary to refer to the output result of each mechanism, which takes time.
- sample specimens and reagents for failure diagnosis are dispensed into a plurality of reaction cells to record photometric data.
- a population of photometric system data is created for each reaction cell position, and failures are diagnosed.
- a sample specimen for failure diagnosis for example, a glycerin aqueous solution is used. The concentration of the glycerin aqueous solution is changed to simulate the viscosity of the analysis target of the chemical analyzer. Physiological saline may be used instead of the aqueous glycerin solution.
- a reagent for failure diagnosis for example, a dye solution such as amido black is used.
- a specimen container (illustration omitted) for containing a sample specimen for failure diagnosis is provided as a specimen container (sample container).
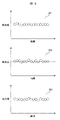
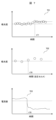
- FIG. 2 shows a diagram for explaining the measurement results of the photometry system of this embodiment.
- data 201 to data 203 are obtained.
- a difference or a coefficient of variation obtained by dividing the standard deviation of the measured absorbance values by the average value is used as an index and compared with a preset threshold to diagnose a failure.
- Data 201 to data 203 indicate the measurement results of different reaction cells, and the data are recorded so that the measurement results of the reaction cell at which position can be identified. That is, a failure diagnosis population is created based on the measurement time information and the reaction cell position information.
- the time axis of the horizontal axis is, for example, on the order of several seconds.
- Photometric data measured in series over time to generate a population may be measured with the reaction cell empty, or filled with sample specimens and reagents for fault diagnosis as described above. good too. In the former case, costs can be suppressed by not using sample specimens and reagents for failure diagnosis. In the latter case, the population created by temporal series measurements and the population organized for each reaction cell can be created from common photometric data, so the time required to measure failure diagnosis data can be shortened. . Further, if photometry can be performed without substantially changing the conditions, failure diagnosis may be made using photometric data of the analysis target of the chemical analyzer instead of sample specimens and reagents for failure diagnosis. What is important is to create a population of photometric data for each reaction cell and perform fault diagnosis.
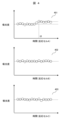
- reaction cells (A, B, and C) to be used for failure diagnosis are selected, and sample specimens and reagents for failure diagnosis are dispensed into the selected reaction cells and photometry is performed. Record data.
- the results indicated by data 401, data 402, and data 403 are plotted by collecting data measured at positions of reaction cell A, reaction cell B, and reaction cell C, respectively, on a predetermined time axis. It is what I did.
- the average value is, for example, a moving average of the latest three measurement data.
- the diameter of the circle in the plot corresponds to the threshold. Just before time t5, the difference from the average value up to that point exceeds the threshold.
- the number of reaction cells to be selected is not limited to three. As the number of selected locations increases, the accuracy of estimating the failure location improves. That is, the positions and number of reaction cells used for failure diagnosis are set according to the total number of reaction cells. At that time, it is desirable to arrange the selected points evenly in the circumferential direction of the constant temperature bath 57 .
- the population has spatial information (position information of the reaction cells), it is possible to estimate the failure location. For example, in the measurement results of FIG. 4, it can be estimated that a failure occurred at a location related to the reaction cell A. When reaction cell B and reaction cell C also generate failure determination results at the same time, it can be inferred that a failure has occurred by a mechanism common to reaction cells A to C. FIG. In this way, since the location of the failure can be estimated by combining spatial independence and temporal continuity, the time required for failure cause analysis and restoration can be shortened.
- a new threshold may be determined based on the accumulated photometric data for the threshold used for failure diagnosis.
- the photometric data is accumulated and the failure is judged (estimated) using the threshold values up to that point, there are cases where it is found that there is actually no failure several times. If so, set the threshold loosely. In the case of FIG. 4, the diameter of the circle in the plot is set large.
- Photometric data and operation data of various mechanisms are transmitted from the mechanical section 50 to the AD converter 66 of the diagnostic section 60 and temporarily stored in the memory 63 .
- a storage medium 64 stores a program for organizing photometric data in chronological order (temporally in series) and populations for each reaction cell, and threshold values for fault determination and the like for each population. Process the data to determine faults.
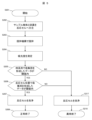
- FIG. 5 is a flow chart for performing failure location estimation processing and the like when various mechanisms described in the first embodiment fail.
- S201 failure diagnosis is started.
- S202 sample specimens and reagents for failure diagnosis are dispensed into reaction cells.
- S203 the sample reagent and the reagent are stirred by the stirring mechanism.
- S204 absorbance is measured by a photometric system.
- a failure is determined for the data forming a population in series in terms of time.
- the value is outside the threshold, it is determined that a failure has occurred in one of the chemical analyzers.
- S205 If it is determined that the value is outside the threshold value in S205, it can be determined that a failure has occurred in one of the chemical analysis devices. You can do it. In general, it is more likely that the measured data in each reaction cell will change than the data (measured data of the entire chemical analyzer) that forms a population in series over time. Considering this, S205 may be omitted.
- the apparatus configuration is the same as that of the first embodiment.
- the fault diagnosis program and the like stored in the storage medium of the diagnosis unit 60 are different.
- FIG. 6 is a flow chart for performing failure location estimation processing and the like when various mechanisms described in the second embodiment fail.
- S601 to S607 and S617 and S618 are the same as S201 to S207 and S217 and S218 of the first embodiment.
- a control signal for dispensing is transmitted to the diagnostic unit 60 to acquire data.
- the data to be acquired are, for example, the pressure value in the dispensing path, the current value during pressure control of the syringe pump, and the like.
- the output of the ultrasonic waves during stirring is transmitted to the diagnostic unit 60 to acquire data in chronological order.
- Acquired data includes the sound pressure value of the output ultrasonic wave, the current value when the ultrasonic element is driven, and the like.
- FIG. 7 shows data 701 forming a population in chronological order, data 702 forming a population in a reaction cell (reaction cell A in FIG. 7), and acquisition data 703 of current values during stirring in reaction cell A. show.
- the current value during stirring of the stirring mechanism may be used regardless of the reaction cell.
- the data 702 and the data 703 are associated with each other in consideration of the time difference from the agitation mechanism to the absorbance measurement position.
- Data 701 that forms a population in time series shows data whose average value changes at time t71.
- the abnormality is detected earlier than the data 701 forming the population in chronological order, and it can be estimated that the abnormality has occurred in the stirring mechanism both in terms of the failure position and the estimation.
- an abnormality occurs in the sample pipetting mechanism or the reagent pipetting mechanism, it is possible to similarly estimate the position of the abnormality.
- this embodiment it is also possible to apply this embodiment to the cleaning mechanism for failure diagnosis. Further, as for the abnormality of the light source lamp, failure diagnosis may be performed by applying the method described in Patent Document 1.
- data for failure diagnosis may be acquired several times in one day, and data acquisition and diagnosis may be performed. As the number of failure diagnosis times increases, the time resolution of abnormality detection improves.
- the present invention it is possible to estimate the location of the failure (location requiring restoration) during failure diagnosis, and shorten the recovery time from the failure. Furthermore, it is possible to increase the detection probability of an abnormality at an early stage, reduce the possibility of misdiagnosis, and improve the analysis performance.
- the present invention is not limited to the above-described examples, and includes various modifications.
- the above embodiments have been described in detail for easy understanding of the present invention, and are not necessarily limited to those having all the described configurations.
- it is possible to replace part of the configuration of one embodiment with the configuration of another embodiment and it is also possible to add the configuration of another embodiment to the configuration of one embodiment.
- SYMBOLS 30 Control part, 31... Control power supply, 32... CPU, 33... Memory, 34... Storage medium, 35... I/O, 36... AD converter, 41... Light source power supply, 42... Light source, 43... Multi-wavelength Photometer 44 Power meter 50 Mechanism unit 51 Specimen container (sample container) 52 Reaction cell (reaction container) 53 Sample dispensing mechanism 54 Reagent dispensing mechanism 55 Stirring mechanism 56... Cleaning mechanism, 57... Constant temperature bath, 60... Diagnosis part, 61... Control power supply, 62... CPU, 63... Memory, 64... Storage medium, 66... AD converter.
Landscapes
- Physics & Mathematics (AREA)
- Chemical & Material Sciences (AREA)
- Immunology (AREA)
- Pathology (AREA)
- Analytical Chemistry (AREA)
- Biochemistry (AREA)
- General Health & Medical Sciences (AREA)
- General Physics & Mathematics (AREA)
- Health & Medical Sciences (AREA)
- Life Sciences & Earth Sciences (AREA)
- Engineering & Computer Science (AREA)
- Spectroscopy & Molecular Physics (AREA)
- Chemical Kinetics & Catalysis (AREA)
- Quality & Reliability (AREA)
- Mathematical Physics (AREA)
- Theoretical Computer Science (AREA)
- Automatic Analysis And Handling Materials Therefor (AREA)
Abstract
Description
従って、ランニングコストを抑えるためには、定格寿命に対して少ないマージンを見込んで推奨交換期間を設定すればよい。しかしながら、この場合、寿命末期において仕様を満足する光量が確保されていても短時間で光量が変動する現象が起きることが知られている。光量の変動は測定精度の変動につながる。そのため、マージンを少なくしてランプの推奨交換期間を設定することには限界がある。
しかしながら、特許文献1には、光源ランプ以外の故障について診断する方法は記載されていない。光源ランプ以外にも、分注機構、撹拌機構、洗浄機構、反応セルなど装置の分析性能を満たすために各々閾値判断などされている場合があるが、各機構の故障診断は独立していて、故障個所の特定が難しく、復旧に時間がかかってしまうことがある。
具体的には、本発明の化学分析装置は、例えば、検体と試薬が分注される反応セルを複数備え、反応セルに収容された検体と試薬の混合液に光を照射して混合液を通過した光を測光する測光系により吸光度測定を行う化学分析装置であって、故障診断を行う診断部を備え、診断部は、故障診断用のサンプル検体と故障診断用の試薬を用いて測定された時系列の測光系データを蓄積し、所定の反応セル毎に故障診断用の測光データの母集団を作成し、所定の反応セル毎に作成した測光データの母集団の測光データと予め設定した閾値と比較して故障診断するものである。
また、診断部は、分注機構や攪拌機構などの化学分析装置を構成する各種機構の時系列データを取得し、所定の反応セル毎に作成した測光データの母集団の測光データと予め設定した閾値と比較して故障判定した場合、各種機構の時系列データと照合して故障位置を推定する。
上記した以外の課題、構成及び効果は、以下の実施形態の説明により明らかにされる。
化学分析装置は、制御部30と機構部50と診断部60を有する。制御部30は、制御用電源31、CPU32、メモリ33、記憶媒体34、I/O35、及び、AD変換器36を有する。機構部50は、光源用電源41、光源42、多波長光度計43、電力計44、試料分注機構53、試薬分注機構54、攪拌機構55、洗浄機構56、及び、恒温槽57を有する。診断部60は、制御用電源61、CPU62、メモリ63、記憶媒体64、及び、AD変換器66を有する。
制御部30は、I/O35を介して、機構部50の各部を駆動する。試料分注機構53は、検体容器(試料容器)51内の試料を反応セル(反応容器)52に分注する。試薬分注機構54は、反応容器52に試薬を注入する。攪拌機構55は、反応セル(反応容器)52内の混合液を攪拌し、試料と試薬を反応させる。洗浄機構56は、反応セル(反応容器)52を洗浄する。恒温槽57は、反応を安定させるために反応系を一定温度に保持する。
光源42からの光は反応セル(反応容器)52に収容された混合液に照射される。多波長光度計43は、混合液を通過した光のうち所定の波長の光を検出する。AD変換器36は、多波長光度計43からのアナログ信号をデジタル信号に変換する。制御部30は、多波長光度計43によって検出された光強度と予め測定した基準濃度の溶液の光強度と比較することにより、吸光度を算出する。制御部30は、吸光度に基づいて試料を分析する。
光源42、多波長光度計43は測光系を構成する。
電力計44は、光源駆動電力、即ち、光源駆動電流又は光源駆動電圧を測定する。光源駆動電流の測定方法には、光源用電源41を直流電源としてホール素子を用いる方法、光源用電源41を交流電源としてカレントトランスを用いる方法などがある。ホール素子を用いる方法は、非接触で電流を測定するため、電力のロスを抑えることができる利点がある。光源駆動電圧の測定方法には、シャント抵抗を用いて抵抗の両端に生じる電位差を測定する方法がある。
光源用電源41は光源42に電力を供給する。光源用電源41は、制御部30からの制御信号に基づいて、光源42に供給する電力を制御する。記憶媒体34は、化学分析装置を運転するための各種のプログラムを格納する。メモリ33は、リアルタイムにて吸光度及び光源駆動電力を記憶する。制御用電源31は制御部30のための電源である。CPU32は、記憶媒体34に格納されているプログラムを読み出し、制御部30の動作を制御する。
なお、横軸の時間軸は例えば数秒オーダである。
図5は、実施例1に記載する各種機構が故障した際の故障個所推定処理等を行うためのフローチャートである。
S201では、故障診断を開始する。
S202では、故障診断用のサンプル検体と試薬を反応セルへ分注する。
S203では、撹拌機構でサンプル試薬と試薬を撹拌する。
S204では、測光系で吸光度を測定する。
S205で閾値外の判定では、化学分析装置の何れかで故障が生じたものと判定する。
S206で閾値外の判定では、故障個所を推定して、反応セルを洗浄し、正常終了に進む。なお、S205で閾値外の判定では、反応セルを洗浄し、正常終了に進む。
装置構成は実施例1と同様である。診断部60の記憶媒体に格納される故障診断のプログラム等が異なる。
S601からS607、およびS617、S618までは、実施例1のS201から207、およびS217、S218と同様である。
Claims (9)
- 検体と試薬が分注される反応セルを複数備え、前記反応セルに収容された前記検体と前記試薬の混合液に光を照射して前記混合液を通過した光を測光する測光系により吸光度測定を行う化学分析装置であって、
故障診断を行う診断部を備え、前記診断部は、所定の反応セル毎に故障診断用の測光データの母集団を作成し、前記所定の反応セル毎に作成した測光データの母集団の測光データと予め設定した閾値と比較して故障診断することを特徴とする化学分析装置。 - 請求項1に記載の化学分析装置において、
前記診断部は、故障診断用のサンプル検体と故障診断用の試薬を用いて測定された時系列の測光データを蓄積し、前記蓄積された測光データに基づき、前記所定の反応セル毎に故障診断用の測光データの母集団を作成することを特徴とする化学分析装置。 - 請求項2に記載の化学分析装置において、
前記閾値と比較する測光データは、前記測光データの測定値と平均値の差分量であることを特徴とする化学分析装置。 - 請求項2に記載の化学分析装置において、
前記閾値と比較する測光データは、前記測光データの測定値の標準偏差を平均値で割った変動係数であることを特徴とする化学分析装置。 - 請求項2に記載の化学分析装置において、
前記診断部は、前記化学分析装置を構成する機構の時系列データを取得し、前記所定の反応セル毎に作成した測光データの母集団の測光データと前記予め設定した閾値と比較して故障判定した場合、前記機構の時系列データと照合して故障位置を推定することを特徴とする化学分析装置。 - 請求項5に記載の化学分析装置において、
前記化学分析装置を構成する機構は、試料分注機構または試薬分注機構であり、前記化学分析装置を構成する機構の時系列データは前記試料分注機構または前記試薬分注機構を構成する分注経路における圧力値またはシリンジポンプの圧力制御時の電流値であることを特徴とする化学分析装置。 - 請求項5に記載の化学分析装置において、
前記化学分析装置を構成する機構は、前記検体と前記試薬を攪拌する攪拌機構であり、前記化学分析装置を構成する機構の時系列データは前記攪拌機構を構成する超音波素子の出力超音波の音圧値または前記超音波素子の駆動時の電流値であることを特徴とする化学分析装置。 - 請求項2に記載の化学分析装置において、
前記診断部は、前記測光データを蓄積し、蓄積データにより新たな閾値を決定することを特徴とする化学分析装置。 - 請求項2に記載する化学分析装置において、
前記反応セルの総数に応じて故障診断に用いる反応セルの位置と数を設定することを特徴とする化学分析装置。
Priority Applications (3)
| Application Number | Priority Date | Filing Date | Title |
|---|---|---|---|
| US18/293,669 US20240344973A1 (en) | 2021-08-03 | 2022-07-05 | Chemical Analysis Device |
| CN202280051255.3A CN117677850A (zh) | 2021-08-03 | 2022-07-05 | 化学分析装置 |
| EP22852770.1A EP4382917A4 (en) | 2021-08-03 | 2022-07-05 | CHEMICAL ANALYSIS DEVICE |
Applications Claiming Priority (2)
| Application Number | Priority Date | Filing Date | Title |
|---|---|---|---|
| JP2021127584A JP7643971B2 (ja) | 2021-08-03 | 2021-08-03 | 化学分析装置 |
| JP2021-127584 | 2021-08-03 |
Publications (1)
| Publication Number | Publication Date |
|---|---|
| WO2023013344A1 true WO2023013344A1 (ja) | 2023-02-09 |
Family
ID=85155850
Family Applications (1)
| Application Number | Title | Priority Date | Filing Date |
|---|---|---|---|
| PCT/JP2022/026667 Ceased WO2023013344A1 (ja) | 2021-08-03 | 2022-07-05 | 化学分析装置 |
Country Status (5)
| Country | Link |
|---|---|
| US (1) | US20240344973A1 (ja) |
| EP (1) | EP4382917A4 (ja) |
| JP (1) | JP7643971B2 (ja) |
| CN (1) | CN117677850A (ja) |
| WO (1) | WO2023013344A1 (ja) |
Families Citing this family (1)
| Publication number | Priority date | Publication date | Assignee | Title |
|---|---|---|---|---|
| KR102616451B1 (ko) * | 2023-04-03 | 2023-12-27 | (주)백년기술 | 오류 감지 및 자가진단 기능을 갖는 뱃치형 화학분석장치 및 그 장치의 자가진단 방법 |
Citations (7)
| Publication number | Priority date | Publication date | Assignee | Title |
|---|---|---|---|---|
| JPS6125064A (ja) * | 1984-07-14 | 1986-02-03 | Shimadzu Corp | 自動化学分析装置 |
| JPH11326334A (ja) * | 1998-03-19 | 1999-11-26 | Olympus Optical Co Ltd | 自動分析装置 |
| JP2000105239A (ja) * | 1998-09-29 | 2000-04-11 | Hitachi Ltd | 生化学自動分析装置 |
| JP2001091518A (ja) * | 1999-09-20 | 2001-04-06 | Hitachi Ltd | 自動分析装置 |
| JP2008058151A (ja) * | 2006-08-31 | 2008-03-13 | Hitachi High-Technologies Corp | 化学分析装置 |
| WO2014021047A1 (ja) * | 2012-07-30 | 2014-02-06 | 株式会社日立ハイテクノロジーズ | データ処理装置及びそれを用いた自動分析装置 |
| WO2021256027A1 (ja) * | 2020-06-18 | 2021-12-23 | 株式会社日立ハイテク | 自動化学分析装置および電気インピーダンススペクトル測定器 |
Family Cites Families (4)
| Publication number | Priority date | Publication date | Assignee | Title |
|---|---|---|---|---|
| JP5562421B2 (ja) * | 2010-07-14 | 2014-07-30 | 株式会社日立ハイテクノロジーズ | 自動分析装置、分析方法及び情報処理装置 |
| JP5939833B2 (ja) * | 2012-02-24 | 2016-06-22 | 株式会社日立ハイテクノロジーズ | 自動分析装置 |
| JP6257418B2 (ja) * | 2014-04-01 | 2018-01-10 | 株式会社日立ハイテクノロジーズ | 自動分析装置 |
| JP7029988B2 (ja) * | 2018-03-15 | 2022-03-04 | 日本電子株式会社 | 自動分析装置 |
-
2021
- 2021-08-03 JP JP2021127584A patent/JP7643971B2/ja active Active
-
2022
- 2022-07-05 EP EP22852770.1A patent/EP4382917A4/en active Pending
- 2022-07-05 US US18/293,669 patent/US20240344973A1/en active Pending
- 2022-07-05 CN CN202280051255.3A patent/CN117677850A/zh active Pending
- 2022-07-05 WO PCT/JP2022/026667 patent/WO2023013344A1/ja not_active Ceased
Patent Citations (7)
| Publication number | Priority date | Publication date | Assignee | Title |
|---|---|---|---|---|
| JPS6125064A (ja) * | 1984-07-14 | 1986-02-03 | Shimadzu Corp | 自動化学分析装置 |
| JPH11326334A (ja) * | 1998-03-19 | 1999-11-26 | Olympus Optical Co Ltd | 自動分析装置 |
| JP2000105239A (ja) * | 1998-09-29 | 2000-04-11 | Hitachi Ltd | 生化学自動分析装置 |
| JP2001091518A (ja) * | 1999-09-20 | 2001-04-06 | Hitachi Ltd | 自動分析装置 |
| JP2008058151A (ja) * | 2006-08-31 | 2008-03-13 | Hitachi High-Technologies Corp | 化学分析装置 |
| WO2014021047A1 (ja) * | 2012-07-30 | 2014-02-06 | 株式会社日立ハイテクノロジーズ | データ処理装置及びそれを用いた自動分析装置 |
| WO2021256027A1 (ja) * | 2020-06-18 | 2021-12-23 | 株式会社日立ハイテク | 自動化学分析装置および電気インピーダンススペクトル測定器 |
Non-Patent Citations (1)
| Title |
|---|
| See also references of EP4382917A4 * |
Also Published As
| Publication number | Publication date |
|---|---|
| JP2023022610A (ja) | 2023-02-15 |
| EP4382917A1 (en) | 2024-06-12 |
| EP4382917A4 (en) | 2025-08-06 |
| JP7643971B2 (ja) | 2025-03-11 |
| US20240344973A1 (en) | 2024-10-17 |
| CN117677850A (zh) | 2024-03-08 |
Similar Documents
| Publication | Publication Date | Title |
|---|---|---|
| JP4654256B2 (ja) | 自動分析装置 | |
| US10352864B2 (en) | Automatic analyzer for identifying a cause of abnormalities of measurement results | |
| CN101358986A (zh) | 自动分析装置 | |
| JP2010151519A (ja) | 自動分析装置 | |
| JP6945479B2 (ja) | 分析物濃度を決定する方法 | |
| US9575083B2 (en) | Automatic analysis apparatus | |
| JP2004251802A (ja) | 自動分析装置 | |
| JP2000105239A (ja) | 生化学自動分析装置 | |
| JP7643971B2 (ja) | 化学分析装置 | |
| JP7681693B2 (ja) | 診断システム、自動分析装置及び診断方法 | |
| CN104487848B (zh) | 维护支持系统 | |
| CN110794108B (zh) | 一种液体监测传感器状态的自动检测方法及装置 | |
| US20250155460A1 (en) | Parts Anomaly Detection System, Automatic Analyzer and Parts Anomaly Detection Method | |
| JP7820410B2 (ja) | 自動分析装置及び光源ランプの寿命の判定方法 | |
| JP4825442B2 (ja) | 臨床検査用自動分析装置の精度管理方法、及び自動分析装置 | |
| JP4723439B2 (ja) | 化学分析装置 | |
| WO2022185641A1 (ja) | 電解質測定装置、および電解質濃度測定ユニットの異常判定方法 | |
| US20260009810A1 (en) | Real-time cuvette monitoring | |
| US12243639B2 (en) | Liquid handling in automated analyser systems | |
| JP7357557B2 (ja) | 自動分析装置及び反応異常判定方法 | |
| WO2024237046A1 (ja) | 自動分析装置およびタイミング設定方法 | |
| JP2007240181A (ja) | 医用分析装置 |
Legal Events
| Date | Code | Title | Description |
|---|---|---|---|
| 121 | Ep: the epo has been informed by wipo that ep was designated in this application |
Ref document number: 22852770 Country of ref document: EP Kind code of ref document: A1 |
|
| WWE | Wipo information: entry into national phase |
Ref document number: 202280051255.3 Country of ref document: CN |
|
| WWE | Wipo information: entry into national phase |
Ref document number: 18293669 Country of ref document: US |
|
| NENP | Non-entry into the national phase |
Ref country code: DE |
|
| ENP | Entry into the national phase |
Ref document number: 2022852770 Country of ref document: EP Effective date: 20240304 |