WO2023023756A1 - Determining properties of samples using quantum sensing - Google Patents
Determining properties of samples using quantum sensing Download PDFInfo
- Publication number
- WO2023023756A1 WO2023023756A1 PCT/AU2022/050983 AU2022050983W WO2023023756A1 WO 2023023756 A1 WO2023023756 A1 WO 2023023756A1 AU 2022050983 W AU2022050983 W AU 2022050983W WO 2023023756 A1 WO2023023756 A1 WO 2023023756A1
- Authority
- WO
- WIPO (PCT)
- Prior art keywords
- sample
- quantum sensor
- ferritin
- illumination
- iron
- Prior art date
- Legal status (The legal status is an assumption and is not a legal conclusion. Google has not performed a legal analysis and makes no representation as to the accuracy of the status listed.)
- Ceased
Links
Classifications
-
- G—PHYSICS
- G01—MEASURING; TESTING
- G01N—INVESTIGATING OR ANALYSING MATERIALS BY DETERMINING THEIR CHEMICAL OR PHYSICAL PROPERTIES
- G01N21/00—Investigating or analysing materials by the use of optical means, i.e. using sub-millimetre waves, infrared, visible or ultraviolet light
- G01N21/62—Systems in which the material investigated is excited whereby it emits light or causes a change in wavelength of the incident light
- G01N21/63—Systems in which the material investigated is excited whereby it emits light or causes a change in wavelength of the incident light optically excited
- G01N21/64—Fluorescence; Phosphorescence
- G01N21/6489—Photoluminescence of semiconductors
-
- G—PHYSICS
- G01—MEASURING; TESTING
- G01N—INVESTIGATING OR ANALYSING MATERIALS BY DETERMINING THEIR CHEMICAL OR PHYSICAL PROPERTIES
- G01N24/00—Investigating or analyzing materials by the use of nuclear magnetic resonance, electron paramagnetic resonance or other spin effects
- G01N24/08—Investigating or analyzing materials by the use of nuclear magnetic resonance, electron paramagnetic resonance or other spin effects by using nuclear magnetic resonance
- G01N24/088—Assessment or manipulation of a chemical or biochemical reaction, e.g. verification whether a chemical reaction occurred or whether a ligand binds to a receptor in drug screening or assessing reaction kinetics
-
- G—PHYSICS
- G01—MEASURING; TESTING
- G01N—INVESTIGATING OR ANALYSING MATERIALS BY DETERMINING THEIR CHEMICAL OR PHYSICAL PROPERTIES
- G01N21/00—Investigating or analysing materials by the use of optical means, i.e. using sub-millimetre waves, infrared, visible or ultraviolet light
- G01N21/62—Systems in which the material investigated is excited whereby it emits light or causes a change in wavelength of the incident light
- G01N21/63—Systems in which the material investigated is excited whereby it emits light or causes a change in wavelength of the incident light optically excited
- G01N21/64—Fluorescence; Phosphorescence
- G01N21/6408—Fluorescence; Phosphorescence with measurement of decay time, time resolved fluorescence
-
- G—PHYSICS
- G01—MEASURING; TESTING
- G01N—INVESTIGATING OR ANALYSING MATERIALS BY DETERMINING THEIR CHEMICAL OR PHYSICAL PROPERTIES
- G01N21/00—Investigating or analysing materials by the use of optical means, i.e. using sub-millimetre waves, infrared, visible or ultraviolet light
- G01N21/62—Systems in which the material investigated is excited whereby it emits light or causes a change in wavelength of the incident light
- G01N21/63—Systems in which the material investigated is excited whereby it emits light or causes a change in wavelength of the incident light optically excited
- G01N21/64—Fluorescence; Phosphorescence
- G01N21/6486—Measuring fluorescence of biological material, e.g. DNA, RNA, cells
-
- G—PHYSICS
- G01—MEASURING; TESTING
- G01N—INVESTIGATING OR ANALYSING MATERIALS BY DETERMINING THEIR CHEMICAL OR PHYSICAL PROPERTIES
- G01N24/00—Investigating or analyzing materials by the use of nuclear magnetic resonance, electron paramagnetic resonance or other spin effects
- G01N24/10—Investigating or analyzing materials by the use of nuclear magnetic resonance, electron paramagnetic resonance or other spin effects by using electron paramagnetic resonance
-
- G—PHYSICS
- G01—MEASURING; TESTING
- G01N—INVESTIGATING OR ANALYSING MATERIALS BY DETERMINING THEIR CHEMICAL OR PHYSICAL PROPERTIES
- G01N33/00—Investigating or analysing materials by specific methods not covered by groups G01N1/00 - G01N31/00
- G01N33/48—Biological material, e.g. blood, urine; Haemocytometers
- G01N33/50—Chemical analysis of biological material, e.g. blood, urine; Testing involving biospecific ligand binding methods; Immunological testing
-
- G—PHYSICS
- G01—MEASURING; TESTING
- G01N—INVESTIGATING OR ANALYSING MATERIALS BY DETERMINING THEIR CHEMICAL OR PHYSICAL PROPERTIES
- G01N33/00—Investigating or analysing materials by specific methods not covered by groups G01N1/00 - G01N31/00
- G01N33/48—Biological material, e.g. blood, urine; Haemocytometers
- G01N33/50—Chemical analysis of biological material, e.g. blood, urine; Testing involving biospecific ligand binding methods; Immunological testing
- G01N33/90—Chemical analysis of biological material, e.g. blood, urine; Testing involving biospecific ligand binding methods; Immunological testing involving iron binding capacity of blood
-
- G—PHYSICS
- G01—MEASURING; TESTING
- G01R—MEASURING ELECTRIC VARIABLES; MEASURING MAGNETIC VARIABLES
- G01R33/00—Arrangements or instruments for measuring magnetic variables
- G01R33/20—Arrangements or instruments for measuring magnetic variables involving magnetic resonance
- G01R33/28—Details of apparatus provided for in groups G01R33/44 - G01R33/64
- G01R33/32—Excitation or detection systems, e.g. using radio frequency signals
- G01R33/323—Detection of MR without the use of RF or microwaves, e.g. force-detected MR, thermally detected MR, MR detection via electrical conductivity, optically detected MR
-
- H—ELECTRICITY
- H10—SEMICONDUCTOR DEVICES; ELECTRIC SOLID-STATE DEVICES NOT OTHERWISE PROVIDED FOR
- H10D—INORGANIC ELECTRIC SEMICONDUCTOR DEVICES
- H10D48/00—Individual devices not covered by groups H10D1/00 - H10D44/00
- H10D48/385—Devices using spin-polarised carriers
-
- H—ELECTRICITY
- H10—SEMICONDUCTOR DEVICES; ELECTRIC SOLID-STATE DEVICES NOT OTHERWISE PROVIDED FOR
- H10D—INORGANIC ELECTRIC SEMICONDUCTOR DEVICES
- H10D62/00—Semiconductor bodies, or regions thereof, of devices having potential barriers
- H10D62/80—Semiconductor bodies, or regions thereof, of devices having potential barriers characterised by the materials
- H10D62/83—Semiconductor bodies, or regions thereof, of devices having potential barriers characterised by the materials being Group IV materials, e.g. B-doped Si or undoped Ge
- H10D62/8303—Diamond
-
- B—PERFORMING OPERATIONS; TRANSPORTING
- B01—PHYSICAL OR CHEMICAL PROCESSES OR APPARATUS IN GENERAL
- B01J—CHEMICAL OR PHYSICAL PROCESSES, e.g. CATALYSIS OR COLLOID CHEMISTRY; THEIR RELEVANT APPARATUS
- B01J3/00—Processes of utilising sub-atmospheric or super-atmospheric pressure to effect chemical or physical change of matter; Apparatus therefor
- B01J3/06—Processes using ultra-high pressure, e.g. for the formation of diamonds; Apparatus therefor, e.g. moulds or dies
- B01J3/065—Presses for the formation of diamonds or boronitrides
-
- B—PERFORMING OPERATIONS; TRANSPORTING
- B82—NANOTECHNOLOGY
- B82Y—SPECIFIC USES OR APPLICATIONS OF NANOSTRUCTURES; MEASUREMENT OR ANALYSIS OF NANOSTRUCTURES; MANUFACTURE OR TREATMENT OF NANOSTRUCTURES
- B82Y15/00—Nanotechnology for interacting, sensing or actuating, e.g. quantum dots as markers in protein assays or molecular motors
-
- C—CHEMISTRY; METALLURGY
- C30—CRYSTAL GROWTH
- C30B—SINGLE-CRYSTAL GROWTH; UNIDIRECTIONAL SOLIDIFICATION OF EUTECTIC MATERIAL OR UNIDIRECTIONAL DEMIXING OF EUTECTOID MATERIAL; REFINING BY ZONE-MELTING OF MATERIAL; PRODUCTION OF A HOMOGENEOUS POLYCRYSTALLINE MATERIAL WITH DEFINED STRUCTURE; SINGLE CRYSTALS OR HOMOGENEOUS POLYCRYSTALLINE MATERIAL WITH DEFINED STRUCTURE; AFTER-TREATMENT OF SINGLE CRYSTALS OR A HOMOGENEOUS POLYCRYSTALLINE MATERIAL WITH DEFINED STRUCTURE; APPARATUS THEREFOR
- C30B25/00—Single-crystal growth by chemical reaction of reactive gases, e.g. chemical vapour-deposition growth
- C30B25/02—Epitaxial-layer growth
-
- C—CHEMISTRY; METALLURGY
- C30—CRYSTAL GROWTH
- C30B—SINGLE-CRYSTAL GROWTH; UNIDIRECTIONAL SOLIDIFICATION OF EUTECTIC MATERIAL OR UNIDIRECTIONAL DEMIXING OF EUTECTOID MATERIAL; REFINING BY ZONE-MELTING OF MATERIAL; PRODUCTION OF A HOMOGENEOUS POLYCRYSTALLINE MATERIAL WITH DEFINED STRUCTURE; SINGLE CRYSTALS OR HOMOGENEOUS POLYCRYSTALLINE MATERIAL WITH DEFINED STRUCTURE; AFTER-TREATMENT OF SINGLE CRYSTALS OR A HOMOGENEOUS POLYCRYSTALLINE MATERIAL WITH DEFINED STRUCTURE; APPARATUS THEREFOR
- C30B29/00—Single crystals or homogeneous polycrystalline material with defined structure characterised by the material or by their shape
- C30B29/02—Elements
- C30B29/04—Diamond
-
- C—CHEMISTRY; METALLURGY
- C30—CRYSTAL GROWTH
- C30B—SINGLE-CRYSTAL GROWTH; UNIDIRECTIONAL SOLIDIFICATION OF EUTECTIC MATERIAL OR UNIDIRECTIONAL DEMIXING OF EUTECTOID MATERIAL; REFINING BY ZONE-MELTING OF MATERIAL; PRODUCTION OF A HOMOGENEOUS POLYCRYSTALLINE MATERIAL WITH DEFINED STRUCTURE; SINGLE CRYSTALS OR HOMOGENEOUS POLYCRYSTALLINE MATERIAL WITH DEFINED STRUCTURE; AFTER-TREATMENT OF SINGLE CRYSTALS OR A HOMOGENEOUS POLYCRYSTALLINE MATERIAL WITH DEFINED STRUCTURE; APPARATUS THEREFOR
- C30B33/00—After-treatment of single crystals or homogeneous polycrystalline material with defined structure
- C30B33/04—After-treatment of single crystals or homogeneous polycrystalline material with defined structure using electric or magnetic fields or particle radiation
-
- G—PHYSICS
- G01—MEASURING; TESTING
- G01N—INVESTIGATING OR ANALYSING MATERIALS BY DETERMINING THEIR CHEMICAL OR PHYSICAL PROPERTIES
- G01N2201/00—Features of devices classified in G01N21/00
- G01N2201/12—Circuits of general importance; Signal processing
- G01N2201/127—Calibration; base line adjustment; drift compensation
-
- G—PHYSICS
- G01—MEASURING; TESTING
- G01N—INVESTIGATING OR ANALYSING MATERIALS BY DETERMINING THEIR CHEMICAL OR PHYSICAL PROPERTIES
- G01N2333/00—Assays involving biological materials from specific organisms or of a specific nature
- G01N2333/435—Assays involving biological materials from specific organisms or of a specific nature from animals; from humans
- G01N2333/46—Assays involving biological materials from specific organisms or of a specific nature from animals; from humans from vertebrates
- G01N2333/47—Assays involving proteins of known structure or function as defined in the subgroups
-
- G—PHYSICS
- G01—MEASURING; TESTING
- G01N—INVESTIGATING OR ANALYSING MATERIALS BY DETERMINING THEIR CHEMICAL OR PHYSICAL PROPERTIES
- G01N2800/00—Detection or diagnosis of diseases
- G01N2800/04—Endocrine or metabolic disorders
-
- G—PHYSICS
- G01—MEASURING; TESTING
- G01N—INVESTIGATING OR ANALYSING MATERIALS BY DETERMINING THEIR CHEMICAL OR PHYSICAL PROPERTIES
- G01N2800/00—Detection or diagnosis of diseases
- G01N2800/22—Haematology
-
- G—PHYSICS
- G01—MEASURING; TESTING
- G01N—INVESTIGATING OR ANALYSING MATERIALS BY DETERMINING THEIR CHEMICAL OR PHYSICAL PROPERTIES
- G01N2800/00—Detection or diagnosis of diseases
- G01N2800/52—Predicting or monitoring the response to treatment, e.g. for selection of therapy based on assay results in personalised medicine; Prognosis
-
- G—PHYSICS
- G01—MEASURING; TESTING
- G01N—INVESTIGATING OR ANALYSING MATERIALS BY DETERMINING THEIR CHEMICAL OR PHYSICAL PROPERTIES
- G01N2800/00—Detection or diagnosis of diseases
- G01N2800/70—Mechanisms involved in disease identification
-
- G—PHYSICS
- G01—MEASURING; TESTING
- G01R—MEASURING ELECTRIC VARIABLES; MEASURING MAGNETIC VARIABLES
- G01R33/00—Arrangements or instruments for measuring magnetic variables
- G01R33/20—Arrangements or instruments for measuring magnetic variables involving magnetic resonance
- G01R33/24—Arrangements or instruments for measuring magnetic variables involving magnetic resonance for measuring direction or magnitude of magnetic fields or magnetic flux
- G01R33/26—Arrangements or instruments for measuring magnetic variables involving magnetic resonance for measuring direction or magnitude of magnetic fields or magnetic flux using optical pumping
Definitions
- the present disclosure relates to use of a quantum sensor to determine metal loading of a molecular metal ligand or metal binding agent. It relates specifically, but not exclusively to use of a quantum sensor in the form of a defect in a semiconductor material (such as a NV defect in diamond) to detect iron loading of a molecule.
- Ferritin is the body’s primary iron storage protein and is found in most cells and numerous extracellular fluids of the body. It is recognised as a critical, robust and routinely used blood based biomarker for assessing iron load.
- the iron load in ferritin can vary widely, from empty up to the theoretical capacity of 4,500 iron atoms per ferritin.
- all references to ‘ferritin’ should be taken to refer to the fully formed 24 subunit protein itself. When discussing the iron that is bound to ferritin, this will be referenced explicitly. In healthy people, serum ferritin levels correlate with total iron load however, under specific diseases or conditions, this relationship is confounded.
- ferritin levels increase in response to inflammation and chronic disease (e.g. diabetes, obesity, renal failure, cardiovascular diseases, alcoholism, various auto-immune disorders and cancer).
- chronic disease e.g. diabetes, obesity, renal failure, cardiovascular diseases, alcoholism, various auto-immune disorders and cancer.
- Other common conditions that cause elevated serum ferritin include metabolic syndrome and fatty liver disease, which affects 40% of Australians over the age of 50. These conditions make iron deficiency or overload difficult to diagnose.
- Alternate methods for assessing body iron storage are either invasive (e.g. liver biopsy) or expensive (MRI).
- FerriScan is an MRI-based method of measuring liver iron concentration. Although it provides an accurate, accessible and safe method of assessing the presence and severity of iron overload, FerriScan is cost prohibitive to many. Consequently, blood tests evaluating serum ferritin levels are primarily used in the diagnosis and management of iron overload, despite these measures of iron load being recognised as suboptimal and problematic.
- the present disclosure provides a method for determining one or more properties of a molecular metal ligand in a sample, comprising the steps of: providing a quantum sensor; exposing the quantum sensor to the sample; applying an illumination signal to the quantum sensor for a first predetermined duration; and detecting a photoluminescence intensity emitted from the quantum sensor; wherein a characteristic of the detected photoluminescence intensity is indicative of one of the properties of the molecular metal ligand in the sample.
- the applied illumination signal comprises optical illumination having a wavelength in a range of about 415 nm to about 630 nm, preferably about 480 nm to about 560 nm and more preferably about 532 nm.
- the applied illumination signal may comprise a pulsed signal having an excitation phase of about 200 ns to about 100 ps, preferably about 2 ps to about 20 ps and more preferably about 5 ps. Typically, this is followed by an interaction time during which excited electron spins have time to recover before the next illumination pulse is applied.
- the interaction time between excitation phases may range from about 12 ns to about 10 ms.
- the photoluminescence intensity is detected at one or more wavelengths in a range of about 620 nm to about 850 nm, preferably between about 637 nm to about 800 nm.
- the detected photoluminescence intensity is ideally measured during an excitation phase of the illumination signal applied to the quantum sensor.
- the method comprises the step of measuring rate of decay of the detected photoluminescence intensity, wherein the rate of decay (1 /Ti) indicates a property of the sample corresponding to loading factor of the molecular metal ligand.
- the method comprises the step of comparing the measured rate of decay of the detected photoluminescence intensity with a background rate of decay measured from the quantum sensor when the illumination signal is applied in the absence of the sample.
- the method may be deployed using a broad range of molecular metalligands or metal binding molecules such as but not limited to metalloproteins, metalchelating agents and other metal-binding agents. It may be preferred that these molecules have a superparamagnetic core.
- the metalloprotein is ferritin and the determined property may be loading factor which is indicative of iron bound to ferritin in the sample.
- the property is loading factor, which is indicative of an extent of loading of a metal or metalloenzyme within the molecular metal ligand or metal binding molecule.
- the metals may include but are not limited to e.g. vanadium, manganese, iron, cobalt, nickel, copper, gadolinium, and cadmium.
- the quantum sensor may comprise an addressable spin defect in a semiconductor material.
- the spin defect is a nitrogen-vacancy (NV) defect that has been engineered in the semiconductor material.
- the semiconductor material may be provided in any suitable form such as, but not limited to: a single bulk semiconductor chip, a two-dimensional semiconductor layer, and low dimensional semiconductor nano particles, to name a few.
- the semiconductor comprises an engineered diamond and may be produced via a range of processes such as e.g. chemical vapour deposition (CVD) or high-pressure-high- temperature (HPHT) processes although other semiconductor materials such as silicon carbide are also contemplated.
- CVD chemical vapour deposition
- HPHT high-pressure-high- temperature
- the quantum sensor comprises a semiconductor material
- the quantum sensor may comprise one or both of:
- NV defects at a density of from about 0.001 to about 500 parts-per-million relative to the semiconductor site density, preferably about 1 part-per-million;
- NV defects located less than about 100 nm, preferably less than about 20 nm, more preferably less than about 10 nm from the semiconductor material surface.
- the quantum sensor may comprise a plurality of quantum sensor elements, wherein exposing the quantum sensor elements to the sample comprises providing the quantum sensor elements in suspension within a fluid comprising the sample.
- the plurality of quantum sensor elements may have a range of different geometries and may be homogenous or heterogeneous in the geometry types across the plurality of quantum sensor elements. Some geometries comprise e.g. randomly shaped chunks, and non-random geometrical shapes such as cubes and other polyhedrons, spheres, discs and single crystal elements. In some embodiments, spheres and discs may be preferred for sensitivity and consistency of measurements.
- the plurality of quantum sensor elements may each have a diameter of between about 20 nm and about 500 nm, preferably between about 50 nm and about 200 nm.
- the sample may be any sample of interest such as an industrial sample or a biological sample.
- the sample is a fluid sample such as a biological fluid sample.
- biological fluid samples may include but are not limited to: blood, blood serum, blood plasma, cerebrospinal fluid, urine, saliva, pericardial fluid, pleural fluid, synovial fluid, amniotic fluid, seminal fluid, sweat and tears.
- the method comprises one or more steps for preparing a fluid sample, such as the biological fluid sample, by performing one or more of centrifuging the fluid, heating the fluid, passing the fluid through a liquid chromatograph or selective membrane, modifying pH and performing immuno or affinity capture to simplify the fluid for determining properties of one or more target species within the biological fluid sample.
- the photoluminescence intensity may be detected using a CCD (charge-coupled device) or a complementary metal oxide semiconductor (sCMOS).
- the detected photoluminescence intensity may convey information about uniformity of the sample with respect to the quantum sensor, particularly when the quantum sensor includes a single bulk semiconductor chip.
- the photoluminescence intensity may detected using a photodiode such as e.g. a silicon photodiode or an avalanche photodiode.
- the present disclosure provides for use of the method according to the above aspect in an apparatus, system or protocol for diagnosing one or more of iron deficiency, iron deficiency anaemia, iron overload (including but not limited to hereditary haemochromatosis and transfusional iron overload) and inflammation.
- Such use of the system may comprise determining iron load in ferritin.
- the present disclosure provides for use of the above method in a system or apparatus for guiding management and/or treatment of one or more of iron deficiency, iron deficiency anaemia, iron overload (including but not limited to hereditary haemochromatosis and transfusional iron overload) and clinically diagnosed inflammation.
- the present disclosure provides a system for detecting one or more properties of a molecular metal ligand in a sample, the system comprising:
- a controller configured to control operation of the illumination source to deliver pulsed illumination; wherein a characteristic of the detected photoluminescence is indicative of one of the properties of the molecular metal ligand in the sample.
- the controller controls operation of the illumination source to deliver pulses of illumination having a duration of about 200 ns to about 100 ps, preferably about 2 ps to about 20 ps and more preferably about 5 ps.
- the controller controls operation of the illumination source to space pulses of illumination by a time duration from about 12 ns to about 10 ms.
- the illumination signal may comprise a sequence of pulses of illumination of equal duration, or the signal may provide a first sequence of pulses of equal duration followed by a second sequence of pulses of different equal duration.
- the controller may control operation of the illumination source to divert a beam path away from the quantum sensor between pulses of illumination. Alternati vely/additionally the controller may control operation of the illumination source to extinguish illumination between pulses of illumination. [0031] In some embodiments, the controller controls operation of the detector to detect photoluminescence intensity during an excitation phase of the pulsed illumination.
- the controller includes or is in operable communication with a processor configured to determine rate of decay (1 /Ti) of the detected photoluminescence intensity, wherein the determined rate of decay indicates a property of the sample corresponding to loading factor of the molecular metal ligand.
- the processor may be configured to compare the measured rate of decay with a background rate of decay measured from the quantum sensor when the illumination signal is applied in the absence of the sample.
- the processor may be configured to determine automatically, from a mathematical model, calibration curve or lookup table stored in memory associated with the processor, loading factor for the molecular metal ligand, wherein the calibration curve or lookup table associates values of rate of decay with values for loading factor.
- the mathematical model may represent a plurality of physical properties of the molecular metal ligand. In other embodiments, the mathematical model may approximate a relationship between values of rate of decay and loading factor in experimental data obtained from one or more samples of the molecular metal ligand.
- the processor may be configured to: receive or determine a value representing concentration of the molecular metal ligand in the sample; and determine automatically a concentration of a target species within the sample by multiplying a value representing the loading factor with the value representing the concentration of the molecular metal ligand.
- the illumination source is configured to emit illumination at one or more wavelengths in a range of about 415 nm to about 630 nm, preferably in a range of about 480 nm to about 560 nm, and more preferably about 532 nm.
- the quantum sensor comprises an addressable spin defect in a semiconductor material.
- the semiconductor material may comprise a diamond which may be produced via any suitable method such as chemical vapour deposition (CVD) or high-pressure-high-temperature (HPHT) processes although other semiconductor materials such as silicon carbide are also contemplated.
- CVD chemical vapour deposition
- HPHT high-pressure-high-temperature
- the spin defect is a nitrogen-vacancy (NV) defect that has been engineered in the semiconductor material.
- NV nitrogen-vacancy
- the quantum sensor may comprise a plurality of quantum sensor elements, and the system may include a vessel for providing the quantum sensor elements in suspension within a fluid comprising the sample.
- the plurality of quantum sensor elements may have a range of different geometries and may be homogenous or heterogeneous in the geometry types across the plurality of quantum sensor elements. Some geometries comprise e.g. randomly shaped chunks, and non-random geometrical shapes such as cubes and other polyhedrons, spheres, discs and single crystal elements. In some embodiments, spheres and discs may be preferred for sensitivity and consistency of measurements. In some embodiments, the plurality of quantum sensor elements may each have a diameter of between about 20 nm and about 500 nm, preferably between about 50 nm and about 200 nm.
- the sample may be any sample of interest such as an industrial sample or a biological sample.
- the sample is a fluid sample such as a biological fluid sample.
- biological fluid samples may include but are not limited to: blood, blood serum, blood plasma, cerebrospinal fluid, urine, saliva, pericardial fluid, pleural fluid, synovial fluid, amniotic fluid, seminal fluid, sweat and tears.
- the detector comprises one or more of a charge- coupled device (CCD), a complementary metal-oxide-semiconductor (CMOS) sensor, and a photodiode such as a silicon photodiode or an avalanche photodiode.
- CCD charge- coupled device
- CMOS complementary metal-oxide-semiconductor
- photodiode such as a silicon photodiode or an avalanche photodiode.
- the quantum sensor, the illumination source and the detector are contained in an optically sealed housing that prevents incursion of light from outside the housing while in use.
- Figure 1 is a flow chart illustrating steps in a method of determining one or more properties of a molecular metal ligand or metal binding agent according to an embodiment of the disclosure
- Figure 2 is a schematic illustration representing a pulse sequence of the illumination signal according to an embodiment of the disclosure.
- Figure 3 represents a typical spin lattice relaxation (T 1 ) measurement curve taken from an ensemble of nitrogen vacancy (NV) centres in diamond.
- Figure 4A is schematic illustration of a system for detecting one or more properties of a molecular metal ligand using a single crystal diamond quantum sensor according to an embodiment of the disclosure.
- Figure 4B is a schematic illustration of a system for detecting one or more properties of a molecular metal ligand using a quantum sensor according to another embodiment of the disclosure utilizing an ensemble of quantum sensor elements.
- Figure 5 is a schematic illustration showing the NV defect in diamond.
- Figure 6 represents the energy level scheme of the Csv-symmetric NV defect in diamond.
- Figure 7 is a plot depicting spectroscopic aspects of the quantum sensing technique according to embodiments of the disclosure.
- Figure 8 is a dynamic light scattering measurement of 100 nm nanodiamond suspension.
- Figure 9 shows schematically the rapid magnetisation reversal of the super-paramagnetic ferritin core in a liquid sample of serum ferritin.
- Figure 10 shows simulations of the spatial distributions of ferritins on the diamond surface and NV centres throughout the nanodiamond. The shading represents the resulting relaxation times (T1 ) of the NV spins for 50 nm, 100 nm and 200 nm spherical nano sensing elements (nanodiamonds).
- Figure 11 shows schematically, interaction between ferritin and a quantum sensor according to an embodiment of the disclosure.
- Figure 12 shows the change in relaxation rate T1 for samples containing ferritin with variable iron load after 4 hours of interaction, where solid line A represents data fitted using a composite model, tight dash line B represents contributions from ferritin containing multiple subcores and wide dash line C represents ferritin containing single cores only.
- Figure 13 is a probability distribution of ferritin containing single cores (S) and multiple subcores (M) as a function of iron load.
- Figure 14 represents various values for T 1 and iron load for a number of nucleation sites Nc within each ferritin.
- Figure 15 shows a curve D that has been fit using a 5 th order polynomial to the data in Figure 12 for a region of interest.
- a flow chart shows steps in a method 100 of determining one or more properties of a molecular metal ligand or metal binding agent according to an embodiment of the disclosure.
- a quantum sensor is provided and in a step 102, the quantum sensor is exposed to the sample. Exposing the quantum sensor to the sample may involve bringing the sensor into sufficiently close proximity to or making contact with the sample (or vice versa) to permit interaction between the molecule and the quantum sensor which is measurable using the techniques disclosed herein.
- an illumination signal is applied to the quantum sensor for a predetermined duration. Typically, the illumination signal is a pulsed signal.
- a photoluminescence intensity emitted from the quantum sensor is detected which is indicative of one of the properties of the molecular metal ligand in the sample.
- the molecular metal ligand is a metalloprotein such as ferritin which the body’s main iron store.
- concentration of ferritin in the blood may provide an indirect correlation of iron stores in healthy individuals, chronic diseases and acute inflammation are known to increase ferritin concentration in the blood but not necessarily the quantity of ferritin-bound iron. Therefore, in preferred embodiments, the property of interest is the loading factor of iron atoms present in ferritin since it is the iron load of ferritin in the body that is determinative of iron stores.
- Loading factor may be expressed in numerous terms which provide a representation of the amount of iron bound to ferritin within the sample.
- loading factor may be expressed as an absolute number of bound iron atoms, or a percentage or other qualitative expression corresponding to the binding capacity occupied by iron e.g. where 0% loading factor corresponds to zero bound iron and 100% loading factor corresponds to a maximum load of -4500 iron atoms per ferritin.
- the loading factor is a qualitative term used to convey the extent of saturation of the ferritin with iron, for instance the loading factor may be indicated as “low” and at risk for iron deficiency, “normal” or “high” and at risk for iron overload, and these terms may be indicated when the loading factor determined for a sample falls within certain predetermined ranges.
- the ranges for qualitative expression of loading factor may be determined based on a population of individuals having a broad range of traits (such as e.g. known medical or hereditary conditions, lifestyle indicators, age or the like), or based on a subset of individuals having particular traits and/or diagnosed conditions known to affect iron loading.
- the ranges may be personalised, recognising that a loading factor which may be too high or low to fall within the “normal” range for some populations may be “normal” for some individuals or populations of individuals.
- the present disclosure is not to be limited to the determination of iron load in ferritin, and that the method may be used to determine loading factor of other metals (or metalloenzymes) that may be bound to the molecular metal ligand or other metal binding agent contained within the sample.
- the quantum sensor may comprise a single or ensemble of engineered defects in a semiconductor material.
- the engineered defects include NV centres in diamond.
- the quantum sensor may be comprised of engineered defects in a single bulk semiconductor chip or engineered defects in small sensor elements each having one or multiple defects.
- a disposable quantum sensor may be preferred.
- preferred embodiments of the present disclosure may utilise an ensemble of small NV diamond quantum sensor elements (hereinafter nanodiamonds) that can be put into suspension within a sample fluid prior to illumination.
- nanodiamonds provides a larger surface area for attachment of ferritin (and/or metal ligand and/or metal binding molecule) improving measurement sensitivity in some embodiments by up to 8 or 9 orders of magnitude compared to other electron spin based approaches such as MRI.
- the illumination signal is pulsed to control the initialisation and readout of NV centres.
- the duration of pulses may be from 200 ns to about 100 ps, preferably about 2 to 20 ps and more preferably about 5 ps to balance readout noise and efficient initialisation of NV centres.
- the measurement involves optical polarization into the
- the middle row of pulses (labelled “detection”) represent the time intervals over which the photoluminescence intensity signal is measured.
- the sequence is completed by reapplication of the polarizing illumination (second pulse in the polarization/illumination signal) which acts as both a readout method (causing photoluminescence which is indicative of the NV spin state) and repolarizing the system for the next measurement. This process is repeated some N M times (with a practical range of 1 ⁇ /V M ⁇ 10 7 , but typically /V M ⁇ 10 5 ) in order to increase the signal to noise ratio of the measurement.
- the effect of the target species is inferred by measurement of the deviation of the NV quantum state from its initial state during their interaction.
- Possible approaches to quantifying this relaxation time include measuring the free-induction decay time (typically denoted T 2 ); the relaxation time in a Rabi experiment (typically denoted T 2 R ); the relaxation time under pulsed microwave dynamical decoupling protocols (including but not limited to spin-echo and Carr-Purcell-Meiboom-Gill (CPMG) multiple microwave pulse sequence), or X-Y spin relaxation time (typically denoted T2 or T 2 ); or the longitudinal spin relaxation time (typically denoted T1 or T- .
- Figure 3 shows a typical T1 measurement curve, taken from an ensemble of NV centres. It is characterised by an exponential decay in photoluminescence (normalised) due to the loss of polarisation brought about by environmental spin noise. T1 curves may be obtained using the pulse sequence of Figure 2. During free evolution time (also referred to as the interaction time) T, the NV centre experiences longitudinal relaxation.
- illumination pulses of a duration of between 200 ns and 100 ps are sufficient to re-polarise NV ensembles within a sensing volume of 2.5 x 10 -3 mm 2 and incident optical power intensity at 532 nm of 240 W/mm 2 .
- a background signal which can be used to remove background noise from the measurement. This may be achieved by applying the measurement sequence to the quantum sensor in the absence of the sample and determining the corresponding background rate of decay. The measured rate of decay of the photoluminescence signal obtained from the quantum sensor in the presence of the sample can then be compared with the background rate of decay to determine the effects that are attributable to the sample. In some embodiments, the background rate of decay is subtracted from the rate of decay of the photoluminescence obtained in the presence of the sample to remove background contribution.
- ferritin is a very stable protein that has been found to be unaffected by heat treatments that denature the majority of serum proteins. The iron content also remains undisturbed. Therefore heating the sample to between about 65 °C and about 85 °C, preferably to about 70 °C, may assist with assessment of the sample.
- a subsequent centrifugation step could be utilised to pellet the insoluble protein aggregates leaving the soluble ferritin in solution, which can then proceed to detection and analysis utilizing the quantum sensor.
- Other options for sample preparation include passing a liquid sample through a liquid chromatograph or a selective membrane, modifying pH and performing immuno or affinity capture to simplify the fluid.
- the applied illumination signal has a wavelength in a range of about 415 nm to about 630 nm, preferably 480 nm to about 560 nm and usually about 532 nm which conveniently corresponds to commercial green laser and LED light sources.
- ZPL zero phonon line
- the photoluminescence intensity may be detected using any suitable means. In some embodiments, this may include use of a sensitive CCD camera preferably a scientific complementary metal oxide semiconductor (sCMOS). Use of a CMOS detector in the case of a quantum sensor comprising a single crystal quantum sensor (as opposed to a plurality of nanodiamond quantum sensor elements) may have additional utility in ascertaining uniformity of the biological sample with respect to the quantum sensor. In some embodiments, the photoluminescence intensity may be detected using one or more photodiodes such as a silicon or avalanche photodiode.
- Figure 4A is schematic illustration of a system 500 for detecting one or more properties of a molecular metal ligand 510 (e.g.
- ferritin in a sample 502.
- the sample 502 is applied to or contacted with a quantum sensor 505 comprising a single diamond substrate 504 containing a plurality of NV defects 503.
- An illumination source 520 applies an illumination signal 521 (ideally green light in the visible spectrum e.g. at about 532 nm) to the quantum sensor 505 with the sample 502 and a detector 530 (e.g. a CMOS or photodiode) detects the photoluminescence intensity emitted from the quantum sensor.
- the detector 530 detects red light in the visible spectrum, ideally between about 650 nm and about 800 nm.
- a lens 550 may focus the illumination signal 521 on the sample 502 and, a mirror or bandpass filter 555 may be used to direct the emitted photoluminescence 531 to detector 530.
- a controller 540 controls operation of the illumination source 520 to deliver pulsed illumination e.g. having the pulse sequence of Figure 2.
- a characteristic such as rate of decay of the detected photoluminescence 531 is indicative of one of the properties of the molecular metal ligand 510 in the sample 502. The characteristic may be presented on a user interface which may comprise a visual display device or monitor 560 and optional keyboard 565 for a user to enter details about the sample such as concentration of the target molecule.
- controller 540 controls operation of the illumination source 520 to deliver pulses of illumination having an excitation phase of about 200 ns to about 100 ps, preferably about 2 ps to about 20 ps and more and preferably about 5 ps, e.g. for a sensing volume of 2.5 x 10 -3 mm 2 and incident optical power intensity at 532 nm at 240 W/mm 2 .
- controller 540 controls the illumination source 520 so that pulses are separated by variable time durations from about 12 ns to about 10 ms. This may be achieved e.g. by the controller 540 causing the beam path of the illumination signal 521 to be diverted away (or obscured) from the quantum sensor 505.
- controller 540 may cause emissions from the illumination source 520 to be extinguished between excitation pulses.
- AOM acousto-optic modulator
- controller 540 may cause emissions from the illumination source 520 to be extinguished between excitation pulses.
- controller 540 controls operation of the detector 530 to detect a photoluminescence intensity during an excitation phase of the pulsed illumination signal 521 .
- the controller may receive a photoluminescence intensity signal detected only during excitation phases, or the controller may receive a continuous photoluminescence intensity signal and utilize the control signal used to control the illumination source 520 to select only the detected photoluminescence intensity signal segments that corresponds to excitation phases of the pulsed illumination signal.
- controller 540 includes a processor configured to determine a rate of decay of the detected photoluminescence intensity, wherein the determined rate of decay indicates a property of the sample 502 corresponding to loading factor of the molecular metal ligand 510 (e.g. ferritin).
- the processor is configured to compare the measured rate of decay with a background rate of decay measured from the quantum sensor 505 when the illumination signal is applied in the absence of the sample to eliminate background signal not attributable to interaction between the molecular metal ligand and the quantum sensor.
- the processor is configured to determine automatically, from a function or lookup table stored in memory associated with the processor of the controller 540, loading factor for the molecular metal ligand, wherein the function or lookup table associates values of rate of decay with values for loading factor.
- the function (such as a calibration curve) or lookup table may be based on defined standards or data obtained from previously measured samples. Suitable approaches for defining functions used to determine loading factor from T1 values are described herein and include i) using a physical model that describes how the magnetic behaviour evolves as a function of loading factor, and ii) using a non-physical model such as a mathematical model which may be determined by fitting a curve to experimental data.
- Curve fitting may be achieved by manual approximation or by use of curve-fitting software or algorithms as are known by those skilled in the art.
- the values of the loading factor can then be presented to the user e.g. on monitor 560 or in a report generated by the controller 540 and transmitted by conventional means (including e.g. computer networks) to other devices.
- FIG. 4B a schematic illustration of a system 500 for detecting one or more properties of a molecular metal ligand 510 (e.g. ferritin) in a sample 502.
- a molecular metal ligand 510 e.g. ferritin
- a second lens 532 may be provided to focus the emitted photoluminescence on the detector 530.
- the system may include other optical elements such as filters, lenses, polarisers and reflectors to enhance operation of the system as would be understood by one of skill in the art.
- the quantum sensor is provided in the form of a plurality of quantum sensor elements 505 in a suspension with the liquid sample 502 contained within a vessel 570. Use of a bulk ensemble of quantum sensor elements 505 increases the available surface area for ferritin attachment and hence measurement sensitivity.
- Embodiments of present disclosure provide techniques, embodied in the form of a method and system, for clinical quantification of loading factor within a molecular metal ligand or other metal binding agent using a new assaying technique that uses optical excitation and measurement to determine a change in the behaviour of the quantum sensor due to the properties of the molecular metal ligand in the sample.
- the optical technique exploits the different photoluminescence intensities emitted by atomic defects in the quantum sensors when illuminated, to determine the spin state.
- the rate of decay of the photoluminescence signal can then be used to determine the change in relaxation time induced by e.g. the presence of iron in the ferritin core, and the magnitude of the change is indicative of the quantity of iron bound within the molecule.
- the rate of decay may be used to provide a measure of the change in relaxation time of electron spins (Ti) in the quantum sensor in the presence of a metal, metalloprotein, metal-molecular complex or metal ligand.
- the invention utilises principals of physics also used in magnetic resonance imaging (MRI)
- the sensitivity of traditional MRI methods such as FerriScan is limited by the large standoff distance of the magnetic pick up coils.
- the present disclosure provides an approach which can achieve considerably greater sensitivity by utilising quantum sensors/quantum sensor elements having NV defects manufactured within the diamond at a location that is much closer to the sample being analysed.
- the sensing defects can be engineered less than 10 nm from the surface of the diamond, making the quantum sensor up to nine orders of magnitude more sensitive than traditional MRI. This enables testing on small, low concentration samples such as blood serum.
- Embodiments of the present disclosure may be capable of measuring ferritin bound iron at physiologically relevant concentrations as low as or less than 30 ng/ml, thus enabling a clinical assay for direct detection of iron load in serum ferritin and other body fluids. It is to be understood that in addition to detecting properties in liquid samples, other samples including tissue homogenates and/or extracts could also be used particularly if capable of being prepared into a liquid form for testing.
- Figure 5 is a schematic illustration showing the nitrogen-vacancy (NV) centre point defect in diamond, comprised of a substitutional nitrogen atom (N) and an adjacent crystallographic vacancy (V). Blank spheres represent carbon atoms.
- NV nitrogen-vacancy
- Blank spheres represent carbon atoms.
- This structure forms the basis of the material platform utilised for the quantum sensor of this disclosure.
- the NV diamond quantum sensor exhibits a beneficial combination of spin-state controllability, quantum state robustness, and room temperature operation.
- the energy level scheme of the Csv-symmetric NV system is represented in Figure 6. It consists of ground ( 3 A2), excited ( 3 E) and singlet electronic states.
- the ground-state spin-1 manifold has three spin sublevels (
- ⁇ 1», which at zero-field are split by D 2.87 GHz. Since these sublevels have different photoluminescence intensities upon illumination, it is possible to determine spin-state by optical measurement. For example, upon optical excitation at 532 nm, the population of the
- Figure 7 is a plot depicting the spectroscopic aspects of this technique.
- the NV filter function (solid black line) isolated the regions of the ferritin spectrum (grey) that are close to the NV spin transition frequency.
- the NV filter can be shifted (broken line) by tuning the strength of an applied external magnetic field, which generally allows for species exhibiting narrow spectral features to be resonantly targeted. It is to be noted however, that such an approach is not needed for the case of ferritin, owing to the ⁇ 10 GHz width spectrum, which is at least four orders of magnitude greater than that of the filter function.
- NV T1 is defined as the evolution time at which the population of the ground state
- This approach can be more sensitive because NV T1 times can be up to three orders of magnitude longer than spin-echo-based T2 times.
- transitions in the ground-state spin triplet manifold are far off-resonance from the MHz transition frequencies of the chief magnetic defects in diamond (nitrogen electron-donor defects, referred to hereafter as P1 centres, and 13 C nuclei), leaving NV transitions unable to be excited unless brought into resonance using an axial magnetic field (B o ⁇ 512 G for an electron spin).
- Diamonds with a long intrinsic T 1 time are preferred since changes to this value (e.g. due to the presence of ferritin) will be easier to measure.
- an easily detectable signal can be achieved by the techniques disclosed herein utilizing a quantum sensor comprising a type 1 b, Ila or CVD diamond in some embodiments, particularly those utilising a single bulk diamond semiconductor chip.
- Type lb diamonds are considerably cheaper than electronic grade type Ila diamonds which are commonly preferred for analytical applications. Viability of type 1 b diamond for sensing purposes according to embodiments of the present disclosure represents a significant cost advantage that may support widespread uptake e.g. in routine laboratory testing.
- the property e.g. loading factor
- the associated fluctuations are so rapid that the applied illumination signal is able to excite the NV ground state spin transitions even at zero magnetic field (as detailed below). This allows the quantum sensor to maintain a definitive insensitivity to other paramagnetic defects that may reside near or on the diamond, thus ensuring that the detected signal originates from ferritin exclusively.
- both NV transitions At zero- magnetic field, both NV transitions,
- Figure 9 shows schematically the rapid magnetisation reversal (at 901 ) of the super- paramagnetic ferritin core in a liquid sample of serum ferritin 902 producing a randomly fluctuating radio frequency (RF) signal whose amplitude is determined according to the iron atoms per ferritin.
- RF radio frequency
- the system in use comprises many NVs and many ferritins.
- the response of j th NV spin will thus be the result of the effective field due to all ferritin cores to which it is coupled, and the resulting signal will be comprised of a distribution of frequencies, referred to hereafter as its spectral distribution, S(ry), which is essentially just a probability distribution for co.
- S(ry) spectral distribution
- the NV ensemble will exhibit a distribution of coupling strengths to their proximate ferritin cores. Moreover, the loading factor will also exhibit some variation over the sample. As such, the total measured signal from all NVs present will depend on these distributions.
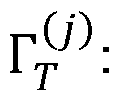
- the full photoluminescent (PL) response for many NVs is a summation over all j individual NV signals present in the ensemble, each having optical contrast Cj and relaxation rate where 77(f) is a stochastic signal describing the shot noise statistics associated with the PL measurement.
- 77(f) is a stochastic signal describing the shot noise statistics associated with the PL measurement.
- summation over all NVs may be decomposed into a sum over the NVs in each nanodiamond, 1 ⁇ j ⁇ each having optical contrast y and polarisation efficiency p , followed by a sum over all nanodiamonds, 1 ⁇ m ⁇ /V ND , in the ensemble:
- a PL measurement is performed on the nanodiamond ensemble prior to contacting the sample to obtain a background (BG) signal:
- /V ND is the total number of nanodiamonds in the ensemble
- ND and ⁇ J ND are the mean and standard deviations associated with an individual nanodiamond, as obtained from their size, shape, and NV and ferritin location distributions
- the iron core of ferritin represents a superparamagnetic particle that reverses the direction of its magnetisation back and forth along a single axis (referred to as its easy axis) after exponentially distributed waiting times, At, as defined by the average weighting time, T fl ip in the following autocorrelation function, (Eq. 12) where the At are the realisations of the times between reversal events, and T fl ip is the mean time between these events.
- the average wait times are defined by the volume V, anisotropy K, and temperature T, of the iron core, as given by the Neel relaxation time: [0107] Assuming the core to be comprised of ferrihydrite, these parameters are known to be:
- T o 10 -12 S
- Tis the temperature and kb is Boltzmann’s constant.
- the volume of the core can be related directly to the loading factor, LF, and the density of ferrihydrite:
- the effective magnetic field B from the ferritin core can be also be written in terms of the LF. As it is the longitudinal spin dynamics of the ferritin that excite the NV transition, it is the x - z and y - z NV-Fe components of their magnetic dipole coupling tensor that are of interest: D2 _ D 2 “xz + By z , (Eq. 17)
- the quantum sensor may comprise many small diamond elements, each containing one or more NV defects and these elements, referred to as nanodiamonds, may have a variety of geometries including spheres, discs, cubes and other shapes, with NV defects manufactured into them at various locations within the diamond element.
- These variations in sensor geometry and fabrication can affect performance of the quantum sensor as outlined in the following statistical analysis which is focused on a nanodiamond ensemble of sufficient total area to bind all ferritin in the sample while minimising measurement noise associated with NV centres not coupled to any magnetic signal arising from a ferritin.
- Particle size distributions generated by grinding, milling and crushing operations are typically represented by the Weibull distribution: fc /Rx*- 1 (E - 22)
- This distribution may be easily evaluated noting that between 10 6 and 10 10 nanodiamonds are required to measure loading factor for 1 mL blood sample at physiological levels, meaning that / 3 (/V s total ) will be well approximated by a normal distribution with mean and spread where the first and second moments of the average number of binding sites per nanodiamond may be determined from for some given shape distribution, as discussed below. [0118] The required number of nanodiamonds is then given by
- N s is the average number of binding sites per nanodiamond; or average number of ferritin in contact with a nanodiamond during the measurement process.
- performance metrics may be derived for various quantum sensor diamond geometries such as spherical, disc-like and single crystal nanodiamonds.
- Figure 10 shows simulations of the spatial distributions of ferritins on the diamond surface and NV centres throughout the nanodiamond.
- the shading represents the resulting T1 relaxation times of the NV spins for 50 nm, 100 nm and 200 nm spherical nano sensing elements (nanodiamonds), with those closest to the surface of the nanodiamond sphere exhibiting the fastest relaxation rates (where relaxation rate is the inverse of relaxation (T1 ) time).
- the induced relaxation rate of NV- j may be computed explicitly via integration over all ferritin cores on the nanodiamond surface:
- R F is the effective separation distance of the ferritin above the nanodiamond surface, resulting from the radius of the ferritin and any additional species present (e.g. due to glycosylation reaction and similar effects).
- a single crystal diamond sensor presents a somewhat complementary case to those considered above although variations in geometry are of less concern than the distribution of NV centres throughout the crystal.
- NV centres are distributed within a semi-localised plane in close proximity to the surface of the diamond crystal (less than 100 nm).
- ferritin has adsorbed with high density onto the diamond surface, such that the NV-NV distance is much less than the NV-ferritin distance, the ferritin contribution can be considered as continuous and the NV centres can be approximated as a 2D plane with separation H, from the layer of NV centres.
- the induced relaxation rate of the NV ensemble may be computed explicitly as:
- NV quantum sensors in various forms
- the preceding theoretical and analytical analysis explaining the performance of NV quantum sensors is based on the behaviour of the NV defect/s in the quantum sensor in the presence of a molecular metal ligand or metal binding agent. Described in simple terms, the paramagnetic NV centre has a spin 1 ground and excited state which can be used to detect fluctuating, oscillating and DC magnetic fields depending on the quantum protocol employed.
- FIG. 11 An example of the sensing configuration is shown in Figure 11 which shows schematically the interaction between ferritin 510 and the quantum sensor 505.
- the adsorbed high-density layer of ferritin starts at a distance H from the NV layer, corresponding to the situation described by Equation 31 .
- Figure 12 shows the change in Ti relaxation rate for samples containing ferritin with variable iron load after 4 hours of interaction. This data is clearly nonmonotonic between iron loads of approximately 100-550 iron atoms/ferritin.
- Equation 31 Under the assumption that ferritin has a single iron core which grows with the number of Fe atoms, the change in Ti relaxation rate can be described by Equation 31 .
- the measured data reveals deviations from this expression which implies the single core assumption is not valid over the entire iron load range 0-4500 Fe atoms. It is understood by the inventors that for low iron loads multiple iron subcores can exist within a single ferritin. This has been proposed in previous studies utilising high-resolution electron microscopy however due to the absence of suitable technology, there has been no prior measurement of magnetic properties, as a function of iron load, to reveal this behaviour. The presence of multiple subcores will modify the strength of the fluctuating magnetic signal produced by ferrtin as it loads.
- Equation 17 the factor a in Equation 17 is modified to be:
- the Solid line A in Figure 12 represents data fitted using the above composite model (physical model) corresponding to Eq. 36, the tight dash line B estimates contributions from ferritin containing multiple subcores only and wide dash line C estimates ferritin containing single cores only.
- the discontinuity between samples containing between 212 and 591 Fe/ferritin is well reproduced by the composite model (curve A).
- the morphological change that occurs is represented diagrammatically above the plot of Figure 12. For low iron loads (region I) the signal is dominated by ferritin containing multiple subcores, while for high iron loads (region III) the signal is dominated by ferritin containing a single core particle. Transition region II indicates iron loads for which there are a combination of these two modalities.
- Figure 13 is a probability distribution of ferritin containing single cores (S) and multiple cores (M) as a function of iron load.
- S single cores
- M multiple cores
- the point at which single cores dominate over multiple cores occurs at an iron load designated L c .
- the transition between the contributions to the magnetic signal corresponding to region I and region II occurs at approx. 400 Fe/ferritin and explains the “hump” in the data.
- physiological ferritin samples are traditionally less than 25% loaded (i.e. 900 Fe/ferritin on Figure 12) thus the relationship identified according to curve A can be utilised to infer iron load in ferritin serum samples.
- Ferritin is a hollow globular protein consisting of 24 subunits of two types. Its make-up is such that the iron core is in general thought to nucleate at sites on one of the subunit types, resulting in one to twenty-four nucleation sites per ferritin molecule. This morphological property results in a non-linear relationship between the measured Ti relaxation rate from the NV defects in the quantum sensor and the iron load of the ferritin molecules. It is envisaged that this non-monotonic behaviour will be present regardless of ferritin origin, whether that be from different tissues or species.
- Management of iron overload is generally by venesection, with the protein content of serum ferritin being used to monitor the condition and determine the frequency of treatment (perhaps once a week for 12 months or more).
- a more accurate, direct measurement of iron load would transform management of hemochromatosis, avoiding venesection (and causing iron deficiency) in patients with high serum ferritin levels but low iron load.
- ferritin iron load may have wide influence on neuronal health, from stroke recovery to stem cell transplantation success and may be a key modulator of Alzheimer’s disease.
- a direct measure of ferritin-iron load according to embodiments of the present disclosure opens up the possibility of exploring the role that in-vivo ferritin-iron plays in neuronal health and regeneration.
- Techniques disclosed herein may complement existing clinical blood tests, including immunochemical tests for ferritin quantification. These techniques offer the potential for advancement in accurate diagnoses and treatment planning since the currently unmet clinical need for diagnosing both positive and negative iron status affects disease susceptibility and is critical for instructing a patient on treatment and management.
- ferritin bound iron could target individuals for genetic testing to efficiently facilitate diagnosis of primary hereditary hemochromatosis, and those with non-specific high-ferritin (apoferritin) can be directed to appropriate disease-specific treatment.
- the techniques disclosed herein set a foundation for rapid, accurate testing of iron load using an inexpensive to manufacture quantum sensor. Unlike FerriScan and other magnetic resonance imaging techniques, the infrastructure for performing the detection is inexpensive with low running costs. The system could be made portable, and even battery operated making it a viable instrument for mobile health screening and deployment in remote locations.
- ESR electron spin relaxation
- the techniques of the present disclosure do not measure relaxation coherence of H2O molecules in the presence of high iron/ferritin concentration. Rather, a specifically engineered quantum sensor having a manufactured defect, ideally an NV defect, is utilised. When exposed to small concentrations of ferritin of different iron load, the spin relaxation time of the NV defect changes and this can be detected optically. This approach offers sensitivity improvements over MRI and is significantly more cost and time effective as a routine assay. Furthermore, the patient is not required to be present for the analysis phase of the test. Rather, a blood sample can be taken relatively quickly and the patient can carry on with other activities while awaiting the results of the analysis.
- ferritin can be used as a cage to store other biomolecules such as magnetite, as a containment vessel for microscopic reactions such as synthesis of iron oxide nanoparticles, or as a delivery vehicle for drugs. Therefore, the techniques disclosed herein which utilize quantum sensing to detect, by optical methods, a change in spin state attributable to the property (such as loading factor) of a molecular metal ligand or metal binding agent have wide and varied potential.
Landscapes
- Health & Medical Sciences (AREA)
- Life Sciences & Earth Sciences (AREA)
- Chemical & Material Sciences (AREA)
- Physics & Mathematics (AREA)
- Engineering & Computer Science (AREA)
- Immunology (AREA)
- General Physics & Mathematics (AREA)
- General Health & Medical Sciences (AREA)
- Pathology (AREA)
- Biochemistry (AREA)
- Analytical Chemistry (AREA)
- Hematology (AREA)
- Molecular Biology (AREA)
- Biomedical Technology (AREA)
- Urology & Nephrology (AREA)
- Medicinal Chemistry (AREA)
- Nuclear Medicine, Radiotherapy & Molecular Imaging (AREA)
- Cell Biology (AREA)
- Microbiology (AREA)
- Biotechnology (AREA)
- Food Science & Technology (AREA)
- High Energy & Nuclear Physics (AREA)
- Nanotechnology (AREA)
- Bioinformatics & Cheminformatics (AREA)
- Chemical Kinetics & Catalysis (AREA)
- Crystallography & Structural Chemistry (AREA)
- Condensed Matter Physics & Semiconductors (AREA)
- Investigating, Analyzing Materials By Fluorescence Or Luminescence (AREA)
Abstract
Description




Claims
Priority Applications (3)
| Application Number | Priority Date | Filing Date | Title |
|---|---|---|---|
| US18/686,805 US20240377328A1 (en) | 2021-08-27 | 2022-08-24 | Determining Properties of Samples Using Quantum Sensing |
| AU2022335155A AU2022335155A1 (en) | 2021-08-27 | 2022-08-24 | Determining properties of samples using quantum sensing |
| EP22859643.3A EP4392174A4 (en) | 2021-08-27 | 2022-08-24 | DETERMINATION OF SAMPLE PROPERTIES USING QUANTUM MEASUREMENT |
Applications Claiming Priority (4)
| Application Number | Priority Date | Filing Date | Title |
|---|---|---|---|
| AU2021902794A AU2021902794A0 (en) | 2021-08-27 | Determining properties of samples using quantum sensing | |
| AU2021902794 | 2021-08-27 | ||
| AU2022901174 | 2022-05-04 | ||
| AU2022901174A AU2022901174A0 (en) | 2022-05-04 | Determining properties of samples using quantum sensing |
Publications (1)
| Publication Number | Publication Date |
|---|---|
| WO2023023756A1 true WO2023023756A1 (en) | 2023-03-02 |
Family
ID=85321358
Family Applications (1)
| Application Number | Title | Priority Date | Filing Date |
|---|---|---|---|
| PCT/AU2022/050983 Ceased WO2023023756A1 (en) | 2021-08-27 | 2022-08-24 | Determining properties of samples using quantum sensing |
Country Status (4)
| Country | Link |
|---|---|
| US (1) | US20240377328A1 (en) |
| EP (1) | EP4392174A4 (en) |
| AU (1) | AU2022335155A1 (en) |
| WO (1) | WO2023023756A1 (en) |
Cited By (2)
| Publication number | Priority date | Publication date | Assignee | Title |
|---|---|---|---|---|
| CN117357072A (en) * | 2023-12-07 | 2024-01-09 | 中国科学技术大学苏州高等研究院 | Breast cancer detection device based on diamond quantum sensor |
| US20240241053A1 (en) * | 2022-12-09 | 2024-07-18 | Endress+Hauser Conducta Gmbh+Co. Kg | Calibration standard, sensor arrangement and use |
Citations (2)
| Publication number | Priority date | Publication date | Assignee | Title |
|---|---|---|---|---|
| US20150377865A1 (en) * | 2014-06-27 | 2015-12-31 | Google Inc. | Method for using nanodiamonds to detect nearby magnetic nanoparticles |
| EP3588117A1 (en) * | 2017-02-21 | 2020-01-01 | Sumitomo Electric Industries, Ltd. | Diamond magnetic sensor |
-
2022
- 2022-08-24 US US18/686,805 patent/US20240377328A1/en active Pending
- 2022-08-24 AU AU2022335155A patent/AU2022335155A1/en active Pending
- 2022-08-24 EP EP22859643.3A patent/EP4392174A4/en active Pending
- 2022-08-24 WO PCT/AU2022/050983 patent/WO2023023756A1/en not_active Ceased
Patent Citations (2)
| Publication number | Priority date | Publication date | Assignee | Title |
|---|---|---|---|---|
| US20150377865A1 (en) * | 2014-06-27 | 2015-12-31 | Google Inc. | Method for using nanodiamonds to detect nearby magnetic nanoparticles |
| EP3588117A1 (en) * | 2017-02-21 | 2020-01-01 | Sumitomo Electric Industries, Ltd. | Diamond magnetic sensor |
Non-Patent Citations (7)
| Title |
|---|
| A. JARMOLA ET AL.: "Temperature- and Magnetic-Field-Dependent Longitudinal Spin Relaxation in Nitrogen-Vacancy Ensembles in Diamond", PHYSICAL REVIEW LETTERS, vol. 108, no. 19, 1 May 2012 (2012-05-01), pages 5 |
| DAVIS, HUNTER COLE: "Mechanistic Insights for Magnetic Imaging and Control of Cellular Function", DISS. CALIFORNIA INSTITUTE OF TECHNOLOGY, 1 January 2020 (2020-01-01), XP093041129, Retrieved from the Internet <URL:https://thesis.library.caltech.edu/11809/1/Davis_HunterC_2019_final.pdf> [retrieved on 20230421] * |
| EIKE OLIVER SCHÄFER-NOLTE, DEVELOPMENT OF A DIAMOND-BASED SCANNING PROBE SPIN SENSOR OPERATING AT LOW TEMPERATURE IN ULTRA HIGH VACUUM, 28 May 2014 (2014-05-28), pages 1 - 145 |
| PENGFEI WANG; SANYOU CHEN; MAOSEN GUO; SHIJIE PENG; MENGQI WANG; MING CHEN; WENCHAO MA; RUI ZHANG; JIHU SU; XING RONG; FAZHAN SHI;: "Nanoscale magnetic resonance imaging of proteins in a single cell", ARXIV.ORG, CORNELL UNIVERSITY LIBRARY, 201 OLIN LIBRARY CORNELL UNIVERSITY ITHACA, NY 14853, 19 February 2020 (2020-02-19), 201 Olin Library Cornell University Ithaca, NY 14853 , XP081602752 * |
| SCHÄFER-NOLTE EIKE ET AL.: "Tracking Temperature-Dependent Relaxation Times of Ferritin Nanomagnets with a Wideband Quantum Spectrometer", PHYSICAL REVIEW LETTERS, vol. 113, no. 21, 1 November 2014 (2014-11-01) |
| See also references of EP4392174A4 |
| ZIEM FLORESTAN C. ET AL.: "Nano Letters", vol. 13, 10 July 2013, AMERICAN CHEMICAL SOCIETY, article "Detection of a Few Metallo-Protein Molecules Using Color Centers in Nanodiamonds", pages: 3305 - 3309 |
Cited By (3)
| Publication number | Priority date | Publication date | Assignee | Title |
|---|---|---|---|---|
| US20240241053A1 (en) * | 2022-12-09 | 2024-07-18 | Endress+Hauser Conducta Gmbh+Co. Kg | Calibration standard, sensor arrangement and use |
| CN117357072A (en) * | 2023-12-07 | 2024-01-09 | 中国科学技术大学苏州高等研究院 | Breast cancer detection device based on diamond quantum sensor |
| CN117357072B (en) * | 2023-12-07 | 2024-03-19 | 中国科学技术大学苏州高等研究院 | Breast cancer detection device based on diamond quantum sensor |
Also Published As
| Publication number | Publication date |
|---|---|
| EP4392174A1 (en) | 2024-07-03 |
| AU2022335155A1 (en) | 2024-04-04 |
| EP4392174A4 (en) | 2025-07-09 |
| US20240377328A1 (en) | 2024-11-14 |
Similar Documents
| Publication | Publication Date | Title |
|---|---|---|
| Levine et al. | Principles and techniques of the quantum diamond microscope | |
| JP7407987B2 (en) | Proteomic assay using quantum sensors | |
| Steele et al. | New applications and perspectives of fast field cycling NMR relaxometry | |
| Felli et al. | Recent progress in NMR spectroscopy: toward the study of intrinsically disordered proteins of increasing size and complexity | |
| Assfalg et al. | The study of transient protein–nanoparticle interactions by solution NMR spectroscopy | |
| Yang et al. | Development of an ultra-high sensitive immunoassay with plasma biomarker for differentiating Parkinson disease dementia from Parkinson disease using antibody functionalized magnetic nanoparticles | |
| Waddington et al. | Phase-encoded hyperpolarized nanodiamond for magnetic resonance imaging | |
| US20240377328A1 (en) | Determining Properties of Samples Using Quantum Sensing | |
| US7432714B2 (en) | Method and device for on-chip magnetic resonance spectroscopy | |
| Kumar et al. | A novel approach to quantify different iron forms in ex-vivo human brain tissue | |
| Bertini et al. | 1H NMRD profiles of diamagnetic proteins: a model‐free analysis | |
| An et al. | Solution NMR methods for structural and thermodynamic investigation of nanoparticle adsorption equilibria | |
| Viereck et al. | Multi-spectral Magnetic Particle Spectroscopy for the investigation of particle mixtures | |
| US10620205B2 (en) | NMR methods for endotoxin analysis | |
| Alcicek et al. | Zero-to low-field relaxometry of chemical and biological fluids | |
| Mignon et al. | Fast, broad-band magnetic resonance spectroscopy with diamond widefield relaxometry | |
| Fujisaku et al. | Machine-Learning optimization of multiple measurement parameters nonlinearly affecting the signal quality | |
| Owusu et al. | R1ρ sensitivity to pH and other compounds at clinically accessible spin‐lock fields in the presence of proteins | |
| Dai et al. | Extending 17O transverse relaxation measurement to satellite transitions as a direct probe of molecular dynamics in solids | |
| Gatteschi | Physical techniques for the investigation of molecular magnetic clusters | |
| Fricke et al. | Estimates of blood plasma water content using portable NMR relaxometry | |
| Vogtherr et al. | NMR-based screening methods for lead discovery | |
| Zeisner et al. | Coherent spin dynamics of solitons in the organic spin chain compounds (o-DMTTF) 2 X (X= Cl, Br) | |
| Geraldes et al. | Comparison of crystal field dependent and independent methods to analyse lanthanide induced NMR shifts in axially symmetric complexes. Part I. Systems with a C3 symmetry axis | |
| Bouvignies et al. | Divided-evolution-based pulse scheme for quantifying exchange processes in proteins: powerful complement to relaxation dispersion experiments |
Legal Events
| Date | Code | Title | Description |
|---|---|---|---|
| 121 | Ep: the epo has been informed by wipo that ep was designated in this application |
Ref document number: 22859643 Country of ref document: EP Kind code of ref document: A1 |
|
| WWE | Wipo information: entry into national phase |
Ref document number: 2022335155 Country of ref document: AU Ref document number: AU2022335155 Country of ref document: AU |
|
| WWE | Wipo information: entry into national phase |
Ref document number: 2022859643 Country of ref document: EP |
|
| NENP | Non-entry into the national phase |
Ref country code: DE |
|
| ENP | Entry into the national phase |
Ref document number: 2022859643 Country of ref document: EP Effective date: 20240327 |
|
| ENP | Entry into the national phase |
Ref document number: 2022335155 Country of ref document: AU Date of ref document: 20220824 Kind code of ref document: A |