WO2023068655A1 - System and method for learning tone curves for local image enhancement - Google Patents
System and method for learning tone curves for local image enhancement Download PDFInfo
- Publication number
- WO2023068655A1 WO2023068655A1 PCT/KR2022/015507 KR2022015507W WO2023068655A1 WO 2023068655 A1 WO2023068655 A1 WO 2023068655A1 KR 2022015507 W KR2022015507 W KR 2022015507W WO 2023068655 A1 WO2023068655 A1 WO 2023068655A1
- Authority
- WO
- WIPO (PCT)
- Prior art keywords
- input image
- tone curve
- image
- tone
- local tone
- Prior art date
- Legal status (The legal status is an assumption and is not a legal conclusion. Google has not performed a legal analysis and makes no representation as to the accuracy of the status listed.)
- Ceased
Links
Images


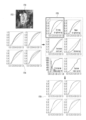

Classifications
-
- G—PHYSICS
- G06—COMPUTING OR CALCULATING; COUNTING
- G06T—IMAGE DATA PROCESSING OR GENERATION, IN GENERAL
- G06T5/00—Image enhancement or restoration
- G06T5/90—Dynamic range modification of images or parts thereof
- G06T5/94—Dynamic range modification of images or parts thereof based on local image properties, e.g. for local contrast enhancement
-
- G—PHYSICS
- G06—COMPUTING OR CALCULATING; COUNTING
- G06T—IMAGE DATA PROCESSING OR GENERATION, IN GENERAL
- G06T7/00—Image analysis
- G06T7/90—Determination of colour characteristics
-
- G—PHYSICS
- G06—COMPUTING OR CALCULATING; COUNTING
- G06T—IMAGE DATA PROCESSING OR GENERATION, IN GENERAL
- G06T11/00—Two-dimensional [2D] image generation
- G06T11/10—Texturing; Colouring; Generation of textures or colours
-
- G—PHYSICS
- G06—COMPUTING OR CALCULATING; COUNTING
- G06T—IMAGE DATA PROCESSING OR GENERATION, IN GENERAL
- G06T5/00—Image enhancement or restoration
- G06T5/20—Image enhancement or restoration using local operators
-
- G—PHYSICS
- G06—COMPUTING OR CALCULATING; COUNTING
- G06T—IMAGE DATA PROCESSING OR GENERATION, IN GENERAL
- G06T5/00—Image enhancement or restoration
- G06T5/60—Image enhancement or restoration using machine learning, e.g. neural networks
-
- G—PHYSICS
- G06—COMPUTING OR CALCULATING; COUNTING
- G06T—IMAGE DATA PROCESSING OR GENERATION, IN GENERAL
- G06T7/00—Image analysis
- G06T7/10—Segmentation; Edge detection
- G06T7/11—Region-based segmentation
-
- G—PHYSICS
- G06—COMPUTING OR CALCULATING; COUNTING
- G06V—IMAGE OR VIDEO RECOGNITION OR UNDERSTANDING
- G06V10/00—Arrangements for image or video recognition or understanding
- G06V10/40—Extraction of image or video features
- G06V10/56—Extraction of image or video features relating to colour
-
- G—PHYSICS
- G06—COMPUTING OR CALCULATING; COUNTING
- G06T—IMAGE DATA PROCESSING OR GENERATION, IN GENERAL
- G06T2207/00—Indexing scheme for image analysis or image enhancement
- G06T2207/10—Image acquisition modality
- G06T2207/10024—Color image
-
- G—PHYSICS
- G06—COMPUTING OR CALCULATING; COUNTING
- G06T—IMAGE DATA PROCESSING OR GENERATION, IN GENERAL
- G06T2207/00—Indexing scheme for image analysis or image enhancement
- G06T2207/20—Special algorithmic details
- G06T2207/20084—Artificial neural networks [ANN]
Definitions
- the disclosure relates to a system, method and device for image enhancement.
- ISPs image signal processors
- Tone mapping is one step in the photo enhancement stages of ISPs and has a major impact on the quality of the final image through enhancing the contrast and color tones of the image.
- a method may include receiving an input image, extracting at least one feature from the input image, determining at least one local tone curve for a portion of the input image based on the extracted at least one feature, the portion of the input image being less than an overall area of the input image, and generating a toned image based on the at least one local tone curve.
- a system may include a memory storing instructions, and a processor configured to execute the instructions to receive an input image, extract at least one feature from the input image, determine at least one local tone curve for a portion of the input image based on the extracted at least one feature, the portion of the input image being less than an overall area of the input image, and generate a toned image based on the at least one local tone curve.
- a non-transitory computer-readable storage medium may store instructions that, when executed by at least one processor, cause the at least one processor to receive an input image, extract at least one feature from the input image, determine at least one local tone curve for a portion of the input image based on the extracted at least one feature, the portion of the input image being less than an overall area of the input image, and generate a toned image based on the at least one local tone curve.
- FIG. 1 is a diagram of devices of a system according to an embodiment
- FIG. 2 is a diagram of components of the devices of FIG. 1 according to an embodiment
- FIG. 3 is a diagram of a tone curve, according to an embodiment
- FIG. 4A is a diagram of a training process, according to an embodiment
- FIG. 4B is a diagram of an inference process, according to an embodiment
- FIG. 5 is a diagram of data pre-processing, according to an embodiment
- FIG. 6 is a diagram of a neural network architecture, according to an embodiment
- FIGs. 7, 8, 9, 10 and 11 are diagrams of tile-based interpolation, according to an embodiment
- FIG. 12 is a diagram of graphs showing tone curve constraints, according to an embodiment
- FIG. 13 is a diagram of a pixel weight map, according to an embodiment
- FIG. 14 is a diagram of an example of averaging tone curves, according to an embodiment
- FIG. 15 is a diagram of an image enhancement process, according to an embodiment
- FIG. 16 is a diagram of an image enhancement process, according to an embodiment
- FIG. 17 is a diagram of interactive editing of tone curves, according to an embodiment.
- FIG. 18 is a flowchart of a method for generating toned images, according to an embodiment.
- FIG. 1 is a diagram of a system according to an embodiment.
- FIG. 1 includes a user device 110, a server device 120, and a network 130.
- the user device 110 and the server device 120 may interconnect via wired connections, wireless connections, or a combination of wired and wireless connections.
- the user device 110 may include a computing device (e.g., a desktop computer, a laptop computer, a tablet computer, a handheld computer, a smart speaker, a server device, etc.), a mobile phone (e.g., a smart phone, a radiotelephone, etc.), a camera device, a wearable device (e.g., a pair of smart glasses or a smart watch), or a similar device.
- a computing device e.g., a desktop computer, a laptop computer, a tablet computer, a handheld computer, a smart speaker, a server device, etc.
- a mobile phone e.g., a smart phone, a radiotelephone, etc.
- a camera device e.g., a camera device, a wearable device (e.g., a pair of smart glasses or a smart watch), or a similar device.
- the server device 120 includes one or more devices.
- the server device 120 may be a server device, a computing device, or the like.
- the network 130 includes one or more wired and/or wireless networks.
- network 130 may include a cellular network (e.g., a fifth generation (5G) network, a long-term evolution (LTE) network, a third generation (3G) network, a code division multiple access (CDMA) network, etc.), a public land mobile network (PLMN), a local area network (LAN), a wide area network (WAN), a metropolitan area network (MAN), a telephone network (e.g., the Public Switched Telephone Network (PSTN)), a private network, an ad hoc network, an intranet, the Internet, a fiber optic-based network, or the like, and/or a combination of these or other types of networks.
- 5G fifth generation
- LTE long-term evolution
- 3G third generation
- CDMA code division multiple access
- PLMN public land mobile network
- LAN local area network
- WAN wide area network
- MAN metropolitan area network
- PSTN Public Switched Telephone Network
- PSTN Public Switch
- the number and arrangement of devices and networks shown in FIG. 1 are provided as an example. In practice, there may be additional devices and/or networks, fewer devices and/or networks, different devices and/or networks, or differently arranged devices and/or networks than those shown in FIG. 1. Furthermore, two or more devices shown in FIG. 1 may be implemented within a single device, or a single device shown in FIG. 1 may be implemented as multiple, distributed devices. Additionally, or alternatively, a set of devices (e.g., one or more devices) may perform one or more functions described as being performed by another set of devices.
- FIG. 2 is a diagram of components of one or more devices of FIG. 1 according to an embodiment.
- Device 200 may correspond to the user device 110 and/or the server device 120.
- the device 200 may include a bus 210, a processor 220, a memory 230, a storage component 240, an input component 250, an output component 260, and a communication interface 270.
- the bus 210 includes a component that permits communication among the components of the device 200.
- the processor 220 is implemented in hardware, firmware, or a combination of hardware and software.
- the processor 220 is a central processing unit (CPU), a graphics processing unit (GPU), an accelerated processing unit (APU), a microprocessor, a microcontroller, a digital signal processor (DSP), a field-programmable gate array (FPGA), an application-specific integrated circuit (ASIC), or another type of processing component.
- the processor 220 includes one or more processors capable of being programmed to perform a function.
- the memory 230 includes a random access memory (RAM), a read only memory (ROM), and/or another type of dynamic or static storage device (e.g., a flash memory, a magnetic memory, and/or an optical memory) that stores information and/or instructions for use by the processor 220.
- RAM random access memory
- ROM read only memory
- static storage device e.g., a flash memory, a magnetic memory, and/or an optical memory
- the storage component 240 stores information and/or software related to the operation and use of the device 200.
- the storage component 240 may include a hard disk (e.g., a magnetic disk, an optical disk, a magneto-optic disk, and/or a solid state disk), a compact disc (CD), a digital versatile disc (DVD), a floppy disk, a cartridge, a magnetic tape, and/or another type of non-transitory computer-readable medium, along with a corresponding drive.
- the input component 250 includes a component that permits the device 200 to receive information, such as via user input (e.g., a touch screen display, a keyboard, a keypad, a mouse, a button, a switch, and/or a microphone).
- the input component 250 may include a sensor for sensing information (e.g., a global positioning system (GPS) component, an accelerometer, a gyroscope, and/or an actuator).
- GPS global positioning system
- the output component 260 includes a component that provides output information from the device 200 (e.g., a display, a speaker, and/or one or more light-emitting diodes (LEDs)).
- a component that provides output information from the device 200 e.g., a display, a speaker, and/or one or more light-emitting diodes (LEDs)).
- LEDs light-emitting diodes
- the communication interface 270 includes a transceiver-like component (e.g., a transceiver and/or a separate receiver and transmitter) that enables the device 200 to communicate with other devices, such as via a wired connection, a wireless connection, or a combination of wired and wireless connections.
- the communication interface 270 may permit device 200 to receive information from another device and/or provide information to another device.
- the communication interface 270 may include an Ethernet interface, an optical interface, a coaxial interface, an infrared interface, a radio frequency (RF) interface, a universal serial bus (USB) interface, a Wi-Fi interface, a cellular network interface, or the like.
- the device 200 may perform one or more processes described herein.
- the device 200 may perform operations based on the processor 220 executing software instructions stored by a non-transitory computer-readable medium, such as the memory 230 and/or the storage component 240.
- a computer-readable medium is defined herein as a non-transitory memory device.
- a memory device includes memory space within a single physical storage device or memory space spread across multiple physical storage devices.
- Software instructions may be read into the memory 230 and/or the storage component 240 from another computer-readable medium or from another device via the communication interface 270.
- software instructions stored in the memory 230 and/or storage component 240 may cause the processor 220 to perform one or more processes described herein.
- hardwired circuitry may be used in place of or in combination with software instructions to perform one or more processes described herein.
- embodiments described herein are not limited to any specific combination of hardware circuitry and software.
- FIG. 3 is a diagram of a tone curve 300, according to an embodiment.
- the input intensity is measured on the horizontal axis, and the output intensity is measured on the vertical axis.
- a tone curve converts an input pixel intensity to a new output pixel intensity.
- the same tone curve may be applied to each RGB channel of a color image, or at least one of the RGB channels may have a tone curve specific to that channel.
- a tone curve may be referred to as a tone map, transfer function, tone operator, etc.
- GTM global tone mapping
- each pixel value is mapped to another value, regardless of the pixel position.
- GTM generally lacks flexibility, as local regions may be over-enhanced or under-enhanced.
- Local tone mapping (LTM) adjusts different image regions using different tone curves based on the image content. LTM offers more fine-grained control and allows for selective highlighting in images, and as explained below may apply constraints on aspects of the tone curve.
- a system and method for learning local tone curves using neural networks is based on tone mapping, outputting a series of tone curves instead of pixel-wise modifications.
- the tone curves are more intuitive for post-processing editing and for implementation in hardware.
- the system and method are not limited to a specific image resolution.
- FIG. 4A is a diagram of a training process, according to an embodiment.
- the system receives a non-tone-mapped input image 402, which may be resized.
- the system extracts features from the input image 402 and determines MxN local tone curves 406 using the neural network 404 (where M and N represent the grid size in M rows and N columns used to divide the image into patches or tiles, where M is the number of tiles or patches along the vertical direction and N is the number of tiles or patches along the horizontal direction (or along any two suitable axes in the plane of the image).
- network 404 determines a tone curve (in particular embodiments, 3 tone curves, 1 for each R, G, and B channel) for each tile or patch in the MxN grid.
- Each tone curve may include three one-dimensional lookup tables (LUTs), one for each RGB channel.
- the tone curves 406 may be constrained to be non-decreasing.
- the system then applies the tone curves to the input image and interpolates the image, as shown in block 408.
- the system then generates a locally tone-mapped image 410.
- the ground-truth image 412 e.g., a photographer edited image
- the system determines the loss with a loss function 414 based on the generated locally tone-mapped image 410 and the ground-truth image 412 to train the neural network.
- FIG. 4B is a diagram of an inference process, according to an embodiment.
- the system receives a resized non-tone-mapped image input 450.
- the system then extracts features and determines MxN local tone curves 454 using the neural network 452.
- the system then applies the tone curves to the full resolution version of the input image 450, as shown in block 456.
- the system then generates the locally tone-mapped full resolution image 458.
- FIG. 5 is a diagram of data pre-processing, according to an embodiment.
- an original raw image 510 is processed by an ISP to generate a white balanced full resolution image 512
- the image 510 is processed by an editor to generate the full resolution image 514.
- the image 512 may be used as an input image shown in FIGs. 4A and 4B above, and the image 514 may be used as a basis for a ground-truth image.
- the image 512 may be resized at block 516, augmented (i.e., flipped) at block 518 and provided to the neural network 520.
- image 514 may be resized at block 522, augmented (i.e., flipped) at block 524 and provided to the neural network 520.
- the image 512 may also be passed to the neural network 520 before the resizing and augmentation.
- the augmentation may be used to assist the neural network 520 to generalize images of different orientations.
- the resizing may be performed such that the image 512 and the image 514 are the same resolution for feature extraction.
- FIG. 6 is a diagram of a neural network architecture, according to an embodiment.
- An input image 602 is input to the network 600 of a size 512 x 512 x 3 (i.e., pixel length x pixel height x number of channels).
- the system then processes the input image 602 through various layers of the network 600.
- the first layer 604 may include a convolutional plus non-linear activation (e.g., rectified linear unit ReLU) layer that produces an output feature map of size 512 x 512 x 4.
- the second layer 606 may include a max pooling layer with an output shape of 256 x 256 x 4.
- the third layer 608 may include a convolutional plus non-linear activation layer with an output shape of 256 x 256 x 8.
- the fourth layer 610 may include a max pooling layer with an output shape of 128 x 128 x 8.
- the fifth layer 612 may include a convolutional plus non-linear activation layer with an output shape of 128 x 128 x 16.
- the sixth layer 614 may include a max pooling layer with an output shape of 64 x 64 x 16.
- the seventh layer 616 may include a convolutional plus non-linear activation layer with an output shape of 64 x 64 x 32.
- the eighth layer 618 may include a max pooling layer that with an output shape of 32 x 32 x 32.
- the ninth layer 620 may include a convolutional plus non-linear activation layer with an output shape of 32 x 32 x 64.
- the tenth layer 622 may include a max pooling layer with an output shape of 16 x 16 x 64.
- the eleventh layer 624 may include a convolutional plus sigmoid layer with an output shape of 16 x 16 x 768.
- the twelfth layer 626 may include a max pooling layer with an output shape of 8 x 8 x 768.
- the 8 x 8 size represents the final grid size for the number of tone curves (e.g., MxN).
- the 768 channels represent the 3 RGB channels multiplied by 256 entries in the one-dimensional LUT.
- the number of layers in the network 600 may be adjusted such that the output shape is consistent with the shape of the predicted tone curves.
- the tone curves may be constrained to be non-decreasing, to take on values between 0 and 1, and to be smooth.
- the layers of the network 600 may be used for feature extraction and tone curve prediction.
- the system may utilize architectures where the receptive fields of the output neurons making the tone curves cover the image portions on which they are applied.
- a tone curve prediction head may be stacked on top of the feature extraction layers to ensure that tone curve entries are in the desired shape and range.
- the output of the network 600, T may represent a set of transfer functions (i.e., tone curves) that are applied to the input image 602 to adjust its local contrast, brightness, and colors.
- the network 600 may predict a number of tone curves or one-dimensional LUTs for each image portion in an MxN grid. For a standard RGB (sRGB), three one-dimensional LUTs may be predicted for each portion, one for each R, G and B channel, as in Equation (1):
- Each tone curve may be represented by a one-dimensional LUT that has L entries ( t ⁇ R L ). Each entry maps an input pixel intensity to an output enhanced intensity.
- a predicted tone curve may be most appropriate for the center pixel of each portion in the MxN grid. All other pixels in the portion may be influenced by the tone curves of neighboring portions by varying degrees, according to the distance of the pixel to the neighboring portion centers. Thus, the tone curve for each pixel smoothly transitions to another, resulting in a continuous output image substantially free of boundary artifacts, as is described below.
- the system may transform all non-center pixels by a combination of neighboring tone curves whose portion centers are closest. Pixels in the center region of the image may be bilinearly interpolated, combining the influence of the two neighboring tone curves. Pixels at the border region of the image may be linearly interpolated, combining the influence of the two neighboring tone curves. Pixels at the four corners of the image may not be interpolated, as these pixels may be influenced by the tone curves of their own portion only.
- FIGs. 7, 8, 9, 10 and 11 are diagrams of tile-based interpolation, according to an embodiment.
- FIG. 7 includes a picture gird 700 and a region grid 712.
- the picture grid 700 includes four tiles, tile 702, tile 704, tile 706 and tile 708.
- the system may predict a tone curve for each tile using the neural network. Based on the location of pixel P being in the center region 714, the system may apply the tone curves for each of the tiles 702-708 to the center region 714, thereby creating four tone-mapped versions of the center region 714.
- point P’ may be determined as in Equation (3):
- P 1 , P 2 , P 3 , and P 4 represent the point P transformed by the four tone curves corresponding to the four tiles, tile 702, tile 704, tile 706 and tile 708, respectively.
- P’ may represent a weighted average of P 1 , P 2 , P 3 , and P 4 , (i.e., P’ is the result of P being transformed by a new tone curve that combines the influence of the four tone curves of the tiles 702-708). Every point P’ in the center region 714 of the output image is the interpolation of P 1 , P 2 , P 3 , and P 4 , weighted by the distance to each tile center.
- each of the respective tone curves are applied to the center region. While the example above involves four image tile and corresponding tone curves and 16 regions, this disclosure contemplates that interpolation may involve any suitable number of image tiles and regions.
- the system may apply the tone curve of tile 702 and the tone curve of tile 704 to the border region 902, as pixel P is located in tile 702 and borders tile 704.
- P’ may be determined as in Equation (4):
- Every point P in the border region 902 is a linear interpolation of P 1 and P 2 , and is weighted by the distance to each tile center.
- the pixel P is located in corner region 1102.
- the system may apply the tone curve of each tile to their respective corner regions, as no interpolation may be performed for pixels in corner regions (e.g., the pixels are not in regions that border other regions of other tiles).
- FIG. 12 is a diagram of graphs showing tone curve constraints, according to an embodiment.
- the tone curves may be constrained according to Equation (5):
- L is the number of control points, l ⁇ [0, L-1], ... ⁇ [0, 1] (tone curve values predicted by the neural network), and t 0 ... t (L-1) ⁇ [0, 1] (tone curve values with non-decreasing constraint enforced).
- t l is the cumulative sum of all previous points t 0 ...t l .
- Graph 1202 shows non-constrained tone curve points, and graph 1204 shows the tone curve points constrained according to Equation (5).
- the L1 loss function may be determined as in Equation (6):
- n is the total number of pixels
- y i is pixel i of the ground-truth image
- pixel i of the predicted image may be determined as in Equations (7) and (8):
- n is the total number of pixels
- y i is pixel i (an [R, G, B] vector) of the ground-truth image
- pixel i an [R, G, B] vector
- ⁇ i is the angle between y i , and , normalized to [0, 1].
- FIG. 13 is a diagram of a pixel weight map, according to an embodiment.
- the pixel weight map 1302 includes corner regions 1304, border regions 1306, and a center region 1308.
- the pixels at the border may be weighted more heavily in the L1 loss to provide more supervision on boundary tone curves, as shown in the loss generated in Equation 1310 (e.g., the loss generated based on applying the weight map 1302).
- the weighted L1 loss is obtained by elementwise multiplying the pixel weight map 1302 and the L1 difference between the ground truth image and the predicted image.
- pixels in the center regions may be weighted to 1/4
- pixels in the border regions may be weighted to 1/3
- pixels in the corner region may be weighted to 1/2.25.
- FIG. 13 illustrates a mask having a particular number of regions having square or rectangular shapes of particular sizes, this disclosure contemplates that a mask may contain any suitable number of regions having any suitable shape and size.
- FIG. 14 is a diagram of an example of averaging tone curves, according to an embodiment.
- tone curves can be averaged to produce a smaller grid.
- the larger grid 1402 may include a region 1404 including four tiles and four tone curves. If a smaller grid is needed for inference, the tone curves may be averaged to provide the smaller grid 1410.
- the tone curves in region 1404 can be averaged to produce a single tone curve for region 1412.
- the averaged tone curve shown in region 1412 is presented for illustration purposes and the actual linear average of the four tone curves in region 1404 may be different from the example averaged tone curve depicted.
- LTM LTM only to enhance images.
- GTM GTM
- FIG. 15 is a diagram of an image enhancement process, according to an embodiment.
- the system receives a non-tone-mapped input image 1502.
- the system extracts features from the image 1502 and determine a global tone curve as well as local tone curves as shown in 1506 using the neural network 1504.
- the system applies the global tone curve to the image 1502 to provide the globally tone-mapped image 1510.
- the system applies the local tone curves to the image 1510 to produce the locally tone-mapped image 1514.
- the system generates a loss function 1518 based on the image 1514 and a ground-truth image 1516.
- the system may apply the local tone curves first, and then apply a global tone curve.
- FIG. 16 is a diagram of an image enhancement process, according to an embodiment.
- the system receives a non-tone-mapped input image 1602, and extract features to determine a global tone curve 1606 using a GTM specific neural network 1604.
- the system applies the global tone curve 1606 to the image 1602 to produce a globally tone-mapped image 1610.
- the system extracts features from the image 1610 to generate local tone curves 1614 using an LTM specific neural network 1612.
- the system applies the local tone curves to the image 1610 to produce the locally tone-mapped image 1618.
- the system may apply the local tone curves first, and then apply a global tone curve.
- the system may be utilized in an interactive setting and integrated with photo-editing software.
- the system may be utilized by users to produce an automatically enhanced image, and then manually enhance a local region of the image by modifying the local tone curve corresponding to that region.
- the tone curve applied at location (i,j) may be a weighted average of tone curves predicted at the nearest portion centers. With (i,j) located in the center region, the tone curve applied at (i,j) may be determined as in Equation (9):
- t k represents the four surrounding curves
- w ijk represents the weight given to a component tone curve at location (i,j) that is inversely proportional to its distance from point (i,j).
- the user may define a target tone curve at location (i,j).
- the user may select from a set of preset tone curve, using the cumulative distribution function of the selected region, and use a self-defined LUT.
- the target tone curve may be treated as a scaled version of , as in Equation (10):
- elements of s are the scaling factors transforming each entry in to the target tone curve entry.
- the system may determine the scaling factors by element-wise division of the target tone curve t * by the original tone curve .
- the tone curves predicted at the nearest portion centers may be modified so that their interpolated result matches with the target tone curve.
- the edited image may be obtained by applying Interp(x, ) to the tone curve set that includes edited tone curves.
- FIG. 17 is a diagram of interactive editing of tone curves, according to an embodiment.
- a user may be presented with an image, such as image 1700.
- the user may select a point 1702 on the image.
- the system may then identify the neighboring determine tone curves at the point 1702, such as tone curves 1704.
- the system may present the user with a user interface 1706 for selecting a tone curve adjustment.
- the tone curve adjustment selections may include strong brightening, weak brightening, increasing contrast, darkening, histogram equalization, custom tone curve adjustments, etc.
- the strong brightening option is selected.
- the system may apply the selected tone curve adjustment to the neighboring tone curves 1704, as shown in adjusted tone curves 1708.
- FIG. 18 is a flowchart of a method for generating toned images, according to an embodiment.
- the system receives an input image.
- the system extracts at least one feature from the input image.
- the system determines at least local tone curve for a portion of the input image based on the extracted at least one feature, the portion of the input image being less than an overall area of the input image.
- the system generates a tone image based on the at least one local tone curve.
- the computer readable medium may include a computer-readable non-transitory storage medium (or media) having computer readable program instructions thereon for causing a processor to carry out operations.
- the computer readable storage medium can be a tangible device that can retain and store instructions for use by an instruction execution device.
- the computer readable storage medium may be, for example, but is not limited to, an electronic storage device, a magnetic storage device, an optical storage device, an electromagnetic storage device, a semiconductor storage device, or any suitable combination of the foregoing.
- a non-exhaustive list of more specific examples of the computer readable storage medium includes the following: a portable computer diskette, a hard disk, a random access memory (RAM), a read-only memory (ROM), an erasable programmable read-only memory (EPROM or Flash memory), a static random access memory (SRAM), a portable compact disc read-only memory (CD-ROM), a digital versatile disk (DVD), a memory stick, a floppy disk, a mechanically encoded device such as punch-cards or raised structures in a groove having instructions recorded thereon, and any suitable combination of the foregoing.
- RAM random access memory
- ROM read-only memory
- EPROM or Flash memory erasable programmable read-only memory
- SRAM static random access memory
- CD-ROM compact disc read-only memory
- DVD digital versatile disk
- memory stick a floppy disk
- a mechanically encoded device such as punch-cards or raised structures in a groove having instructions recorded thereon
- a computer readable storage medium is not to be construed as being transitory signals per se, such as radio waves or other freely propagating electromagnetic waves, electromagnetic waves propagating through a waveguide or other transmission media (e.g., light pulses passing through a fiber-optic cable), or electrical signals transmitted through a wire.
- Computer readable program instructions described herein can be downloaded to respective computing/processing devices from a computer readable storage medium or to an external computer or external storage device via a network, for example, the Internet, a local area network, a wide area network and/or a wireless network.
- the network may comprise copper transmission cables, optical transmission fibers, wireless transmission, routers, firewalls, switches, gateway computers and/or edge servers.
- a network adapter card or network interface in each computing/processing device receives computer readable program instructions from the network and forwards the computer readable program instructions for storage in a computer readable storage medium within the respective computing/processing device.
- Computer readable program code/instructions for carrying out operations may be assembler instructions, instruction-set-architecture (ISA) instructions, machine instructions, machine dependent instructions, microcode, firmware instructions, state-setting data, configuration data for integrated circuitry, or either source code or object code written in any combination of one or more programming languages, including an object oriented programming language such as Smalltalk, C++, or the like, and procedural programming languages, such as the "C" programming language or similar programming languages.
- the computer readable program instructions may execute entirely on the user's computer, partly on the user's computer, as a stand-alone software package, partly on the user's computer and partly on a remote computer or entirely on the remote computer or server.
- the remote computer may be connected to the user's computer through any type of network, including a local area network (LAN) or a wide area network (WAN), or the connection may be made to an external computer (for example, through the Internet using an Internet Service Provider).
- electronic circuitry including, for example, programmable logic circuitry, field-programmable gate arrays (FPGA), or programmable logic arrays (PLA) may execute the computer readable program instructions by utilizing state information of the computer readable program instructions to personalize the electronic circuitry, in order to perform aspects or operations.
- These computer readable program instructions may be provided to a processor of a general purpose computer, special purpose computer, or other programmable data processing apparatus to produce a machine, such that the instructions, which execute via the processor of the computer or other programmable data processing apparatus, create means for implementing the functions/acts specified in the flowchart and/or block diagram block or blocks.
- These computer readable program instructions may also be stored in a computer readable storage medium that can direct a computer, a programmable data processing apparatus, and/or other devices to function in a particular manner, such that the computer readable storage medium having instructions stored therein comprises an article of manufacture including instructions which implement aspects of the function/act specified in the flowchart and/or block diagram block or blocks.
- the computer readable program instructions may also be loaded onto a computer, other programmable data processing apparatus, or other device to cause a series of operational steps to be performed on the computer, other programmable apparatus or other device to produce a computer implemented process, such that the instructions which execute on the computer, other programmable apparatus, or other device implement the functions/acts specified in the flowchart and/or block diagram block or blocks.
- each block in the flowchart or block diagrams may represent a module, segment, or portion of instructions, which comprises one or more executable instructions for implementing the specified logical function(s).
- the method, computer system, and computer readable medium may include additional blocks, fewer blocks, different blocks, or differently arranged blocks than those depicted in the Figures.
- the functions noted in the blocks may occur out of the order noted in the Figures. For example, two blocks shown in succession may, in fact, be executed concurrently or substantially concurrently, or the blocks may sometimes be executed in the reverse order, depending upon the functionality involved.
Landscapes
- Engineering & Computer Science (AREA)
- Physics & Mathematics (AREA)
- General Physics & Mathematics (AREA)
- Theoretical Computer Science (AREA)
- Computer Vision & Pattern Recognition (AREA)
- Multimedia (AREA)
- Image Processing (AREA)
Abstract
Description


Claims (14)
- A method, comprising:receiving an input image;extracting at least one feature from the input image;determining at least one local tone curve for a portion of the input image based on the extracted at least one feature, the portion of the input image being less than an overall area of the input image; andgenerating a toned image based on the at least one local tone curve.
- The method of claim 1, wherein the at least one local tone curve comprises a plurality of one-dimensional look-up tables (LUTs) for each color channel.
- The method of claim 1, wherein the portion of the input image comprises a plurality of pixels of the input image.
- The method of claim 1, wherein the at least one local tone curve is constrained to be non-decreasing.
- The method of claim 1, wherein generating the toned image comprises applying the at least one local tone curve to a border region of the portion of the input image.
- The method of claim 1, wherein determining the at least one local tone curve for the portion of the input image comprises:partitioning the input image into a plurality of portions; anddetermining a tone curve for each of the plurality of portions.
- The method of claim 1, further comprising determining a pixel weight map of the input image.
- A system, comprising:a memory storing instructions; anda processor configured to execute the instructions to:receive an input image;extract at least one feature from the input image;determine at least one local tone curve for a portion of the input image based on the extracted at least one feature, the portion of the input image being less than an overall area of the input image; andgenerate a toned image based on the at least one local tone curve.
- The system of claim 8, wherein the at least one local tone curve comprises a plurality of one-dimensional look-up tables (LUTs) for each color channel.
- The system of claim 8, wherein the portion of the input image comprises a plurality of pixels of the input image.
- The system of claim 8, wherein the at least one local tone curve is constrained to be non-decreasing.
- The system of claim 8, wherein the processor is further configured to execute the instructions to generate the toned image comprises applying the at least one local tone curve to a border region of the portion of the input image.
- The system of claim 8, wherein the processor is further configured to execute the instructions to determine the at least one local tone curve for the portion of the input image by:partitioning the input image into a plurality of portions; anddetermining a tone curve for each of the plurality of portions.
- The system of claim 8, wherein the processor is further configured to execute the instructions to determine a pixel weight map of the input image.
Priority Applications (2)
| Application Number | Priority Date | Filing Date | Title |
|---|---|---|---|
| EP22883878.5A EP4327272A4 (en) | 2021-10-22 | 2022-10-13 | SYSTEM AND METHOD FOR LEARNING TONE CURVES FOR LOCAL IMAGE ENHANCEMENT |
| CN202280058781.2A CN117897723A (en) | 2021-10-22 | 2022-10-13 | System and method for learning tone curves for local image enhancement |
Applications Claiming Priority (4)
| Application Number | Priority Date | Filing Date | Title |
|---|---|---|---|
| US202163270817P | 2021-10-22 | 2021-10-22 | |
| US63/270,817 | 2021-10-22 | ||
| US17/566,448 | 2021-12-30 | ||
| US17/566,448 US12148186B2 (en) | 2021-10-22 | 2021-12-30 | System and method for learning tone curves for local image enhancement |
Publications (1)
| Publication Number | Publication Date |
|---|---|
| WO2023068655A1 true WO2023068655A1 (en) | 2023-04-27 |
Family
ID=86056359
Family Applications (1)
| Application Number | Title | Priority Date | Filing Date |
|---|---|---|---|
| PCT/KR2022/015507 Ceased WO2023068655A1 (en) | 2021-10-22 | 2022-10-13 | System and method for learning tone curves for local image enhancement |
Country Status (4)
| Country | Link |
|---|---|
| US (1) | US12148186B2 (en) |
| EP (1) | EP4327272A4 (en) |
| CN (1) | CN117897723A (en) |
| WO (1) | WO2023068655A1 (en) |
Families Citing this family (4)
| Publication number | Priority date | Publication date | Assignee | Title |
|---|---|---|---|---|
| US12260526B2 (en) | 2021-08-13 | 2025-03-25 | Samsung Electronics Co., Ltd. | Self-emitting display (SED) burn-in prevention based on stationary luminance reduction |
| US12211434B2 (en) | 2021-08-13 | 2025-01-28 | Samsung Electronics Co., Ltd. | Detecting stationary regions for organic light emitting diode (OLED) television (TV) luminance reduction |
| US12367565B2 (en) * | 2021-08-18 | 2025-07-22 | Samsung Electronics Co., Ltd. | Efficient inverse tone mapping network for standard dynamic range (SDR) to high dynamic range (HDR) conversion on HDR display |
| US12020412B1 (en) | 2021-12-15 | 2024-06-25 | Waymo Llc | Systems and methods for a tone mapper solution for an autonomous driving system |
Citations (4)
| Publication number | Priority date | Publication date | Assignee | Title |
|---|---|---|---|---|
| US20130322753A1 (en) * | 2012-05-31 | 2013-12-05 | Apple Inc. | Systems and methods for local tone mapping |
| US20150071537A1 (en) | 2013-09-10 | 2015-03-12 | Apple Inc. | Image Tone Adjustment using Local Tone Curve Computation |
| US20150245044A1 (en) * | 2014-02-25 | 2015-08-27 | Apple Inc. | Backward-compatible video capture and distribution |
| JP2016004313A (en) * | 2014-06-13 | 2016-01-12 | 大日本印刷株式会社 | Image processing apparatus and brightness adjustment method |
Family Cites Families (10)
| Publication number | Priority date | Publication date | Assignee | Title |
|---|---|---|---|---|
| US6825884B1 (en) * | 1998-12-03 | 2004-11-30 | Olympus Corporation | Imaging processing apparatus for generating a wide dynamic range image |
| US9008415B2 (en) | 2011-09-02 | 2015-04-14 | Adobe Systems Incorporated | Automatic image adjustment parameter correction |
| US20140223136A1 (en) * | 2013-02-07 | 2014-08-07 | Lsi Corporation | Lookup Tables Utilizing Read Only Memory and Combinational Logic |
| EP3111416A1 (en) | 2014-02-26 | 2017-01-04 | Thomson Licensing | Method and apparatus for encoding and decoding hdr images |
| WO2016056787A1 (en) | 2014-10-06 | 2016-04-14 | Samsung Electronics Co., Ltd. | Display device and method of controlling the same |
| EP3944615A1 (en) * | 2015-09-02 | 2022-01-26 | Faurecia Irystec Inc. | System and method for real-time tone-mapping |
| US10504452B2 (en) | 2018-03-12 | 2019-12-10 | Apple Inc. | Pixel contrast control systems and methods |
| US10885615B2 (en) | 2018-10-19 | 2021-01-05 | Gopro, Inc. | Multi-level lookup tables for control point processing and histogram collection |
| KR102658688B1 (en) | 2019-11-04 | 2024-04-17 | 엘지전자 주식회사 | Method and apparatus for enhancing image illumination intensity |
| CN111784598B (en) | 2020-06-18 | 2023-06-02 | Oppo(重庆)智能科技有限公司 | Training method of tone mapping model, tone mapping method and electronic equipment |
-
2021
- 2021-12-30 US US17/566,448 patent/US12148186B2/en active Active
-
2022
- 2022-10-13 WO PCT/KR2022/015507 patent/WO2023068655A1/en not_active Ceased
- 2022-10-13 CN CN202280058781.2A patent/CN117897723A/en active Pending
- 2022-10-13 EP EP22883878.5A patent/EP4327272A4/en active Pending
Patent Citations (4)
| Publication number | Priority date | Publication date | Assignee | Title |
|---|---|---|---|---|
| US20130322753A1 (en) * | 2012-05-31 | 2013-12-05 | Apple Inc. | Systems and methods for local tone mapping |
| US20150071537A1 (en) | 2013-09-10 | 2015-03-12 | Apple Inc. | Image Tone Adjustment using Local Tone Curve Computation |
| US20150245044A1 (en) * | 2014-02-25 | 2015-08-27 | Apple Inc. | Backward-compatible video capture and distribution |
| JP2016004313A (en) * | 2014-06-13 | 2016-01-12 | 大日本印刷株式会社 | Image processing apparatus and brightness adjustment method |
Non-Patent Citations (5)
| Title |
|---|
| EILERTSEN GABRIEL ET AL.: "Real-time noise-aware tone mapping", ACM TRANSACTIONS ON GRAPHICS, vol. 34, no. 6, 26 October 2015 (2015-10-26), pages 1 - 15, XP059139387, DOI: 10.1145/2816795.2818092 |
| GUO CHUNLE ET AL.: "Zero-Reference Deep Curve Estimation for Low-light Image Enhancement", 2020 IEEE/CVF CONFERENCE ON COMPUTER VISION AND PATTERN RECOGNITION (CVPR, 13 June 2020 (2020-06-13), pages 1777 - 1786, XP033803723, DOI: 10.1109/CVPR42600.2020.00185 |
| NA SEWHAN, JANG WOOHYUK, LIM HYUNWOOK, LEE JAEYOUL, KANG IMSOO: "68‐2: Data‐driven Image Enhancement Using Deep Neural Networks for a Display Image Pipeline", SID SYMPOSIUM DIGEST OF TECHNICAL PAPERS, vol. 50, no. 1, 1 June 2019 (2019-06-01), US , pages 961 - 964, XP093059109, ISSN: 0097-966X, DOI: 10.1002/sdtp.13085 * |
| See also references of EP4327272A4 |
| ZHAO LUXI, ABDELHAMED ABDELRAHMAN, BROWN MICHAEL S.: "Learning Tone Curves for Local Image Enhancement", IEEE ACCESS, vol. 10, 19 March 2022 (2022-03-19), pages 60099 - 60113, XP093059113, DOI: 10.1109/ACCESS.2022.3178745 * |
Also Published As
| Publication number | Publication date |
|---|---|
| EP4327272A1 (en) | 2024-02-28 |
| CN117897723A (en) | 2024-04-16 |
| EP4327272A4 (en) | 2024-10-30 |
| US12148186B2 (en) | 2024-11-19 |
| US20230127327A1 (en) | 2023-04-27 |
Similar Documents
| Publication | Publication Date | Title |
|---|---|---|
| WO2023068655A1 (en) | System and method for learning tone curves for local image enhancement | |
| WO2020231016A1 (en) | Image optimization method, apparatus, device and storage medium | |
| US8724196B2 (en) | Image processing device | |
| CN113989396B (en) | Picture rendering method, apparatus, device, storage medium, and program product | |
| WO2019035551A1 (en) | Apparatus for composing objects using depth map and method for the same | |
| WO2022203464A2 (en) | Method for real-time omnidirectional stereo matching using multi-view fisheye lenses and system therefor | |
| CN111275648A (en) | Face image processing method, device and equipment and computer readable storage medium | |
| WO2023046112A1 (en) | Document image enhancement method and apparatus, and electronic device | |
| CN114266803A (en) | Image processing method, image processing device, electronic equipment and storage medium | |
| WO2024158126A1 (en) | Method and apparatus for processing image frames | |
| CN110503618A (en) | Image processing method and electronic equipment | |
| WO2016114574A2 (en) | Method and device for filtering texture, using patch shift | |
| WO2023017978A1 (en) | Adaptive sub-pixel spatial temporal interpolation for color filter array | |
| WO2022197001A1 (en) | Method and electronic device for removing artifact in high resolution image | |
| CN111462158A (en) | Image processing method and device, intelligent device and storage medium | |
| EP3803797A1 (en) | Methods and systems for performing editing operations on media | |
| US10089767B2 (en) | Simplified lighting compositing | |
| WO2025014070A1 (en) | Electronic device and method for displaying image, and computer-readable medium | |
| EP4494037A1 (en) | Method and electronic device for determining optimal global attention in deep learning model | |
| WO2023219189A1 (en) | Electronic device for compositing images on basis of depth map and method therefor | |
| WO2025080091A1 (en) | An electronic device for generating color-corrected image and controlling method thereof | |
| WO2024147483A1 (en) | Image-filtering interface | |
| WO2021172744A1 (en) | Electronic device and control method therefor | |
| CN120747126B (en) | Image processing method and electronic equipment | |
| WO2024035223A1 (en) | System and method for enhancing the quality of a video |
Legal Events
| Date | Code | Title | Description |
|---|---|---|---|
| 121 | Ep: the epo has been informed by wipo that ep was designated in this application |
Ref document number: 22883878 Country of ref document: EP Kind code of ref document: A1 |
|
| WWE | Wipo information: entry into national phase |
Ref document number: 2022883878 Country of ref document: EP |
|
| ENP | Entry into the national phase |
Ref document number: 2022883878 Country of ref document: EP Effective date: 20231122 |
|
| WWE | Wipo information: entry into national phase |
Ref document number: 202280058781.2 Country of ref document: CN |
|
| WWE | Wipo information: entry into national phase |
Ref document number: 202447031771 Country of ref document: IN |
|
| NENP | Non-entry into the national phase |
Ref country code: DE |