WO2023074685A1 - 検査方法及び検査装置 - Google Patents
検査方法及び検査装置 Download PDFInfo
- Publication number
- WO2023074685A1 WO2023074685A1 PCT/JP2022/039729 JP2022039729W WO2023074685A1 WO 2023074685 A1 WO2023074685 A1 WO 2023074685A1 JP 2022039729 W JP2022039729 W JP 2022039729W WO 2023074685 A1 WO2023074685 A1 WO 2023074685A1
- Authority
- WO
- WIPO (PCT)
- Prior art keywords
- inspection
- distribution data
- dimensional distribution
- area
- positions
- Prior art date
- Legal status (The legal status is an assumption and is not a legal conclusion. Google has not performed a legal analysis and makes no representation as to the accuracy of the status listed.)
- Ceased
Links
Images


Classifications
-
- G—PHYSICS
- G01—MEASURING; TESTING
- G01N—INVESTIGATING OR ANALYSING MATERIALS BY DETERMINING THEIR CHEMICAL OR PHYSICAL PROPERTIES
- G01N29/00—Investigating or analysing materials by the use of ultrasonic, sonic or infrasonic waves; Visualisation of the interior of objects by transmitting ultrasonic or sonic waves through the object
- G01N29/04—Analysing solids
- G01N29/11—Analysing solids by measuring attenuation of acoustic waves
-
- G—PHYSICS
- G01—MEASURING; TESTING
- G01N—INVESTIGATING OR ANALYSING MATERIALS BY DETERMINING THEIR CHEMICAL OR PHYSICAL PROPERTIES
- G01N29/00—Investigating or analysing materials by the use of ultrasonic, sonic or infrasonic waves; Visualisation of the interior of objects by transmitting ultrasonic or sonic waves through the object
- G01N29/04—Analysing solids
- G01N29/06—Visualisation of the interior, e.g. acoustic microscopy
- G01N29/0609—Display arrangements, e.g. colour displays
- G01N29/0645—Display representation or displayed parameters, e.g. A-, B- or C-Scan
-
- G—PHYSICS
- G01—MEASURING; TESTING
- G01N—INVESTIGATING OR ANALYSING MATERIALS BY DETERMINING THEIR CHEMICAL OR PHYSICAL PROPERTIES
- G01N29/00—Investigating or analysing materials by the use of ultrasonic, sonic or infrasonic waves; Visualisation of the interior of objects by transmitting ultrasonic or sonic waves through the object
- G01N29/04—Analysing solids
- G01N29/06—Visualisation of the interior, e.g. acoustic microscopy
- G01N29/0654—Imaging
- G01N29/069—Defect imaging, localisation and sizing using, e.g. time of flight diffraction [TOFD], synthetic aperture focusing technique [SAFT], Amplituden-Laufzeit-Ortskurven [ALOK] technique
-
- G—PHYSICS
- G01—MEASURING; TESTING
- G01N—INVESTIGATING OR ANALYSING MATERIALS BY DETERMINING THEIR CHEMICAL OR PHYSICAL PROPERTIES
- G01N29/00—Investigating or analysing materials by the use of ultrasonic, sonic or infrasonic waves; Visualisation of the interior of objects by transmitting ultrasonic or sonic waves through the object
- G01N29/44—Processing the detected response signal, e.g. electronic circuits specially adapted therefor
- G01N29/4409—Processing the detected response signal, e.g. electronic circuits specially adapted therefor by comparison
- G01N29/4427—Processing the detected response signal, e.g. electronic circuits specially adapted therefor by comparison with stored values, e.g. threshold values
-
- G—PHYSICS
- G01—MEASURING; TESTING
- G01N—INVESTIGATING OR ANALYSING MATERIALS BY DETERMINING THEIR CHEMICAL OR PHYSICAL PROPERTIES
- G01N29/00—Investigating or analysing materials by the use of ultrasonic, sonic or infrasonic waves; Visualisation of the interior of objects by transmitting ultrasonic or sonic waves through the object
- G01N29/44—Processing the detected response signal, e.g. electronic circuits specially adapted therefor
- G01N29/4409—Processing the detected response signal, e.g. electronic circuits specially adapted therefor by comparison
- G01N29/4436—Processing the detected response signal, e.g. electronic circuits specially adapted therefor by comparison with a reference signal
-
- G—PHYSICS
- G01—MEASURING; TESTING
- G01N—INVESTIGATING OR ANALYSING MATERIALS BY DETERMINING THEIR CHEMICAL OR PHYSICAL PROPERTIES
- G01N29/00—Investigating or analysing materials by the use of ultrasonic, sonic or infrasonic waves; Visualisation of the interior of objects by transmitting ultrasonic or sonic waves through the object
- G01N29/44—Processing the detected response signal, e.g. electronic circuits specially adapted therefor
- G01N29/4445—Classification of defects
-
- G—PHYSICS
- G01—MEASURING; TESTING
- G01N—INVESTIGATING OR ANALYSING MATERIALS BY DETERMINING THEIR CHEMICAL OR PHYSICAL PROPERTIES
- G01N29/00—Investigating or analysing materials by the use of ultrasonic, sonic or infrasonic waves; Visualisation of the interior of objects by transmitting ultrasonic or sonic waves through the object
- G01N29/44—Processing the detected response signal, e.g. electronic circuits specially adapted therefor
- G01N29/4472—Mathematical theories or simulation
-
- G—PHYSICS
- G01—MEASURING; TESTING
- G01N—INVESTIGATING OR ANALYSING MATERIALS BY DETERMINING THEIR CHEMICAL OR PHYSICAL PROPERTIES
- G01N29/00—Investigating or analysing materials by the use of ultrasonic, sonic or infrasonic waves; Visualisation of the interior of objects by transmitting ultrasonic or sonic waves through the object
- G01N29/44—Processing the detected response signal, e.g. electronic circuits specially adapted therefor
- G01N29/4481—Neural networks
-
- G—PHYSICS
- G01—MEASURING; TESTING
- G01N—INVESTIGATING OR ANALYSING MATERIALS BY DETERMINING THEIR CHEMICAL OR PHYSICAL PROPERTIES
- G01N29/00—Investigating or analysing materials by the use of ultrasonic, sonic or infrasonic waves; Visualisation of the interior of objects by transmitting ultrasonic or sonic waves through the object
- G01N29/44—Processing the detected response signal, e.g. electronic circuits specially adapted therefor
- G01N29/48—Processing the detected response signal, e.g. electronic circuits specially adapted therefor by amplitude comparison
-
- G—PHYSICS
- G01—MEASURING; TESTING
- G01N—INVESTIGATING OR ANALYSING MATERIALS BY DETERMINING THEIR CHEMICAL OR PHYSICAL PROPERTIES
- G01N29/00—Investigating or analysing materials by the use of ultrasonic, sonic or infrasonic waves; Visualisation of the interior of objects by transmitting ultrasonic or sonic waves through the object
- G01N29/44—Processing the detected response signal, e.g. electronic circuits specially adapted therefor
- G01N29/50—Processing the detected response signal, e.g. electronic circuits specially adapted therefor using auto-correlation techniques or cross-correlation techniques
-
- G—PHYSICS
- G06—COMPUTING OR CALCULATING; COUNTING
- G06N—COMPUTING ARRANGEMENTS BASED ON SPECIFIC COMPUTATIONAL MODELS
- G06N20/00—Machine learning
-
- G—PHYSICS
- G01—MEASURING; TESTING
- G01N—INVESTIGATING OR ANALYSING MATERIALS BY DETERMINING THEIR CHEMICAL OR PHYSICAL PROPERTIES
- G01N2291/00—Indexing codes associated with group G01N29/00
- G01N2291/01—Indexing codes associated with the measuring variable
- G01N2291/015—Attenuation, scattering
-
- G—PHYSICS
- G01—MEASURING; TESTING
- G01N—INVESTIGATING OR ANALYSING MATERIALS BY DETERMINING THEIR CHEMICAL OR PHYSICAL PROPERTIES
- G01N2291/00—Indexing codes associated with group G01N29/00
- G01N2291/26—Scanned objects
- G01N2291/269—Various geometry objects
- G01N2291/2695—Bottles, containers
-
- G—PHYSICS
- G01—MEASURING; TESTING
- G01N—INVESTIGATING OR ANALYSING MATERIALS BY DETERMINING THEIR CHEMICAL OR PHYSICAL PROPERTIES
- G01N2291/00—Indexing codes associated with group G01N29/00
- G01N2291/26—Scanned objects
- G01N2291/269—Various geometry objects
- G01N2291/2698—Other discrete objects, e.g. bricks
Definitions
- the present disclosure relates to inspection methods and inspection apparatuses.
- This application claims priority based on Japanese Patent Application No. 2021-178076 filed on October 29, 2021, the entire disclosure of which is incorporated herein.
- a packaging container that store items in a sealed state.
- Such a packaging container is formed into a bag-like shape by welding, bonding, or the like the peripheral edge portions of a sheet member or a film member.
- the opening of the packaging container is closed after the contents are accommodated inside the packaging container.
- an inspection device for inspecting the bonding state of such packaging containers for example, as shown in Patent Document 1, a packaging container to be inspected is arranged between an ultrasonic transmission unit and an ultrasonic reception unit, and ultrasonic waves are transmitted.
- a device has been proposed in which ultrasonic waves are transmitted from an ultrasonic wave receiving unit, and the ultrasonic waves received by an ultrasonic wave receiving unit are analyzed and inspected.
- the packaging container may be relatively moved to inspect the sealed portion along the length direction (direction along the outer circumference).
- Such an inspection device determines whether or not the quality of the bonding state is good based on the inspection results at each position along the length direction of the packaging container. As a result, when a defective detection result is obtained at any point in the longitudinal direction of the packaging container, it is detected that there is an improperly joined portion, and the inspection result of the packaging container is unsatisfactory. It is determined that there is
- defects in the joint state such as a state in which the welding of the joint is insufficient on the joint surface as a whole, and a state in which the joint is excessively welded.
- There are various forms such as a state and a state in which air bubbles have entered the joint.
- Patent Document 1 when inspecting the joint state in the length direction, the joint portion also has a certain length in the width direction (direction perpendicular to the length direction). Therefore, even if the joint state is poor at any position in the length direction, if the joint is properly joined at any position in the width direction, the joint is not separated and can be handled as a non-defective product. Sometimes. However, with the method of Patent Document 1, it may be difficult to accurately determine the quality.
- one example of the object of the present disclosure is to provide an inspection method and an inspection apparatus that can determine whether or not the quality is good in consideration of various joining states.
- a detection method corresponds to a plurality of positions included in an inspection region of an inspection target and arranged along first and second directions, respectively, and each receives ultrasonic waves irradiated to the inspection region. acquire a plurality of signal intensities indicating signal intensities corresponding to the plurality of positions, generate two-dimensional distribution data representing the relationship between the plurality of positions and the plurality of signal intensities, and use the two-dimensional distribution data to obtain the plurality of Among the positions, the number of positions aligned along the second direction and associated with the signal strength indicating the strength included in the first range is counted, and the counted result and the first reference value determining the quality of the inspected object based on the result of the comparison with.
- a detection method corresponds to a plurality of positions included in an inspection region of an inspection target and arranged along first and second directions, respectively, and each receives ultrasonic waves irradiated to the inspection region. acquire a plurality of signal intensities indicating signal intensities corresponding to the plurality of positions, generate two-dimensional distribution data representing the relationship between the plurality of positions and the plurality of signal intensities, and use the two-dimensional distribution data to obtain the plurality of of the positions included in the determination target area and associated with the signal strength indicating the strength included in the first range, and comparing the counted result with the second reference value Determining the quality of the inspected object based on the results of the comparison.
- a detection method corresponds to a plurality of positions included in an inspection region of an inspection target and arranged along first and second directions, respectively, and each receives ultrasonic waves irradiated to the inspection region. acquire a plurality of signal intensities indicating signal intensities corresponding to the two-dimensional distribution data representing the relationship between the plurality of positions and the plurality of signal intensities; Determining the quality of the inspection object based on a trained model generated by learning reference two-dimensional distribution data generated using the object.
- a seal width check that determines quality based on the length in the width direction of a region belonging to a range where the signal intensity in the two-dimensional distribution data is a reference, and a quality determination based on the area of a specific color in the determination target area are performed.
- the area check and the correlation check that performs pass/fail judgment using correlation with reference data, pass/fail judgment can be performed in consideration of various bonding states. Further, according to the present disclosure, when a defect is detected, it becomes easier to examine the cause thereof, and it becomes easier to deal with when a defect in the joint is detected.
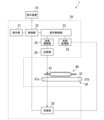
- FIG. 1 is a block diagram showing a configuration example of an ultrasonic inspection system according to an embodiment of the present disclosure
- FIG. FIG. 4 is an explanatory diagram of an example of a display screen of a display device in the ultrasonic inspection system according to the embodiment of the present disclosure
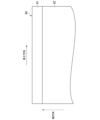
- It is explanatory drawing of the packaging container which is an inspection target.
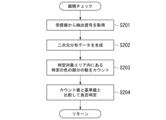
- 4 is a flowchart showing processing performed in seal width check in the ultrasonic inspection system according to the embodiment of the present disclosure; It is a figure which shows the relationship between signal intensity and a color signal to be set.
- FIG. 10 is an explanatory diagram of a seal width check
- FIG. 10 is an explanatory diagram of a seal width check
- 4 is a flow chart showing processing in area check in this embodiment.
- FIG. 10 is an explanatory diagram of area check; FIG. 10 is an explanatory diagram of area check; FIG. 4 is an explanatory diagram of setting a determination target area; FIG. 4 is an explanatory diagram of setting a determination target area; 7 is a flow chart showing processing in correlation check in this embodiment.
- FIG. 10 is an explanatory diagram of pass/fail determination using histogram correlation;
- FIG. 10 is an explanatory diagram of pass/fail determination using histogram correlation;
- FIG. 10 is an explanatory diagram of pass/fail determination using histogram correlation;
- 4 is a flowchart showing pass/fail determination processing in the ultrasonic inspection system according to the embodiment of the present disclosure;
- FIG. 1 is a block diagram showing a configuration example of an ultrasonic inspection system 1 according to an embodiment.
- the ultrasonic inspection system 1 uses ultrasonic waves to inspect a packaging container 40 that is an object to be inspected.
- the ultrasonic inspection system 1 includes a display device 10 , an ultrasonic inspection device 20 and a carrier device 30 .
- the display device 10 displays various information related to ultrasonic examination output from the control unit 22 of the ultrasonic examination apparatus 20 .
- FIG. 2 is an example of a display screen of the display device 10 in the ultrasonic inspection system 1 according to this embodiment.
- the display screen of the display device 10 includes an ultrasonic image display area 101 and an examination result display area 102 .
- a two-dimensional image (two-dimensional distribution data) based on the reception result received by the receiver 28 is displayed in the ultrasonic image display area 101 .
- a seal width check determination result 103a, an area check determination result 103b, a correlation check determination result 103c, and an overall determination result 103d are displayed.
- the conveying device 30 conveys the packaging container 40.
- the conveying device 30 is, for example, a belt conveyor.
- a packaging container 40 of an object to be inspected is placed on the belt 32 of the conveying device 30 .
- the conveying device 30 drives the belt 32 by rotating rollers 31 (rollers 31 a and 31 b ) provided inside, and moves the inspection object to a predetermined inspection position between the transmitting unit 26 and the receiving unit 28 . of the packaging container 40 is transported. Rotation of the roller 31 is controlled by, for example, a drive control section of the ultrasonic inspection apparatus 20 .
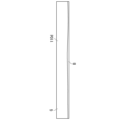
- the packaging container 40 is an object to be inspected by the ultrasonic inspection device 20.
- the packaging container 40 is, for example, a packaging container formed by joining the peripheral edge portion 41 of a sheet member, and is used as a pouch-type packaging container for retort food, drinking water, and the like.
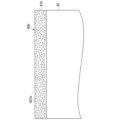
- FIG. 3 is an explanatory diagram of a packaging container 40 that is an object to be inspected. A portion of the packaging container 40 is illustrated in FIG. As shown in FIG. 3, the packaging container 40 has a peripheral edge 41 and a receiving area 42 .
- the storage area 42 is a bag-like area in which a stored object can be enclosed.
- the peripheral edge portion 41 is a peripheral edge area of the packaging container 40 and is an area to be joined.
- the inspection area of the packaging container 40 is, for example, the joint of the peripheral portion 41 where two sheet members forming the packaging container are to be joined.
- the ultrasonic inspection device 20 is a computer that transmits ultrasonic waves and inspects the packaging container 40 based on the ultrasonic waves that have passed through the packaging container 40 .
- the ultrasound examination apparatus 20 includes an operation unit 21, a control unit 22, a signal control unit 23, a transmission control unit 24, a reception processing unit 25, a transmission unit 26, and a reception unit 28, for example.
- the ultrasonic inspection apparatus 20 is a computer that includes a processor such as a CPU (Central Processing Unit) and a program memory that stores programs executed by the processor.
- the functional units (operation unit 21, control unit 22, signal control unit 23, transmission control unit 24, reception processing unit 25, transmission unit 26, reception unit 28) constituting the ultrasonic inspection apparatus 20 are, for example, a CPU (Central Processing Unit ) by executing a program stored in a program memory. Also, some or all of these functional units may be realized by hardware such as LSI (Large Scale Integration), ASIC (Application Specific Integrated Circuit), or FPGA (Field-Programmable Gate Array).
- LSI Large Scale Integration
- ASIC Application Specific Integrated Circuit
- FPGA Field-Programmable Gate Array
- the operation unit 21 is composed of a keyboard, a mouse, etc., and is used to input and set various information related to ultrasound examination.
- the operation unit 21 outputs various types of input information to the control unit 22 .
- the control unit 22 comprehensively controls the ultrasonic inspection apparatus 20 .
- the control unit 22 for example, transmits various kinds of information input from the operation unit 21 and information from the signal control unit 23 to the display device 10 .
- the signal control unit 23 generates a signal for controlling the ultrasonic waves transmitted from the transmission unit 26.
- the ultrasonic waves to be transmitted are, for example, burst signals.
- the signal control unit 23 generates, for example, a burst signal according to the transmission timing and intensity of ultrasonic waves to be transmitted.
- the signal control section 23 outputs the generated signal to the transmission control section 24 .
- the signal control unit 23 acquires the signal received by the reception unit 28 via the reception processing unit 25 .
- the signal control unit 23 generates two-dimensional distribution data from the acquired signals and generates an image based on this two-dimensional distribution data.
- the two-dimensional distribution data is a plurality of positions arranged in the length direction (first direction) and width direction (second direction, perpendicular to the length direction) of the inspection area and the signal intensity at these positions. This is image data representing the relationship.
- the signal control unit 23 performs analysis using the obtained two-dimensional distribution data, and outputs the analysis result to the control unit 22 .
- the signal control unit 23 can perform a seal width check, an area check, a correlation check, and overall quality determination using these.
- the signal control unit 23 determines whether or not there is a defect in the image of the inspection area and the joint portion serving as the inspection area based on the analysis result, and outputs the determination result to the control unit 22 .
- the control unit 22 causes the display device 10 to display the determination result acquired from the signal control unit 23 .
- the transmission control section 24 generates a burst wave with a predetermined frequency according to the burst signal from the signal control section 23 and outputs the generated burst wave to the transmission section 26 .
- the transmission unit 26 converts the burst waves into ultrasonic vibrations and outputs them as ultrasonic waves.
- the receiving unit 28 includes a plurality of ultrasonic sensors arranged one-dimensionally or two-dimensionally (a plurality of ultrasonic sensors arranged in a line, a plurality of ultrasonic sensors arranged in the vertical direction and the horizontal direction), and transmits The ultrasonic waves transmitted from the unit 26 are received.
- the ultrasonic waves from the transmitter 26 reach the receiver 28 via the peripheral portion 41 of the packaging container 40 .
- Each ultrasonic sensor arranged in the receiving unit 28 converts the received ultrasonic wave into a detection signal that is an analog electric signal.
- the reception unit 28 then sends the detection signal of each ultrasonic sensor to the reception processing unit 25 .
- the ultrasonic sensors in the receiving section 28 are arranged one-dimensionally, they are arranged along the width direction of the peripheral portion 41 .
- the receiving unit 28 receives the ultrasonic waves transmitted from the transmitting unit 26 while moving the packaging container 40 relative to the receiving unit 28 in the longitudinal direction. As a result, the entire peripheral portion 41 is inspected.
- the ultrasonic sensors in the receiving section 28 are arranged two-dimensionally, for example, the receiving section 28 has a plurality of ultrasonic sensors so that the area of the receiving section 28 is approximately the same as the area of the peripheral portion 41. arranged in two dimensions.
- the packaging container 40 is conveyed by the conveying device 30 to a position where the area of the peripheral portion 41 and the area of the receiving portion 28 overlap, and the conveyance of the packaging container 40 is stopped.
- Ultrasonic waves are transmitted from the transmitter 26 and received by the receiver 28 . Whether the ultrasonic sensors in the receiving section 28 are arranged one-dimensionally or two-dimensionally, the entire area of the peripheral portion 41 can be inspected.
- the reception processing unit 25 acquires the analog detection signal received by the reception unit 28, performs signal amplification, equalization processing, etc., and converts the analog detection signal into a digital signal by performing AD (analog-digital) conversion. It is converted into a detection signal and sent to the signal control section 23 .
- the signal control unit 23 generates two-dimensional distribution data from the detection signals output from the reception processing unit 25, and generates an image based on this two-dimensional distribution data.
- the signal control unit 23 uses a value corresponding to the detection signal of one ultrasonic sensor as a pixel value, and calculates the pixel value for a two-dimensional area in the two-dimensional distribution data according to the position at which the detection signal is received.
- Two-dimensional distribution data is generated by arranging pixels having Note that pixel interpolation processing may be performed when the two-dimensional distribution data is generated from the detection signal of the receiving unit 28 .
- the seal width check the number of pixels (points) belonging to a certain reference range of the signal strength of the detection signal is counted in the width direction from the image of the two-dimensional distribution data generated from the detection signal of the receiving unit 28. It includes determining from the count value whether or not the joints of the packaging container 40 are of good quality.
- the width direction is the direction from the storage area 42 of the packaging container 40 toward the peripheral edge portion 41 as shown in FIG.
- the length direction is the direction along the outer circumference of the packaging container 40 .
- the width direction and the length direction are orthogonal.
- the number of points (the number of points) is an index indicating the length in the length direction and the length in the width direction in FIG.
- the number of pixels can be used. That is, the result of counting the number of pixels can be used as the number of points.
- the two-dimensional distribution data of the peripheral portion 41 to be inspected is generated from the detection signal from the reception processing unit 25, and based on this two-dimensional distribution data, the ultrasonic image display area 101 in FIG. An image as shown is generated. Therefore, the length in the longitudinal direction in FIG. 3 corresponds to the number of pixels in the horizontal direction of the image shown in the ultrasonic image display area 101, and the length in the width direction corresponds to the number of pixels in the vertical direction. Further, when the detection signal of the receiving unit 28 is interpolated, the number of points and the number of pixels correspond to each other.
- FIG. 4 is a flow chart showing processing performed in the seal width check in the ultrasonic inspection system 1 according to the embodiment.
- the signal control unit 23 causes the transmission unit 26 to transmit ultrasonic waves to the inspection area of the packaging container 40 and acquires a detection signal from the reception unit 28 .
- the signal control unit 23 reads the detection signals of the ultrasonic sensors arranged one-dimensionally or two-dimensionally from the receiving unit 28 by scanning each line.
- Step S102 The signal control unit 23 sets a color according to the signal intensity of the detection signal of each sensor of the receiving unit 28, and generates two-dimensional distribution data.
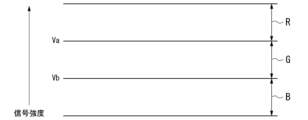
- FIG. 5 is a diagram showing the relationship between signal strength and set color signals.
- the corresponding portion when the signal strength is Va or more, the corresponding portion is set to red (R), and when the signal strength is less than Va but is Vb or more, the corresponding portion is set to green ( G), and when the signal intensity is less than Vb, the corresponding portion is set to blue (B), and an RGB image is generated from the two-dimensional distribution data.
- R red
- G green
- B blue
- Step S103 The signal control unit 23 counts the number of points of a specific color (for example, green or blue) along the width direction of the inspection area from the generated two-dimensional distribution data image.
- a specific color for example, green or blue
- Step S104 The signal control unit 23 compares the count value obtained by counting the portions of the specific color in the width direction with the reference value, and performs pass/fail determination based on the comparison result.
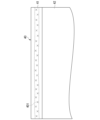
- FIG. 6A is assumed that a gap 402 is generated at a joint portion 401 when the peripheral portion 41 of the packaging container 40 is joined.
- Two-dimensional distribution data is generated from the detection signal of the receiving unit 28 for the peripheral portion 41 of the packaging container 40, and an image 110a of the ultrasonic image display area 101 is generated.
- the corresponding portion is set to red (R)
- the corresponding portion is set to green (G )
- the corresponding portion is set to blue (B) to generate an RGB image.
- the intensity of transmitted ultrasonic waves differs depending on whether or not there is a defect in the inspection area. Therefore, when the two-dimensional distribution data is generated from the detection signal of the receiving unit 28 obtained from the packaging container 40 as shown in FIG. 6A, an image 110a as shown in FIG. 6B is generated. That is, the portion of the joint portion 401 of the peripheral edge portion 41 of the packaging container 40 where the joint is sufficiently performed becomes green (G) because the detection signal is greater than or equal to the predetermined value. The portion of the image 111 corresponding to the gap 402 is blue (B) because the detection signal is weak.
- the presence or absence of such defects can be determined by whether or not the length of the green color in the width direction is equal to or less than the standard value. That is, as shown in FIG. 6B, when the length in the width direction of the green (G) portion (where the signal intensity is in the first range (Va to Vb)) in the image of the inspection area is measured, the gap 402 is In the portion where the gap 402 is not generated, the length La in the width direction is equal to or greater than the reference value Lth (first reference value) (La ⁇ Lth). Lb is less than the reference value Lth (Lb ⁇ Lth). Therefore, by counting the portions of a specific color (for example, green) in the width direction and comparing the count value with the reference value Lth, it is possible to determine the quality. That is, in this example, when the count value in the width direction of the green portion is equal to or less than the reference value Lth, it can be determined as defective.
- Lth first reference value
- the number of points belonging to the green (G) area is counted in the width direction, and the pass/fail determination is performed based on this count value, but the present disclosure is not limited to such an example.
- the number of points belonging to the blue (B) area may be counted in the width direction, and the pass/fail judgment may be performed based on this count value. In this case, when the count value in the width direction of the blue (B) portion is greater than or equal to the reference value, it can be determined that the quality is defective.
- a defect such as a gap 402 occurring in the joint 401 can be detected.
- a defect in the joint 401 can be detected by checking the seal width. .
- a determination target area is set in the image of the two-dimensional distribution data generated from the detection signal of the receiving unit 28, and the total number of count values of points belonging to a specific color within the determination target area is It is determined whether the quality of the bonding state of the container 40 is good.
- the processing shown in the flowchart below is performed.
- FIG. 7 is a flow chart showing processing in area check in this embodiment.
- the signal control unit 23 causes the transmission unit 26 to transmit ultrasonic waves to the inspection area of the packaging container 40 and acquires a detection signal from the reception unit 28 .
- the reception unit 28 scans and reads the detection signals of the ultrasonic sensors arranged one-dimensionally or two-dimensionally line by line.
- Step S202 The signal control unit 23 sets a color according to the signal intensity of the detection signal of each sensor of the receiving unit 28, and generates two-dimensional distribution data.
- the signal strength is Va or more
- it is set to red
- when the signal strength is less than Vb is set to blue to generate an image of two-dimensional distribution data consisting of RGB.
- Step S203 The signal control unit 23 sets a determination target area and counts the number of points of a specific color within the determination target area.
- Step S204 The signal control unit 23 compares the number of points of the portion of the specific color within the determination target area with the reference value, and determines whether the quality is good.
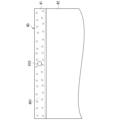
- Figs. 8A and 8B are explanatory diagrams of the area check.
- the width of the joint portion 401 in the width direction is about half or less in the width direction, and such a narrow joint portion spreads over the entire length direction. . Therefore, in the peripheral portion 41, the bonding is insufficient as a whole.
- quality determination is performed based on the area of a specific color (for example, green (G)) in the determination target area.
- the ultrasonic image display area 101 as shown in FIG. Image 110b is displayed.
- a determination target area AR is set, and the number of points in the green (G) region (the portion where the signal strength is less than Va and equal to or greater than Vb) in this determination target area AR is calculated.
- a process of counting and comparing the number of pixels with a reference value (second reference value) is performed. Whether or not the quality is good is determined based on the comparison result between the number of points in the green (G) region in the determination target area AR and the reference value.
- the number of points in the green (G) region in the determination target area AR is equal to or greater than the reference value, it can be determined as a non-defective product, and if the number of points of the count value is less than the reference value, it can be determined as defective.
- the acceptable limit for a non-defective product in the area check can be set by changing the set value of the reference value.
- the determination target area AR may be a predetermined area. More specifically, the size of the determination target area AR may be a predetermined size. The position where the determination target area AR is set may be set at a predetermined position in the inspection area. Also, the size and position of the determination target area AR may be changed. Moreover, the packaging container 40 is not always placed in the same position. If the position of the packaging container 40 shifts, the position of the determination target area AR with respect to the joint 401 under inspection will move. Therefore, the position of the determination target area AR may be moved so as to follow the position of the packaging container 40 .
- the number of points belonging to the green (G) area within the determination target area AR is counted and the number of points is compared with the reference value. You may count the points that belong.
- the number of points belonging to blue (B) in the determination target area AR is compared with a reference value, and if the number of points is equal to or greater than the reference value, it can be determined as defective.
- the area check can detect various defects by setting the determination target area. This will be explained below.
- Figs. 9A and 9B are explanatory diagrams of the setting of the determination target area.
- FIG. 9A when the peripheral portion 41 of the packaging container 40 is joined, it is assumed that food ingredients such as soup may enter the joint 401 of the peripheral portion 41 and cause a defective portion 410 due to air bubbles. be done.
- Such a defect can be detected by appropriately setting a determination target area AR and determining the area of a portion having a specific color within the determination target area AR.
- the image portion 112 corresponding to the defective portion 410 is blue (B).
- An area AR is set as a determination target area AR, and a process of counting the number of points belonging to a blue (B) area within the determination target area AR is performed.
- the number of points belonging to the blue (B) region in the determination target area AR is compared with the reference value, and the quality determination is performed according to the comparison result.
- an area belonging to blue (B) in an area belonging to green (G) is set as a determination target area AR, and points belonging to a blue (B) area within this determination target area AR are counted, the count value corresponds to the area of the defective portion 410 . Therefore, if the number of points belonging to the blue (B) area in the determination target area AR is greater than the reference value, it can be determined that the defective part 410 having a large area is present and the product is defective.
- the correlation check uses the correlation between the two-dimensional distribution data of the good sample packaging container and the two-dimensional distribution data representing the inspection result to determine whether the bonding state of the packaging container 40 is of good quality.
- the processing shown in the flowchart below is performed.
- FIG. 10 is a flowchart showing processing in correlation check in this embodiment.
- the signal control unit 23 causes the transmission unit 26 to transmit ultrasonic waves to the joint 401 of the packaging container 40 and acquires a detection signal from the reception unit 28 .
- the reception unit 28 scans and reads the detection signals of the ultrasonic sensors arranged one-dimensionally or two-dimensionally line by line.
- Step S302 The signal control unit 23 sets a color according to the signal intensity of the detection signal of each sensor of the receiving unit 28, and generates two-dimensional distribution data.
- the corresponding portion is set to red (R)
- the corresponding portion is set to green (G)
- the corresponding portion is set to blue (B) to generate two-dimensional distribution data.
- Step S303 The signal control unit 23 reads the reference data image, and determines the correlation between the two-dimensional distribution data image generated from the detection signal of the receiving unit 28 and the reference data image.
- Step S304 The signal control unit 23 determines whether the quality of the joint 401 is good based on the correlation value between the image of the two-dimensional distribution data generated from the detection signal of the receiving unit 28 and the image of the reference data. judge.
- FIGS. 11A and 11B are explanatory diagrams of the correlation check.
- quality inspection is performed for each product.
- a non-defective packaging container 40a for each product is prepared in advance as a sample.
- an image 110d of the two-dimensional distribution data of the reference pattern for the non-defective product is generated and stored in advance using the joint portion 401a of the peripheral edge portion 41a of the sample non-defective packaging container 40a. be done.
- the signal control unit 23 reads out the image 110d of the two-dimensional distribution data of the reference pattern, and compares the image of the two-dimensional distribution data generated from the detection signal of the receiving unit 28 with the two-dimensional distribution data of the reference pattern. A correlation with the image 110d is obtained. Then, if the correlation value is large, the signal control unit 23 determines that the product is non-defective.
- Judgment in the correlation check is performed, for example, by shifting the image of the two-dimensional distribution data generated from the detection signal of the receiving unit 28 in the vertical direction and the horizontal direction relative to the image 110d of the two-dimensional distribution data of the reference pattern.
- the image 110d of the two-dimensional distribution data of the reference pattern and the image of the two-dimensional distribution data generated from the detection signal of the receiving unit 28 are multiplied for each pixel at the corresponding position, and the multiplied value is integrated. .
- both two-dimensional distribution data By multiplying and integrating each pixel at the corresponding position, a large integrated value is obtained at the position where the patterns of the two-dimensional distribution data of both are approximately the same.
- the image of the two-dimensional distribution data of the reference pattern is moved vertically and horizontally relative to the image of the two-dimensional distribution data generated from the detection signal of the receiving unit 28.
- the correlation between the image of the two-dimensional distribution data generated from the detection signal of the receiving unit 28 and the image of the reference pattern is obtained, but the present disclosure is not limited to such an example.
- the correlation between the generated histogram of the two-dimensional distribution data image and the histogram of the reference pattern image may be obtained. Correlations with histograms can further detect various defects.
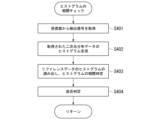
- FIG. 12 is a flow chart showing the processing when the histogram correlation is obtained in the correlation check in this embodiment.
- the signal control unit 23 causes the transmission unit 26 to transmit ultrasonic waves to the inspection area of the packaging container 40 and acquires a detection signal from the reception unit 28 .
- the reception unit 28 scans and reads the detection signals of the ultrasonic sensors arranged one-dimensionally or two-dimensionally line by line.
- Step S402 The signal control unit 23 generates a histogram corresponding to the signal intensity from the image of the two-dimensional distribution data obtained from the detection signals of the sensors of the receiving unit 28.
- Step S403 The signal control unit 23 reads the histogram of the reference data image prepared in advance, and calculates the correlation between the generated histogram of the two-dimensional distribution data image and the histogram of the reference data image.
- Step S404 The signal control unit 23 determines that the quality of the joint 401 is good based on the correlation value between the histogram of the image of the two-dimensional distribution data generated from the detection signal of the receiving unit 28 and the histogram of the image of the reference data. Determine whether or not
- FIGS. 13A, 13B, and 13C are explanatory diagrams of pass/fail judgment using histogram correlation.
- FIG. 13A when the peripheral edge portion 41b of the packaging container 40b is joined, the degree of welding at the joint portion 401b is excessive, and may exceed the degree of welding at which a non-defective product can be determined. is assumed. Such defects can be detected by using a correlation with the histogram of the reference pattern.
- the fiber component of the material when a certain material is used as the packaging container 40b, the fiber component of the material usually remains after welding the joint portion. On the other hand, if the welded portion is excessively welded, it is considered that the fibers of the material are melted out.
- the transmittance of ultrasonic waves differs between the case where the fiber component of the material remains and the case where the fiber component of the material melts out. For this reason, the histogram of the image of the two-dimensional distribution data obtained from the detection signal of the receiving unit 28 differs between the normal joint and the excessively welded joint. For example, at the joint 401a of the sample packaging container 40a shown in FIG. 11A, the histogram of the image of the two-dimensional distribution data of the signal from the receiver 28 is as shown in FIG.
- the histogram of the image of the two-dimensional distribution data of the signal from the receiving unit 28 is as shown in FIG. 13C.
- the horizontal axis indicates the signal level
- the vertical axis indicates the frequency.
- a high-quality packaging container (reference object serving as a reference) 40a is prepared in advance as a sample. Then, using the non-defective packaging container 40a as a sample, a histogram of the two-dimensional distribution data of the reference pattern as shown in FIG. 13B is generated in advance and saved.
- the histogram of the image of the two-dimensional distribution data generated from the detection signal of the receiving unit 28 and the reference pattern of the sample packaging container 40a as shown in FIG. 13B The correlation with the histogram of the image is obtained, and if the correlation value is large, the product is determined to be non-defective.
- the correlation check can detect various types of defects and determine whether the quality of the joint is good. Further, by detecting the correlation of the histogram of the reference data, it is possible to detect defects such as excessive welding of the joint portion. Furthermore, by using machine learning, various defects can be detected from the two-dimensional distribution data generated from the detection signal of the receiving section 28 .
- a model for judging whether or not the quality of the joint is good is created from the two-dimensional distribution data generated from the detection signal of the receiving unit 28, and learning of this model (for example, machine learning) takes place. Then, the signal control unit 23 inputs the two-dimensional distribution data generated from the detection signal of the receiving unit 28 to the trained model, thereby obtaining the determination result of determining whether the quality of the joint is good or not. be able to. Further, when obtaining a trained model, a plurality of two-dimensional distribution data of inspection results determined to be non-defective may be collected, and the trained model may be generated by learning these two-dimensional distribution data as teacher data. .
- the quality of the joint is good. It is possible to obtain a determination result of determining whether or not.
- the correlation between the two-dimensional distribution data generated from the detection signal of the receiving unit 28 and the two-dimensional distribution data based on the trained model, or generated from the detection signal of the receiving unit 28 The determination may be made based on the histogram relationship between the obtained two-dimensional distribution data and the two-dimensional distribution data based on the trained model.
- the ultrasonic inspection system 1 performs seal width check, area check, and correlation check. Based on at least one of these determination results, the control unit 22 can make a comprehensive pass/fail determination and notify the user through the display device 10 .
- FIG. 14 is a flow chart showing pass/fail determination processing in the ultrasonic inspection system 1 in the embodiment.
- the control unit 22 displays on the display device 10 an image generated from the two-dimensional distribution data generated from the detection signal of the receiving unit 28 .
- Step S502 The signal control unit 23 checks the seal width using the two-dimensional distribution data generated from the detection signal of the reception unit 28, and sends the result to the control unit 22.
- Step S503 The control unit 22 displays the inspection result of the seal width check on the display device 10.
- Step S504 The signal control unit 23 performs an area check using the two-dimensional distribution data generated from the detection signal of the reception unit 28, and sends the result to the control unit 22.
- Step S505 The control unit 22 displays the inspection result of the area check on the display device 10.
- Step S506 The signal control unit 23 performs a correlation check using the two-dimensional distribution data generated from the detection signal of the reception unit 28, and sends the result to the control unit 22.
- Step S507 The control unit 22 displays the inspection result of the correlation check on the display device 10.
- Step S508 The signal control unit 23 makes a comprehensive pass/fail determination based on at least one of the result of the seal width check, the result of the area check, and the result of the correlation check. displays the overall determination result on the display device 10 .
- the seal width check, the area check, and the correlation check are performed, and comprehensive quality determination is performed based on these check results.
- the display screen of the display device 10 displays an image (ultrasonic image display area 101) based on the two-dimensional distribution data being inspected, as well as a seal width check, an area check, and a correlation check. Inspection items and inspection results (judgment results 103a to 103c, total judgment result 103d) are displayed.
- a comprehensive quality determination is performed based on a combination of the seal width check result, the area check result, and the correlation check result, so a highly reliable quality determination can be performed.
- the determination result 103a of the seal width check, the determination result 103b of the area check, and the determination result 103c of the correlation check are displayed, the user can understand what factors led to the quality determination. It is easy to deal with pass/fail judgments.
- At least one of the three determination results of the seal width check result, the area check result, and the correlation check should be used.
- a weighting coefficient may be assigned to each of these three determination results, and an evaluation value may be calculated by weighted addition of these three determination results to perform comprehensive pass/fail determination.
- the packaging container 40 is a packaging container such as a retort pouch, but a battery pack may be the inspection object.
- the intensity of the burst wave that is emitted from the ultrasonic generator and penetrates the test object depends on whether there is a difference in the acoustic impedance of the test object (lithium-ion battery) in the irradiation direction. Varies accordingly.
- the burst wave is reflected at the interface between the electrolyte and the bubbles because the difference in acoustic impedance between the electrolyte and the bubbles is large (high intensity).
- the intensity of acoustic impedance is defined as the overlapping ratio of the interface between layers with greatly different acoustic impedances (for example, each layer of electrolyte and bubbles) with respect to the burst wave irradiation area at the measurement point.
- the transmittance of ultrasonic waves with respect to the object to be inspected corresponds to the strength of the acoustic impedance. If the strength of the acoustic impedance is large, the transmittance decreases, and if the strength of the acoustic impedance is small, the transmittance increases. The lower the transmittance, the lower the received intensity. The higher the transmittance, the higher the received intensity.
- the present disclosure may be applied to inspection methods and inspection apparatuses.
Landscapes
- Physics & Mathematics (AREA)
- Engineering & Computer Science (AREA)
- General Physics & Mathematics (AREA)
- Health & Medical Sciences (AREA)
- Life Sciences & Earth Sciences (AREA)
- Pathology (AREA)
- Immunology (AREA)
- General Health & Medical Sciences (AREA)
- Biochemistry (AREA)
- Analytical Chemistry (AREA)
- Chemical & Material Sciences (AREA)
- Signal Processing (AREA)
- Acoustics & Sound (AREA)
- Software Systems (AREA)
- Artificial Intelligence (AREA)
- Theoretical Computer Science (AREA)
- Evolutionary Computation (AREA)
- Mathematical Physics (AREA)
- Computer Vision & Pattern Recognition (AREA)
- Data Mining & Analysis (AREA)
- Computing Systems (AREA)
- Medical Informatics (AREA)
- General Engineering & Computer Science (AREA)
- Algebra (AREA)
- Mathematical Analysis (AREA)
- Mathematical Optimization (AREA)
- Pure & Applied Mathematics (AREA)
- Investigating Or Analyzing Materials By The Use Of Ultrasonic Waves (AREA)
Abstract
Description
この出願は、2021年10月29日に出願された日本国特願2021-178076号を基礎とする優先権を主張し、その開示の全てをここに取り込む。
信号制御部23は、受信処理部25から出力された検出信号から二次元分布データを生成し、この二次元分布データに基づいて画像を生成する。ここでは、信号制御部23は、1つの超音波センサの検出信号に応じた値を画素値として用い、二次元分布データにおける二次元の領域に対し、検出信号が受信された位置に従ってその画素値を有する画素を配置することによって、二次元分布データを生成する。なお、受信部28の検出信号から二次元分布データを生成する際、画素の補間処理を行っても良い。
(ステップS101)信号制御部23は、送信部26により包装容器40の検査領域に超音波を送信させ、受信部28からの検出信号を取得する。ここでは、信号制御部23は、受信部28から、一次元または二次元に配列された各超音波センサの検出信号をラインごとにスキャンすることで読み出す。
(ステップS201)信号制御部23は、送信部26により包装容器40の検査領域に超音波を送信させ、受信部28からの検出信号を取得する。前述したように、受信部28からは、一次元または二次元に配列された各超音波センサの検出信号がラインごとにスキャンして読み出される。
(ステップS301)信号制御部23は、送信部26により包装容器40の接合箇所401に超音波を送信させ、受信部28からの検出信号を取得する。前述したように、受信部28からは、一次元または二次元に配列された各超音波センサの検出信号がラインごとにスキャンして読み出される。
(ステップS401)信号制御部23は、送信部26により包装容器40の検査領域に超音波を送信させ、受信部28からの検出信号を取得する。前述したように、受信部28からは、一次元または二次元に配列された各超音波センサの検出信号がラインごとにスキャンして読み出される。
また、学習済みモデルを得る場合、良品と判定された検査結果における二次元分布データを複数収集し、これら二次元分布データを教師データとして学習させることで学習済みモデルを生成するようにしてもよい。そして、良品と判定された二次元分布データ(基準二次元分布データ)を学習した学習済みモデルを用いて、受信部28の検出信号から生成された二次元分布データにおいて、接合箇所の品質が良いか否かを判定した判定結果を得ることができる。
これら学習済みモデルを用いて良否判定をする場合、受信部28の検出信号から生成された二次元分布データと学習済みモデルに基づく二次元分布データとの相関または、受信部28の検出信号から生成された二次元分布データと学習済みモデルに基づく二次元分布データとのヒストグラムの関係に基づいて判定してもよい。
(ステップS501)制御部22は、受信部28の検出信号から生成された二次元分布データから生成された画像を表示装置10に表示する。
20…超音波検査装置
26…送信部
28…受信部
40…包装容器
41…周縁部
Claims (10)
- 検査対象の検査領域に含まれ第一および第二方向に沿って並ぶ複数の位置にそれぞれ対応し、それぞれが前記検査領域に照射された超音波の受信に応じた信号の強度を示す複数の信号強度を取得し、
前記複数の位置と前記複数の信号強度との関係を表す二次元分布データを生成し、
前記二次元分布データを用いて、前記複数の位置のうち、前記第二方向に沿って並び、かつ第1範囲に含まれる強度を示す前記信号強度に対応付けられている位置の個数をカウントし、
前記カウントされた結果と第1基準値との比較結果に基づいて、前記検査対象の品質を判定する
ことを含む検査方法。 - 検査対象の検査領域に含まれ第一および第二方向に沿って並ぶ複数の位置にそれぞれ対応し、それぞれが前記検査領域に照射された超音波の受信に応じた信号の強度を示す複数の信号強度を取得し、
前記複数の位置と前記複数の信号強度との関係を表す二次元分布データを生成し、
前記二次元分布データを用いて、前記複数の位置のうち、判定対象エリアに含まれ、かつ第1範囲に含まれる強度を示す前記信号強度に対応付けられている位置の個数をカウントし、
前記カウントされた結果と第2基準値との比較結果に基づいて、前記検査対象の品質を判定する
ことを含む検査方法。 - 前記判定対象エリアは、予め決められたエリアである請求項2に記載の検査方法。
- 検査対象の検査領域に含まれ第一および第二方向に沿って並ぶ複数の位置にそれぞれ対応し、それぞれが前記検査領域に照射された超音波の受信に応じた信号の強度を示す複数の信号強度を取得し、
前記複数の位置と前記複数の信号強度との関係を表す二次元分布データを生成し、
前記二次元分布データと、基準となる基準対象を用いて生成された基準二次元分布データを学習することにより生成された学習済みモデルに基づいて前記検査対象の品質を判定する
ことを含む検査方法。 - 前記二次元分布データと前記基準二次元分布データとの相関に基づいて前記検査対象の品質を判定する請求項4に記載の検査方法。
- 前記二次元分布データのヒストグラムと前記基準二次元分布データのヒストグラムとの関係から、前記検査対象の品質を判定する請求項4に記載の検査方法。
- 前記学習済みモデルは、前記基準二次元分布データを教師データとして機械学習を行うことで得られた学習済みモデルである請求項4に記載の検査方法。
- 請求項1から請求項7のうち少なくともいずれか1つの検査方法に基づく検査項目と、その検査項目の結果と、前記二次元分布データと、を表示装置に表示する
ことを含む検査方法。 - 前記第一方向は、前記検査領域の長さ方向であり、
前記第二方向は、前記検査領域の長さ方向と直交する前記検査領域の幅方向である、
請求項1から請求項8のうちいずれか1項に記載の検査方法。 - 請求項1から請求項9のうちいずれか1項に記載の検査方法を実行する検査装置。
Priority Applications (4)
| Application Number | Priority Date | Filing Date | Title |
|---|---|---|---|
| CN202280068769.XA CN118202242A (zh) | 2021-10-29 | 2022-10-25 | 检查方法及检查装置 |
| KR1020247011871A KR20240054381A (ko) | 2021-10-29 | 2022-10-25 | 검사 방법 및 검사 장치 |
| EP22887011.9A EP4425172A4 (en) | 2021-10-29 | 2022-10-25 | INSPECTION PROCEDURE AND INSPECTION DEVICE |
| US18/641,925 US20240272125A1 (en) | 2021-10-29 | 2024-04-22 | Inspection method and inspecting device |
Applications Claiming Priority (2)
| Application Number | Priority Date | Filing Date | Title |
|---|---|---|---|
| JP2021-178076 | 2021-10-29 | ||
| JP2021178076A JP2023067095A (ja) | 2021-10-29 | 2021-10-29 | 検査方法及び検査装置 |
Related Child Applications (1)
| Application Number | Title | Priority Date | Filing Date |
|---|---|---|---|
| US18/641,925 Continuation US20240272125A1 (en) | 2021-10-29 | 2024-04-22 | Inspection method and inspecting device |
Publications (1)
| Publication Number | Publication Date |
|---|---|
| WO2023074685A1 true WO2023074685A1 (ja) | 2023-05-04 |
Family
ID=86157931
Family Applications (1)
| Application Number | Title | Priority Date | Filing Date |
|---|---|---|---|
| PCT/JP2022/039729 Ceased WO2023074685A1 (ja) | 2021-10-29 | 2022-10-25 | 検査方法及び検査装置 |
Country Status (7)
| Country | Link |
|---|---|
| US (1) | US20240272125A1 (ja) |
| EP (1) | EP4425172A4 (ja) |
| JP (1) | JP2023067095A (ja) |
| KR (1) | KR20240054381A (ja) |
| CN (1) | CN118202242A (ja) |
| TW (1) | TWI834357B (ja) |
| WO (1) | WO2023074685A1 (ja) |
Families Citing this family (1)
| Publication number | Priority date | Publication date | Assignee | Title |
|---|---|---|---|---|
| WO2025164127A1 (ja) * | 2024-02-01 | 2025-08-07 | ヤマハファインテック株式会社 | 検査方法、検査装置およびプログラム |
Citations (8)
| Publication number | Priority date | Publication date | Assignee | Title |
|---|---|---|---|---|
| JP2004279144A (ja) * | 2003-03-14 | 2004-10-07 | Hitachi Ltd | 超音波検査方法及び装置 |
| WO2015050061A1 (ja) * | 2013-10-02 | 2015-04-09 | ヤマハファインテック株式会社 | 密封パック製品の検査装置及び検査方法 |
| JP2018040630A (ja) * | 2016-09-06 | 2018-03-15 | 国立大学法人東北大学 | 探傷装置 |
| JP2018054354A (ja) * | 2016-09-27 | 2018-04-05 | 株式会社東芝 | 超音波探傷装置、データ処理装置および超音波探傷方法 |
| JP2020027012A (ja) | 2018-08-10 | 2020-02-20 | ヤマハファインテック株式会社 | 超音波検査装置、及び超音波検査方法 |
| JP2020153750A (ja) * | 2019-03-19 | 2020-09-24 | 株式会社東芝 | 検査方法、検査装置、検査システム及びコンピュータプログラム |
| JP2021156644A (ja) * | 2020-03-25 | 2021-10-07 | 三菱電機株式会社 | コネクタ検査装置、コネクタ検査方法、及びプログラム |
| JP2021178076A (ja) | 2020-05-15 | 2021-11-18 | 日立グローバルライフソリューションズ株式会社 | 炊飯器 |
Family Cites Families (7)
| Publication number | Priority date | Publication date | Assignee | Title |
|---|---|---|---|---|
| US6220099B1 (en) * | 1998-02-17 | 2001-04-24 | Ce Nuclear Power Llc | Apparatus and method for performing non-destructive inspections of large area aircraft structures |
| JP5618529B2 (ja) * | 2009-12-04 | 2014-11-05 | 株式会社東芝 | 三次元超音波検査装置 |
| EP3553561B1 (en) * | 2011-09-26 | 2024-07-24 | Ontario Power Generation Inc. | Ultrasound matrix inspection |
| JP6300999B1 (ja) * | 2017-10-30 | 2018-03-28 | 三菱日立パワーシステムズ検査株式会社 | 超音波探傷データ処理プログラム、超音波探傷データ処理装置及び被検体の評価方法 |
| CN110231129A (zh) * | 2018-11-29 | 2019-09-13 | 南京工业大学 | 一种压力容器密封检验装置及检测方法 |
| CN110223790B (zh) * | 2019-07-02 | 2024-09-20 | 华北电力大学 | 一种熔融物堆内滞留压力容器外部冷却试验台架 |
| JP7317747B2 (ja) * | 2020-02-28 | 2023-07-31 | 株式会社Ihiエアロスペース | 検査装置および検査方法 |
-
2021
- 2021-10-29 JP JP2021178076A patent/JP2023067095A/ja active Pending
-
2022
- 2022-10-25 KR KR1020247011871A patent/KR20240054381A/ko active Pending
- 2022-10-25 CN CN202280068769.XA patent/CN118202242A/zh active Pending
- 2022-10-25 EP EP22887011.9A patent/EP4425172A4/en active Pending
- 2022-10-25 WO PCT/JP2022/039729 patent/WO2023074685A1/ja not_active Ceased
- 2022-10-27 TW TW111140799A patent/TWI834357B/zh active
-
2024
- 2024-04-22 US US18/641,925 patent/US20240272125A1/en active Pending
Patent Citations (8)
| Publication number | Priority date | Publication date | Assignee | Title |
|---|---|---|---|---|
| JP2004279144A (ja) * | 2003-03-14 | 2004-10-07 | Hitachi Ltd | 超音波検査方法及び装置 |
| WO2015050061A1 (ja) * | 2013-10-02 | 2015-04-09 | ヤマハファインテック株式会社 | 密封パック製品の検査装置及び検査方法 |
| JP2018040630A (ja) * | 2016-09-06 | 2018-03-15 | 国立大学法人東北大学 | 探傷装置 |
| JP2018054354A (ja) * | 2016-09-27 | 2018-04-05 | 株式会社東芝 | 超音波探傷装置、データ処理装置および超音波探傷方法 |
| JP2020027012A (ja) | 2018-08-10 | 2020-02-20 | ヤマハファインテック株式会社 | 超音波検査装置、及び超音波検査方法 |
| JP2020153750A (ja) * | 2019-03-19 | 2020-09-24 | 株式会社東芝 | 検査方法、検査装置、検査システム及びコンピュータプログラム |
| JP2021156644A (ja) * | 2020-03-25 | 2021-10-07 | 三菱電機株式会社 | コネクタ検査装置、コネクタ検査方法、及びプログラム |
| JP2021178076A (ja) | 2020-05-15 | 2021-11-18 | 日立グローバルライフソリューションズ株式会社 | 炊飯器 |
Non-Patent Citations (1)
| Title |
|---|
| See also references of EP4425172A4 |
Also Published As
| Publication number | Publication date |
|---|---|
| TW202317984A (zh) | 2023-05-01 |
| JP2023067095A (ja) | 2023-05-16 |
| EP4425172A4 (en) | 2025-10-29 |
| KR20240054381A (ko) | 2024-04-25 |
| TWI834357B (zh) | 2024-03-01 |
| US20240272125A1 (en) | 2024-08-15 |
| EP4425172A1 (en) | 2024-09-04 |
| CN118202242A (zh) | 2024-06-14 |
Similar Documents
| Publication | Publication Date | Title |
|---|---|---|
| JP5392731B2 (ja) | 超音波探傷検査の判定支援装置、判定支援方法、判定支援プログラム、及び該判定支援プログラムを記録したコンピュータ読取可能な記録媒体 | |
| US8483475B2 (en) | Inspection apparatus | |
| JP2019164156A (ja) | 検査装置 | |
| JP6537008B1 (ja) | 検査装置 | |
| JP2013122455A (ja) | たばこの生産中及び/又は包装中に検査すべき対象物を光学的に検査する方法及び装置 | |
| KR100451537B1 (ko) | 방사선 검사장치 및 방사선 검사방법 | |
| TWI834357B (zh) | 檢查方法及檢查裝置 | |
| KR20020081074A (ko) | 방사선 검사장치 및 방사선 검사방법 | |
| WO2016063381A1 (ja) | 電磁波検知部と光学検知部を使用した検査装置 | |
| JP6188620B2 (ja) | 検査装置及びptp包装機 | |
| JP2015137858A (ja) | 検査装置 | |
| JP5769315B2 (ja) | 超音波探傷方法 | |
| TWI712793B (zh) | 超音波檢查裝置及超音波檢查方法 | |
| JP2005031069A (ja) | X線検査装置 | |
| JP2006214814A (ja) | 検査装置及びptp包装機 | |
| KR101844926B1 (ko) | 비접촉식 초음파 자동 검사 장치 | |
| JP2009080030A (ja) | X線検査装置 | |
| JP2007183200A (ja) | X線検査装置及び物品検査装置 | |
| JP2008175691A (ja) | X線検査装置および検査方法 | |
| JP7142825B1 (ja) | 画像判定方法及び画像判定システム | |
| JP2016090494A (ja) | X線検査装置 | |
| JP2020003297A (ja) | 圧縮製剤の検査装置および圧縮製剤の検査方法 | |
| JP5821881B2 (ja) | 超音波探傷装置および超音波探傷方法 | |
| JP2025177068A (ja) | 超音波探傷装置及び超音波探傷方法 | |
| JP2011021920A (ja) | X線検査装置 |
Legal Events
| Date | Code | Title | Description |
|---|---|---|---|
| 121 | Ep: the epo has been informed by wipo that ep was designated in this application |
Ref document number: 22887011 Country of ref document: EP Kind code of ref document: A1 |
|
| ENP | Entry into the national phase |
Ref document number: 20247011871 Country of ref document: KR Kind code of ref document: A |
|
| WWE | Wipo information: entry into national phase |
Ref document number: 202280068769.X Country of ref document: CN |
|
| WWE | Wipo information: entry into national phase |
Ref document number: 2022887011 Country of ref document: EP |
|
| NENP | Non-entry into the national phase |
Ref country code: DE |
|
| ENP | Entry into the national phase |
Ref document number: 2022887011 Country of ref document: EP Effective date: 20240529 |