WO2023219037A1 - 予測装置、材料設計システム、予測方法及び予測プログラム - Google Patents
予測装置、材料設計システム、予測方法及び予測プログラム Download PDFInfo
- Publication number
- WO2023219037A1 WO2023219037A1 PCT/JP2023/017086 JP2023017086W WO2023219037A1 WO 2023219037 A1 WO2023219037 A1 WO 2023219037A1 JP 2023017086 W JP2023017086 W JP 2023017086W WO 2023219037 A1 WO2023219037 A1 WO 2023219037A1
- Authority
- WO
- WIPO (PCT)
- Prior art keywords
- data
- prediction
- target data
- prediction target
- learning
- Prior art date
- Legal status (The legal status is an assumption and is not a legal conclusion. Google has not performed a legal analysis and makes no representation as to the accuracy of the status listed.)
- Ceased
Links
Images





Classifications
-
- G—PHYSICS
- G06—COMPUTING OR CALCULATING; COUNTING
- G06F—ELECTRIC DIGITAL DATA PROCESSING
- G06F30/00—Computer-aided design [CAD]
- G06F30/20—Design optimisation, verification or simulation
- G06F30/27—Design optimisation, verification or simulation using machine learning, e.g. artificial intelligence, neural networks, support vector machines [SVM] or training a model
-
- G—PHYSICS
- G06—COMPUTING OR CALCULATING; COUNTING
- G06Q—INFORMATION AND COMMUNICATION TECHNOLOGY [ICT] SPECIALLY ADAPTED FOR ADMINISTRATIVE, COMMERCIAL, FINANCIAL, MANAGERIAL OR SUPERVISORY PURPOSES; SYSTEMS OR METHODS SPECIALLY ADAPTED FOR ADMINISTRATIVE, COMMERCIAL, FINANCIAL, MANAGERIAL OR SUPERVISORY PURPOSES, NOT OTHERWISE PROVIDED FOR
- G06Q10/00—Administration; Management
- G06Q10/04—Forecasting or optimisation specially adapted for administrative or management purposes, e.g. linear programming or "cutting stock problem"
-
- G—PHYSICS
- G06—COMPUTING OR CALCULATING; COUNTING
- G06N—COMPUTING ARRANGEMENTS BASED ON SPECIFIC COMPUTATIONAL MODELS
- G06N20/00—Machine learning
-
- G—PHYSICS
- G06—COMPUTING OR CALCULATING; COUNTING
- G06N—COMPUTING ARRANGEMENTS BASED ON SPECIFIC COMPUTATIONAL MODELS
- G06N20/00—Machine learning
- G06N20/10—Machine learning using kernel methods, e.g. support vector machines [SVM]
-
- G—PHYSICS
- G06—COMPUTING OR CALCULATING; COUNTING
- G06N—COMPUTING ARRANGEMENTS BASED ON SPECIFIC COMPUTATIONAL MODELS
- G06N20/00—Machine learning
- G06N20/20—Ensemble learning
-
- G—PHYSICS
- G06—COMPUTING OR CALCULATING; COUNTING
- G06N—COMPUTING ARRANGEMENTS BASED ON SPECIFIC COMPUTATIONAL MODELS
- G06N3/00—Computing arrangements based on biological models
- G06N3/02—Neural networks
- G06N3/04—Architecture, e.g. interconnection topology
- G06N3/044—Recurrent networks, e.g. Hopfield networks
-
- G—PHYSICS
- G06—COMPUTING OR CALCULATING; COUNTING
- G06N—COMPUTING ARRANGEMENTS BASED ON SPECIFIC COMPUTATIONAL MODELS
- G06N3/00—Computing arrangements based on biological models
- G06N3/02—Neural networks
- G06N3/04—Architecture, e.g. interconnection topology
- G06N3/045—Combinations of networks
-
- G—PHYSICS
- G06—COMPUTING OR CALCULATING; COUNTING
- G06N—COMPUTING ARRANGEMENTS BASED ON SPECIFIC COMPUTATIONAL MODELS
- G06N3/00—Computing arrangements based on biological models
- G06N3/02—Neural networks
- G06N3/08—Learning methods
-
- G—PHYSICS
- G06—COMPUTING OR CALCULATING; COUNTING
- G06N—COMPUTING ARRANGEMENTS BASED ON SPECIFIC COMPUTATIONAL MODELS
- G06N3/00—Computing arrangements based on biological models
- G06N3/02—Neural networks
- G06N3/08—Learning methods
- G06N3/084—Backpropagation, e.g. using gradient descent
-
- G—PHYSICS
- G06—COMPUTING OR CALCULATING; COUNTING
- G06N—COMPUTING ARRANGEMENTS BASED ON SPECIFIC COMPUTATIONAL MODELS
- G06N3/00—Computing arrangements based on biological models
- G06N3/02—Neural networks
- G06N3/08—Learning methods
- G06N3/088—Non-supervised learning, e.g. competitive learning
-
- G—PHYSICS
- G06—COMPUTING OR CALCULATING; COUNTING
- G06N—COMPUTING ARRANGEMENTS BASED ON SPECIFIC COMPUTATIONAL MODELS
- G06N3/00—Computing arrangements based on biological models
- G06N3/02—Neural networks
- G06N3/08—Learning methods
- G06N3/09—Supervised learning
-
- G—PHYSICS
- G06—COMPUTING OR CALCULATING; COUNTING
- G06N—COMPUTING ARRANGEMENTS BASED ON SPECIFIC COMPUTATIONAL MODELS
- G06N5/00—Computing arrangements using knowledge-based models
- G06N5/01—Dynamic search techniques; Heuristics; Dynamic trees; Branch-and-bound
-
- G—PHYSICS
- G06—COMPUTING OR CALCULATING; COUNTING
- G06N—COMPUTING ARRANGEMENTS BASED ON SPECIFIC COMPUTATIONAL MODELS
- G06N5/00—Computing arrangements using knowledge-based models
- G06N5/04—Inference or reasoning models
-
- G—PHYSICS
- G06—COMPUTING OR CALCULATING; COUNTING
- G06N—COMPUTING ARRANGEMENTS BASED ON SPECIFIC COMPUTATIONAL MODELS
- G06N7/00—Computing arrangements based on specific mathematical models
- G06N7/01—Probabilistic graphical models, e.g. probabilistic networks
-
- G—PHYSICS
- G06—COMPUTING OR CALCULATING; COUNTING
- G06N—COMPUTING ARRANGEMENTS BASED ON SPECIFIC COMPUTATIONAL MODELS
- G06N99/00—Subject matter not provided for in other groups of this subclass
-
- G—PHYSICS
- G16—INFORMATION AND COMMUNICATION TECHNOLOGY [ICT] SPECIALLY ADAPTED FOR SPECIFIC APPLICATION FIELDS
- G16C—COMPUTATIONAL CHEMISTRY; CHEMOINFORMATICS; COMPUTATIONAL MATERIALS SCIENCE
- G16C20/00—Chemoinformatics, i.e. ICT specially adapted for the handling of physicochemical or structural data of chemical particles, elements, compounds or mixtures
- G16C20/30—Prediction of properties of chemical compounds, compositions or mixtures
-
- G—PHYSICS
- G16—INFORMATION AND COMMUNICATION TECHNOLOGY [ICT] SPECIALLY ADAPTED FOR SPECIFIC APPLICATION FIELDS
- G16C—COMPUTATIONAL CHEMISTRY; CHEMOINFORMATICS; COMPUTATIONAL MATERIALS SCIENCE
- G16C20/00—Chemoinformatics, i.e. ICT specially adapted for the handling of physicochemical or structural data of chemical particles, elements, compounds or mixtures
- G16C20/70—Machine learning, data mining or chemometrics
Definitions
- the present disclosure relates to a prediction device, a material design system, a prediction method, and a prediction program.
- Non-Patent Document 1 proposes to define the scope of application of a prediction model (the range of prediction target data in which a desired prediction accuracy can be achieved).
- the prediction accuracy is low to begin with, so even if material properties that meet the predetermined conditions are predicted, the material properties may not be as predicted when actually generated. are rarely obtained, and are unlikely to become useful new materials.
- This disclosure aims to improve the efficiency of developing new materials.
- a prediction device includes: Obtain a training dataset used to generate a trained model, and obtain multiple intervals for classifying attribute values from the frequency distribution of attribute values calculated among multiple data included in the training dataset.
- an interval determining unit that determines By determining which of the plurality of intervals the attribute value calculated between the prediction target data and the plurality of data falls into, the suitability of the prediction target data with respect to conflicting indicators can be evaluated.
- An evaluation department that evaluates;
- the display unit includes a display unit that displays a predicted value predicted by the learned model in association with an evaluation result by the evaluation unit by inputting the data to be predicted.
- a second aspect of the present disclosure is the prediction device according to the first aspect, comprising: The section determining unit calculates summary statistics for the attribute values calculated between the plurality of data, and determines a lower limit value or an upper limit value of the attribute value that defines the plurality of sections.
- a third aspect of the present disclosure is the prediction device according to the second aspect, comprising: The section determining unit determines three or more sections that do not overlap with each other.
- a fourth aspect of the present disclosure is the prediction device according to the third aspect, comprising:
- the evaluation unit is configured to determine which interval of the three or more intervals the attribute value calculated between the data to be predicted and the plurality of data is closest to the interval containing the predetermined summary statistics. The appropriateness of the prediction target data is evaluated based on whether the data is classified into .
- a fifth aspect of the present disclosure is the prediction device according to the third aspect,
- the evaluation unit determines that an attribute value calculated between the data to be predicted and the plurality of data is located in an interval that is farthest from an interval including a predetermined summary statistic among the three or more intervals. If it is determined that the data is classified, the data to be predicted is excluded from the data input to the learned model.
- a sixth aspect of the present disclosure is the prediction device according to the third aspect,
- the evaluation unit determines that the attribute value calculated between the data to be predicted and the plurality of data is an R-th interval that is close to an interval including a predetermined summary statistic among the three or more intervals. If it is determined that the data is classified into , the data to be predicted is selected as data to be input to the learned model.
- a seventh aspect of the present disclosure is the prediction device according to the first aspect, a learning data attribute value calculation unit that calculates a distance between a plurality of data included in the learning data set; further comprising a learning data minimum attribute value extraction unit that extracts a minimum distance among distances between each of the plurality of data and other data calculated, The section determining unit determines the plurality of sections for dividing the minimum distance from the frequency distribution of the extracted minimum distance.
- An eighth aspect of the present disclosure is the prediction device according to the seventh aspect,
- the learning data attribute value calculation unit calculates the i-th data (1 ⁇ i ⁇ N) and the i-th data among the N pieces of data (N is any integer) included in the learning data set. Calculate the distance between each excluding (N-1) pieces of data,
- the learning data minimum attribute value extraction unit extracts the minimum distance from among the (N-1) distances calculated for the i-th data.
- a ninth aspect of the present disclosure is the prediction device according to the seventh aspect, a prediction target data attribute value calculation unit that calculates a distance between the prediction target data and the plurality of data; further comprising a prediction target data minimum attribute value extraction unit that extracts a minimum distance among the distances between the prediction target data and the plurality of data;
- the evaluation unit evaluates the suitability of the prediction target data with respect to conflicting indicators by determining which of the plurality of sections the minimum distance extracted for the prediction target data falls into. evaluate.
- a tenth aspect of the present disclosure is a material design system, comprising: The prediction device according to the first aspect, Prediction target data for which the evaluation unit of the prediction device has determined that the attribute value calculated between the plurality of data is divided into predetermined intervals, and the learned model of the prediction device and a material design device that generates material design data by selecting and inputting prediction target data for which a predicted value that satisfies a predetermined condition is predicted.
- An eleventh aspect of the present disclosure is the material design system according to the tenth aspect, comprising: further comprising a learning device that generates a trained model based on the training dataset, The prediction device predicts the predicted value by inputting the prediction target data into the learned model generated by the learning device.
- a twelfth aspect of the present disclosure is a prediction method, comprising: Obtain a training dataset used to generate a trained model, and obtain multiple intervals for classifying attribute values from the frequency distribution of attribute values calculated among multiple data included in the training dataset. an interval determination step for determining the By determining which of the plurality of intervals the attribute value calculated between the prediction target data and the plurality of data falls into, the suitability of the prediction target data with respect to conflicting indicators can be evaluated.
- An evaluation process to evaluate By inputting the prediction target data, the computer executes a display step of displaying the predicted value predicted by the learned model in association with the evaluation result in the evaluation step.
- a thirteenth aspect of the present disclosure is a prediction program, comprising: Obtain a training dataset used to generate a trained model, and obtain multiple intervals for classifying attribute values from the frequency distribution of attribute values calculated among multiple data included in the training dataset. an interval determination step for determining the By determining which of the plurality of intervals the attribute value calculated between the prediction target data and the plurality of data falls into, the suitability of the prediction target data with respect to conflicting indicators can be evaluated.
- An evaluation process to evaluate By inputting the prediction target data, the computer is caused to execute a display step of displaying the predicted value predicted by the learned model in association with the evaluation result in the evaluation step.
- the efficiency of developing new materials can be improved.
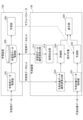
- FIG. 1 is a diagram showing an example of the system configuration of a material design system.
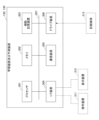
- FIG. 2 is a diagram illustrating an example of the functional configuration of a learning device and a prediction device.
- FIG. 3 is a diagram showing an example of the hardware configuration of the learning device and the prediction device.
- FIG. 4 is a diagram showing a specific example of processing by the learning section of the learning device.
- FIG. 5 is a diagram illustrating a specific example of processing by the learning data attribute value calculation unit of the prediction device.
- FIG. 6 is a diagram illustrating a specific example of processing by the section determination unit of the prediction device.
- FIG. 7 is a diagram illustrating a specific example of processing by the prediction target data attribute value calculation unit of the prediction device.
- FIG. 1 is a diagram showing an example of the system configuration of a material design system.
- FIG. 2 is a diagram illustrating an example of the functional configuration of a learning device and a prediction device.
- FIG. 3 is a diagram showing an example of the hardware configuration
- FIG. 8 is a diagram showing a specific example of processing by the evaluation unit of the prediction device.
- FIG. 9 is a diagram illustrating a specific example of processing by the prediction unit of the prediction device.
- FIG. 10 is a diagram illustrating a specific example of processing by the display unit of the prediction device.
- FIG. 11 is a flowchart showing the flow of learning processing.
- FIG. 12 is a flowchart showing the flow of prediction processing.
- FIG. 13 is a diagram showing Example 1.
- FIG. 14 is a diagram showing Example 2.
- FIG. 15 is a diagram showing Example 3.
- FIG. 16 is a diagram illustrating an example of verification of predictive characteristics.
- FIG. 1 is a diagram showing an example of the system configuration of a material design system.
- the material design system 100 includes a material property experiment device 110, a learning device 120, a prediction device 130, a material design device 140, a material generation device 150, and a material property experiment device 160.
- the material property experiment device 110 is a device for experimentally determining the characteristic value of the "material properties" of a material whose "material data" is a known structural formula.
- the characteristic values of each material determined by the experimenter 111 using the material property experiment device 110 are input to the learning device 120 as learning data together with the corresponding structural formula.
- the learning data may be configured based on information in a known database.
- the learning device 120 performs machine learning on a predictive model (a model that predicts the characteristic values of a material from the structural formula of the material) using the acquired learning data set that includes a plurality of acquired learning data. Generate a predictive model. Further, the learning device 120 notifies the prediction device 130 of the learning data set used to generate the learned prediction model and the model parameters of the learned prediction model.
- a predictive model a model that predicts the characteristic values of a material from the structural formula of the material
- the prediction device 130 has a trained prediction model set with the model parameters notified by the learning device 120, and predicts the prediction characteristics (an example of a predicted value) of the prediction target data input by the designer 131.
- the prediction device 130 also analyzes the learning data set notified by the learning device 120, and quantitatively determines the extent to which the material data of each learning data deviates from the material data of other learning data. By calculating, attribute values between material data are calculated.
- the prediction device 130 calculates the frequency distribution of attribute values between the calculated material data, thereby creating multiple intervals for dividing the attribute values (specifically, the attribute values defining each interval). (lower limit value, upper limit value).
- the prediction device 130 also calculates the attribute value of the material data of the prediction target data by quantitatively calculating how much the material data of the prediction target data deviates from the material data of each learning data. . Furthermore, the prediction device 130 evaluates the appropriateness of the prediction target data by determining which of the plurality of determined intervals the attribute value of the material data of the prediction target data is classified into, and uses the evaluation result as a prediction characteristic. Output in association with
- the appropriateness of the prediction target data here refers to the appropriateness of the prediction target data with respect to two contradictory indicators of unexpectedness and prediction accuracy in the development of new materials.
- the high suitability of the prediction target data means that there is a balance between the unexpectedness of the prediction target data with respect to the learning data and the prediction accuracy of the prediction characteristics of the prediction target data (in this embodiment, The suitability is expressed as a "rank" (details will be described later).
- the prediction characteristics of the prediction target data and the evaluation results of the prediction target data output by the prediction device 130 are notified to the designer 131. This allows the designer 131 to understand the prediction characteristics of the prediction target data, as well as whether the material generated based on the prediction target data is likely to become a useful new material. can do.
- the material design device 140 is a device that generates material design data.
- the designer 131 selects prediction target data that is likely to become a useful new material and inputs it into the material design device 140 to generate material design data.
- the material generation device 150 is a device for actually generating materials based on the generated material design data.
- the material property experiment device 160 is a device for determining the material properties of the new material actually produced by the material generation device 150 through verification experiments. The material properties of the new material determined by the experimenter 161 using the material property experiment device 160 are notified to the designer 131.
- FIG. 2 is a diagram illustrating an example of the functional configuration of a learning device and a prediction device.
- a learning program is installed in the learning device 120, and by executing the program, the learning device 120 functions as a learning data acquisition unit 201 and a learning unit 202.
- the learning data acquisition unit 201 acquires the learning data input by the experimenter 111 and stores it in the learning data storage unit 205.
- the learning unit 202 performs machine learning on the predictive model using a learning data set that includes a plurality of learning data stored in the learning data storage unit 205, and generates a learned predictive model.
- the model parameters of the learned prediction model generated by the learning unit 202 are notified to the prediction device 130 along with the learning data set used to generate the learned prediction model.
- a prediction program is installed in the prediction device 130.
- the prediction device 130 has a learning data attribute value calculation unit 211, an interval determination unit 212, a prediction target data acquisition unit 221, a prediction unit 222, a prediction target data attribute value calculation unit 223, and an evaluation unit. 224 and functions as a display section 225.
- the learning data attribute value calculation unit 211 analyzes the learning data set notified from the learning device 120, and determines how much the material data of each learning data deviates from the material data of other learning data. By quantitatively calculating, attribute values between material data are calculated.
- the interval determination unit 212 calculates the frequency distribution of attribute values between the material data calculated by the learning data attribute value calculation unit 211, thereby determining a plurality of intervals (specifically, The lower limit and upper limit of the attribute values that define each section are determined.
- the prediction target data acquisition unit 221 acquires the prediction target data input by the designer 131, and notifies the prediction unit 222 and the prediction target data attribute value calculation unit 223.
- the prediction unit 222 has a trained prediction model set with the model parameters notified by the learning unit 202, and predicts the prediction characteristics of the prediction target data input by the designer 131.
- the prediction target data attribute value calculation unit 223 acquires each learning data of the learning data set notified by the learning device 120, and also acquires the prediction target data notified by the prediction target data acquisition unit 221.
- the prediction target data attribute value calculation unit 223 quantitatively calculates the extent to which the material data of the prediction target data deviates from the material data of each learning data, thereby improving the material data of the prediction target data. Calculate attribute values.
- the evaluation unit 224 determines which of the plurality of intervals determined by the interval determination unit 212 the attribute value of the material data of the prediction target data calculated by the prediction target data attribute value calculation unit 223 is divided into. do. Thereby, the evaluation unit 224 evaluates the suitability of the prediction target data and notifies the display unit 225 of the evaluation result.
- exclusion targets are set in advance in the evaluation unit 224, and when the calculated attribute values are divided into predetermined intervals, the prediction target data is excluded from the prediction targets by the prediction unit 222 (that is, the prediction 222 into the trained prediction model). Alternatively, when the calculated attribute values are divided into predetermined intervals, the evaluation unit 224 excludes the prediction target data from the display target of the display unit 225 (that is, the prediction target data is not displayed on the display unit 225).
- the display unit 225 displays the prediction characteristics of the prediction target data predicted by the prediction unit 222 and the evaluation results of the prediction target data evaluated by the evaluation unit 224 in association with each other.
- the material design system 100 has a prediction device 130 and predicts the prediction characteristics of the prediction target data.
- - It has a prediction device 130 and outputs the evaluation result of prediction target data.
- the prediction device 130 predicts a prediction characteristic that satisfies a predetermined condition
- prediction target data that is unlikely to become a useful new material is It can be excluded from generation and verification experiments.
- the material design system 100 according to the first embodiment, it is possible to narrow down the prediction target data for material generation and verification experiments, and it is possible to improve the efficiency of developing new materials.
- FIG. 3 is a diagram showing an example of the hardware configuration of the learning device and the prediction device.
- the learning device 120 and the prediction device 130 include a processor 301, a memory 302, an auxiliary storage device 303, an I/F (Interface) device 304, a communication device 305, and a drive device 306.
- the respective hardware of the learning device 120 and the prediction device 130 are connected to each other via a bus 307.
- the processor 301 includes various computing devices such as a CPU (Central Processing Unit) and a GPU (Graphics Processing Unit).
- the processor 301 reads various programs (for example, learning programs, prediction programs, etc.) onto the memory 302 and executes them.
- the memory 302 includes main storage devices such as ROM (Read Only Memory) and RAM (Random Access Memory).
- the processor 301 and the memory 302 form a so-called computer, and when the processor 301 executes various programs read onto the memory 302, the computer realizes the various functions described above.
- the auxiliary storage device 303 stores various programs and various data used when the various programs are executed by the processor 301.
- the learning data storage unit 205 is implemented in the auxiliary storage device 303.
- the I/F device 304 is a connection device that connects to an operating device 311 and a display device 312, which are examples of a user interface device.
- the communication device 305 is a communication device for communicating with an external device (not shown) via a network.
- the drive device 306 is a device for setting the recording medium 313.
- the recording medium 313 here includes a medium for recording information optically, electrically, or magnetically, such as a CD-ROM, a flexible disk, or a magneto-optical disk. Further, the recording medium 313 may include a semiconductor memory that electrically records information, such as a ROM or a flash memory.
- the various programs to be installed in the auxiliary storage device 303 are installed by, for example, setting the distributed recording medium 313 in the drive device 306 and reading out the various programs recorded on the recording medium 313 by the drive device 306. be done.
- various programs installed in the auxiliary storage device 303 may be installed by being downloaded from a network via the communication device 305.
- FIG. 4 is a diagram showing a specific example of processing by the learning section of the learning device.
- the learning unit 202 includes an input unit 401, a prediction model 402, and a comparison/change unit 403.
- the learning data set 400 includes "data number”, “material data”, and “material characteristics” as information items.
- Data number stores a number to identify each learning data
- material data stores the structural formula of each material
- material properties stores the characteristic values of each material. Stored.
- the example in FIG. 4 shows that N pieces of learning data (N is an arbitrary integer) are stored.
- the input unit 401 reads out the structural formula of the material included in the "material data" of each learning data from the learning data set 400, and inputs it into the prediction model.
- the prediction model 402 outputs output data corresponding to material properties by inputting the structural formula of the material included in the "material data" of each learning data.
- the comparison/change unit 403 updates the model parameters of the prediction model 402 so that the output data output from the prediction model 402 approaches the material characteristic values included in the "material properties" of each learning data.
- the learning unit 202 can generate a trained prediction model that can predict the material properties of the prediction target data based on the material data of the prediction target data.
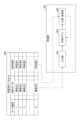
- FIG. 5 is a diagram illustrating a specific example of processing by the learning data attribute value calculation unit of the prediction device.
- the learning data attribute value calculation section 211 includes a mutual attribute value calculation section 501 and a learning data minimum attribute value extraction section 502.
- the mutual attribute value calculation unit 501 calculates a number for identifying each learning data and a structural formula of each material from the "data number" and "material data" of the learning data set 400 including N pieces of learning data. read out.
- the mutual attribute value calculation unit 501 calculates the structural formula of the material included in the "material data" of the N pieces of learning data read out. ⁇ The structural formula of the material included in the "material data” of the i-th (1 ⁇ i ⁇ N) learning data, ⁇ The structural formula of the material included in the "material data” of (N-1) other learning data excluding the i-th learning data, , and calculate attribute values between material data for all combinations.
- the attribute values between the material data here refer to the structural formula of the material included in the "material data” of the i-th learning data and the "material data” of other learning data other than the i-th learning data. This value indicates the degree to which the structural formula of the material contained in the material differs from the structural formula of the material.
- the structural formula of the material included in the "material data" of the i-th learning data and the structural formula of the material included in the “material data” of other learning data excluding the i-th learning data refers to the distance between Or, between the structural formula of the material included in the "material data” of the i-th learning data and the structural formula of the material included in the "material data” of other learning data other than the i-th learning data. Refers to the density, etc.
- a table 511 is a table in which numbers for identifying each piece of learning data are arranged on the horizontal and vertical axes. Table 511 shows all combinations of material data of each learning data included in learning data set 400.
- the learning data minimum attribute value extraction unit 502 extracts the minimum attribute value (for example, minimum distance) for each material from the attribute values between material data for all combinations calculated by the mutual attribute value calculation unit 501. Extract.
- a table 512 shows the minimum attribute value extracted for each material by the learning data minimum attribute value extraction unit 502 in association with a number for identifying each learning data.
- the minimum attribute value of the material is "0.1".
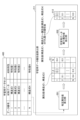
- FIG. 6 is a diagram illustrating a specific example of processing by the section determination unit of the prediction device.
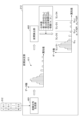
- the interval determination section 212 includes a frequency distribution generation section 601 and an interval calculation section 602.
- the frequency distribution generation unit 601 acquires the minimum attribute value of each material notified from the learning data minimum attribute value extraction unit 502, and generates a frequency distribution.
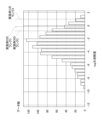
- reference numeral 611 is an example of the frequency distribution generated by the frequency distribution generation unit 601, where the horizontal axis represents the attribute value and the vertical axis represents the number of data.
- ⁇ The interval that includes the predetermined summary statistic (here, the “median”) is “Rank 1”
- ⁇ The first interval closest to the interval containing the predetermined summary statistics is “Rank 2”
- ⁇ The second interval closest to the interval containing the predetermined summary statistics is ranked as “Rank 3”
- ⁇ The section that is farthest from the section that includes the predetermined summary statistics is ranked as "Rank 4"
- each rank can be said to simultaneously represent two contradictory indicators (unexpectedness and prediction accuracy) in the development of new materials.
- FIG. 7 is a diagram illustrating a specific example of processing by the prediction target data attribute value calculation unit of the prediction device.
- the prediction target data attribute value calculation unit 223 includes a mutual attribute value calculation unit 701 and a prediction target data minimum attribute value extraction unit 702.
- the mutual attribute value calculation unit 701 calculates a number for identifying each piece of learning data from the "data number” and “material data” of the learning data set 400 including N pieces of learning data notified by the learning device 120. and read out the structural formula of each material. Further, the mutual attribute value calculation unit 701 calculates a number for identifying the prediction target data and a structural formula of the material from the “data number” and “material data” of the prediction target data 700 notified by the prediction target data acquisition unit 221. Read out.
- the mutual attribute value calculation unit 701 calculates, among the structural formulas of materials included in the "material data” of the N learning data read out, ⁇ The structural formula of the material included in the "material data” of the i-th (1 ⁇ i ⁇ N) learning data, ⁇ The structural formula of the material included in the "material data” of the prediction target data 700, , and calculate attribute values between material data for all combinations.
- the attribute value between the material data here refers to the structural formula of the material included in the "material data” of the i-th learning data and the structural formula of the material included in the "material data” of the prediction target data 700. , refers to the value that indicates how much they deviate from each other.
- it refers to the distance between the structural formula of the material included in the "material data” of the i-th learning data and the structural formula of the material included in the “material data” of the prediction target data 700.
- it refers to the density between the structural formula of the material included in the "material data” of the i-th learning data and the structural formula of the material included in the "material data” of the prediction target data 700.
- table 711 is a table in which the horizontal axis is a number for identifying each learning data included in the learning data set 400, and the vertical axis is a number for identifying prediction target data. .
- the table 711 shows all combinations between the material data of each learning data included in the learning data set 400 and the material data of prediction target data.
- the prediction target data minimum attribute value extraction unit 702 extracts the minimum attribute value from the attribute values between the material data for all combinations calculated by the mutual attribute value calculation unit 701.
- a table 712 shows the minimum attribute value extracted by the prediction target data minimum attribute value extraction unit 702 in association with a number for identifying the prediction target data.
- the example in FIG. 7 shows that the minimum attribute value is "0.1".
- FIG. 8 is a diagram showing a specific example of processing by the evaluation unit of the prediction device.
- the evaluation section 224 includes an attribute value acquisition section 801 and an evaluation result output section 802.
- the attribute value acquisition unit 801 acquires the minimum attribute value notified from the prediction target data minimum attribute value extraction unit 702, and determines which of the plurality of intervals notified by the interval determination unit 212 the attribute value is classified into.
- the evaluation result output unit 802 notifies the display unit 225 of the evaluation result (rank).
- the evaluation result output unit 802 determines whether the minimum attribute value calculated for the structural formula (structural formula judge. Specifically, it is determined whether the evaluation result (rank) regarding the suitability of the structural formula (structural formula X) of the material included in the "material data" of the prediction target data 700 corresponds to the exclusion target. If the evaluation result output unit 802 determines that the item falls under the exclusion target, the evaluation result output unit 802 notifies the prediction unit 222 and/or the display unit 225.
- FIG. 9 is a diagram illustrating a specific example of processing by the prediction unit of the prediction device.
- the prediction unit 222 includes a prediction target data input unit 901, a learned prediction model 902, and a prediction characteristic output unit 903.
- the prediction target data input unit 901 When the prediction target data input unit 901 is notified of the prediction target data 700 by the prediction target data acquisition unit 221, the prediction target data input unit 901 inputs the learned structural formula (structural formula X) of the material included in the “material data” of the prediction target data 700. Input to prediction model 902.
- the prediction target data input unit 901 inputs the structural formula (structure) of the material included in the “material data” of the prediction target data 700.
- Formula X may be controlled so as not to be input.
- the trained prediction model 902 is a trained prediction model in which model parameters calculated by the learning process performed by the learning unit 202 are set.
- the prediction characteristic output unit 903 notifies the display unit 225 of the prediction characteristics of the prediction target data 700 predicted by the learned prediction model 902.
- FIG. 10 is a diagram illustrating a specific example of processing by the display unit of the prediction device.
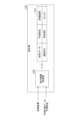
- the display unit 225 includes a display information acquisition unit 1001.
- the display information acquisition unit 1001 acquires the evaluation results notified from the evaluation unit 224 and the prediction characteristics notified from the prediction unit 222, and generates display data 1011.
- the display data 1011 includes "material data”, “predicted characteristics”, and “evaluation results” as information items.
- “Material data” stores the “structural formula “Characteristic value 2” which is a characteristic is stored.
- the “evaluation result” stores "Rank 2", which is the evaluation result of evaluating the suitability of the structural formula (structural formula X) of the material included in the "material data” of the prediction target data 700 in the development of new materials. be done.
- FIG. 11 is a flowchart showing the flow of learning processing.
- step S1101 the learning device 120 acquires a learning data set that includes the material properties of each material found through experiments by the experimenter 111 using the material property experiment device 110.
- step S1102 the learning device 120 performs a learning process on the predictive model using the learning data set to generate a trained predictive model.
- FIG. 12 is a flowchart showing the flow of prediction processing.
- step S1201 the prediction device 130 acquires the learning data set used by the learning device 120 to generate the learned prediction model and the model parameters of the learned prediction model.
- step S1202 the prediction device 130 analyzes the learning data set and calculates attribute values between the material data.
- step S1203 the prediction device 130 calculates the frequency distribution of attribute values among the calculated material data, and determines a plurality of intervals for dividing the attribute values.
- step S1204 the prediction device 130 refers to the settings for exclusion targets.
- step S1205 the prediction device 130 acquires prediction target data.
- step S1206 the prediction device 130 calculates the attribute value of the material data of the prediction target data.
- step S1207 the prediction device 130 determines which of the plurality of determined sections the attribute value of the material data of the calculated prediction target data falls into, thereby determining the prediction target data for the two conflicting indicators. Evaluate suitability (rank).
- step S1208 the prediction device 130 determines whether the evaluation result corresponds to an exclusion target. If it is determined in step S1208 that the item does not fall under the exclusion target (NO in step S1208), the process advances to step S1211.
- step S1208 determines whether the item falls under the exclusion target (in the case of YES in step S1208). If it is determined in step S1208 that the item falls under the exclusion target (in the case of YES in step S1208), the process advances to step S1210.
- step S1209 the prediction device 130 excludes the prediction target data from the prediction target or display target.
- step S1210 the prediction device 130 predicts the prediction characteristics by inputting the prediction target data into the learned prediction model.
- step S1211 the prediction device 130 displays display data in which prediction target data, prediction characteristics, and evaluation results are associated with each other.
- a descriptor was calculated from SMILES (Simplified Molecular Line Entry System), which shows the molecular structure, using RDKIT, and a value obtained by standardizing the calculated descriptor was used as an explanatory variable. Ridge regression was used as a prediction model. Standardization and ridge regression were performed with scikit-learn.
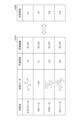
- Example 1 is a diagram showing Example 1. As shown in FIG. 13, in Example 1, as a plurality of prediction target data, ⁇ Nitromethane, ⁇ methanol, ⁇ sucrose, ⁇ Digoxin, For each, the suitability was evaluated by predicting the predicted characteristics and determining the intervals in which the attribute values are divided (see Table 1310). Note that the material properties (here, water solubility) of the prediction target data are all known, so they are shown in Table 1320 for the purpose of verifying prediction accuracy.
- the material properties here, water solubility
- the relationship between the index and evaluation result for each prediction target data is as follows. ⁇ For the prediction target data evaluated as rank 1 and rank 2, prediction characteristics of high water solubility and good prediction accuracy have been obtained, but the structural formula is simple and unexpected. is low. ⁇ For prediction target data evaluated as rank 3, prediction characteristics of relatively high water solubility have been obtained, good prediction accuracy has been obtained, and the structural formula is relatively complex. Highly unexpected. - For the prediction target data evaluated as rank 4, prediction characteristics with very high water solubility have been obtained, but in reality, the material has low water solubility and the prediction accuracy is extremely low. Note that the structural formula is complex and highly unexpected.
- FIG. 14 is a diagram showing Example 2.
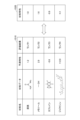
- Example 2 as a plurality of prediction target data, ⁇ Erythritol, ⁇ methanol, ⁇ Lactose, ⁇ Raffinose, For each, the suitability was evaluated by predicting the predicted characteristics and determining the intervals in which the attribute values are divided (see Table 1410). Note that the material properties (also water solubility here) of the above prediction target data are all known, so they are shown in Table 1420 for the purpose of verifying prediction accuracy.
- the relationship between the index and evaluation result for each prediction target data is as follows. ⁇ For the prediction target data evaluated as rank 1 and rank 2, prediction characteristics of high water solubility and good prediction accuracy have been obtained, but the structural formula is simple and unexpected. is low. ⁇ For prediction target data evaluated as rank 3, prediction characteristics of relatively high water solubility have been obtained, good prediction accuracy has been obtained, and the structural formula is relatively complex. Highly unexpected. ⁇ For the prediction target data evaluated as rank 4, prediction characteristics of relatively high water solubility and good prediction accuracy were obtained, and the structural formula was complex and unexpected. is high.
- Example 3 is a diagram showing Example 3. As shown in FIG. 15, in Example 3, as a plurality of prediction target data, ⁇ urea, ⁇ methanol, ⁇ caffeine, ⁇ Digoxin, For each, the suitability was evaluated by predicting the predicted characteristics and determining the intervals in which the attribute values are divided (see Table 1510). Note that the material properties (also water solubility here) of the above prediction target data are all known, so they are shown in Table 1520 for the purpose of verifying prediction accuracy.
- the relationship between the index and evaluation result for each prediction target data is as follows. ⁇ For the prediction target data evaluated as rank 1 and rank 2, prediction characteristics of high water solubility and good prediction accuracy have been obtained, but the structural formula is simple and unexpected. is low. ⁇ For prediction target data evaluated as rank 3, prediction characteristics of relatively high water solubility have been obtained, good prediction accuracy has been obtained, and the structural formula is relatively complex. Highly unexpected. - Regarding the prediction target data evaluated as rank 4, prediction characteristics of high water solubility have been obtained, but in reality, the material has low water solubility and the prediction accuracy is extremely low. Note that the structural formula is complex and highly unexpected.
- a frequency distribution of water solubility is generated based on the water solubility data set disclosed in the following non-patent literature, and the prediction target data evaluated as rank 3 in Examples 1 to 3 is calculated. Water solubility was verified.
- FIG. 16 is a diagram illustrating an example of verification of predictive characteristics. As shown in FIG. 16, it can be seen that the water solubility of the prediction target data evaluated as rank 3 in Examples 1 to 3 is objectively high. In other words, it can be said that the prediction characteristics of the prediction target data and the evaluation results of the prediction target data output by the prediction device 130 accurately represent the possibility of becoming useful new material.
- the prediction device is - Obtain the training dataset used to generate the trained prediction model, and classify the attribute value from the frequency distribution of the attribute value calculated among multiple material data included in the training dataset. Determine multiple intervals. ⁇ By determining which of multiple intervals the attribute values calculated between the material data of the prediction target data and multiple material data included in the learning dataset are classified into, conflicting two Evaluate the suitability of prediction target data for two indicators. - By inputting prediction target data, the prediction characteristics predicted by the learned model are displayed in association with the evaluation results.
- the prediction device According to the prediction device according to the first embodiment, it is possible to narrow down the prediction target data for performing material generation and verification experiments, and it is possible to improve the efficiency of developing new materials.
- the median, first quartile, third quartile, and interquartile range are calculated as summary statistics, and the coefficients ⁇ 1 and ⁇ 2 are determined.
- the section has been decided.
- the method for determining each section is not limited to this.
- ⁇ Average value of the minimum attribute value of each material ⁇ Standard deviation of the minimum attribute value of each material, Calculate multiple intervals, ⁇ An interval in which attribute values such as “attribute value ⁇ (average value + ⁇ 1 ⁇ standard deviation)” are divided, ⁇ An interval in which attribute values such as “(average value + ⁇ 1 ⁇ standard deviation) ⁇ attribute value ⁇ (average value + ⁇ 2 ⁇ standard deviation)” are divided, ⁇ An interval in which attribute values such as “(average value + ⁇ 2 ⁇ standard deviation) ⁇ attribute value ⁇ (average value + ⁇ 3 ⁇ standard deviation)” are divided, ⁇ An interval in which attribute values such as “(average value + ⁇ 3 ⁇ standard deviation) ⁇ attribute value” are divided, You may decide that.
- the number of sections to be determined is not limited to four, as long as the sections do not overlap with each other, and may be three or more. That's fine.
- prediction target data is input to the prediction device 130 one by one, but a plurality of prediction target data may be input to the prediction device 130.
- the prediction device 130 may be configured, for example, to display only the prediction characteristics and evaluation results of the prediction target data that is highly likely to become useful new material among the plurality of prediction target data.
- the prediction target data input unit 901 The minimum attribute value calculated for the structural formula (structural formula 3rd section), or - If the structural formula of the material (structural formula The structural formula (structural formula X) of the material may be selected and controlled to be input to the learned prediction model 902.
- the learning device and the prediction device are described as being realized by separate devices, but the learning device and the prediction device may be realized as an integrated device.
- Material design system 110 Material property experiment device 120: Learning device 130: Prediction device 140: Material design device 150: Material generation device 160: Material property experiment device 201: Data acquisition unit for learning 202: Learning unit 211: For learning Data attribute value calculation unit 212: Section determination unit 221: Prediction target data acquisition unit 222: Prediction unit 223: Prediction target data attribute value calculation unit 224: Evaluation unit 225: Display unit 400: Learning dataset 700: Prediction target data 902 : Learned prediction model
Landscapes
- Engineering & Computer Science (AREA)
- Theoretical Computer Science (AREA)
- Physics & Mathematics (AREA)
- Software Systems (AREA)
- General Physics & Mathematics (AREA)
- Evolutionary Computation (AREA)
- General Engineering & Computer Science (AREA)
- Computing Systems (AREA)
- Artificial Intelligence (AREA)
- Mathematical Physics (AREA)
- Data Mining & Analysis (AREA)
- Computational Linguistics (AREA)
- Life Sciences & Earth Sciences (AREA)
- Biophysics (AREA)
- Molecular Biology (AREA)
- General Health & Medical Sciences (AREA)
- Biomedical Technology (AREA)
- Health & Medical Sciences (AREA)
- Computer Vision & Pattern Recognition (AREA)
- Medical Informatics (AREA)
- Business, Economics & Management (AREA)
- Strategic Management (AREA)
- Human Resources & Organizations (AREA)
- Economics (AREA)
- Computer Hardware Design (AREA)
- Geometry (AREA)
- Mathematical Optimization (AREA)
- Pure & Applied Mathematics (AREA)
- Chemical & Material Sciences (AREA)
- Crystallography & Structural Chemistry (AREA)
- Bioinformatics & Cheminformatics (AREA)
- Bioinformatics & Computational Biology (AREA)
- Mathematical Analysis (AREA)
- Development Economics (AREA)
- Computational Mathematics (AREA)
- Game Theory and Decision Science (AREA)
- Algebra (AREA)
- Probability & Statistics with Applications (AREA)
- Entrepreneurship & Innovation (AREA)
- Marketing (AREA)
Abstract
Description
学習済みモデルの生成に用いられる学習用データセットを取得し、前記学習用データセットに含まれる複数のデータ間で算出される属性値の度数分布から、該属性値を区分けするための複数の区間を決定する区間決定部と、
予測対象のデータと、前記複数のデータとの間で算出される属性値が、前記複数の区間のいずれに区分けされるかを判定することで、相反する指標に対する前記予測対象のデータの適正を評価する評価部と、
前記予測対象のデータを入力することで、前記学習済みモデルにより予測された予測値を、前記評価部による評価結果と対応付けて表示する表示部とを有する。
前記区間決定部は、前記複数のデータ間で算出される属性値について要約統計量を算出し、前記複数の区間を規定する、属性値の下限値または上限値を決定する。
前記区間決定部は、互いに重複しない3つ以上の区間を決定する。
前記評価部は、予測対象のデータと、前記複数のデータとの間で算出される属性値が、前記3つ以上の区間のうち、所定の要約統計量が含まれる区間に近い何番目の区間に区分けされるかにより、前記予測対象のデータの適正を評価する。
前記評価部は、予測対象のデータと、前記複数のデータとの間で算出される属性値が、前記3つ以上の区間のうち、所定の要約統計量が含まれる区間から最も離れた区間に区分けされると判定した場合、前記予測対象のデータを、前記学習済みモデルに入力するデータから除外する。
前記評価部は、予測対象のデータと、前記複数のデータとの間で算出される属性値が、前記3つ以上の区間のうち、所定の要約統計量が含まれる区間に近いR番目の区間に区分けされると判定した場合、前記予測対象のデータを、前記学習済みモデルに入力するデータとして選択する。
前記学習用データセットに含まれる複数のデータ間の距離を算出する学習用データ属性値算出部と、
前記複数のデータそれぞれについて算出された他のデータとの間の距離のうち、最小距離を抽出する学習用データ最小属性値抽出部と、を更に有し、
前記区間決定部は、抽出された前記最小距離の度数分布から、該最小距離を区分けするための前記複数の区間を決定する。
前記学習用データ属性値算出部は、前記学習用データセットに含まれるN個のデータ(Nは任意の整数)のうち、i番目(1≦i≦N)のデータと、i番目のデータを除く(N-1)個のデータとの間の距離をそれぞれ算出し、
前記学習用データ最小属性値抽出部は、前記i番目のデータについて算出された(N-1)個の距離の中から、最小距離を抽出する。
前記予測対象のデータと、前記複数のデータとの間の距離を算出する予測対象データ属性値算出部と、
前記予測対象のデータと、前記複数のデータとの間の距離のうち、最小距離を抽出する予測対象データ最小属性値抽出部と、を更に有し、
前記評価部は、前記予測対象のデータについて抽出された前記最小距離が、前記複数の区間のうちのいずれに区分けされるかを判定することで、相反する指標に対する前記予測対象のデータの適正を評価する。
第1の態様に記載の予測装置と、
前記予測装置の前記評価部により、前記複数のデータとの間で算出された属性値が所定の区間に区分けされると判定された予測対象のデータであって、前記予測装置の前記学習済みモデルにより、所定の条件を満たす予測値が予測された予測対象のデータを選択して入力することで、材料設計データを生成する材料設計装置とを有する。
学習用データセットに基づいて学習済みモデルを生成する学習装置を更に有し、
前記予測装置は、前記学習装置により生成された前記学習済みモデルに、前記予測対象のデータを入力することで前記予測値を予測する。
学習済みモデルの生成に用いられる学習用データセットを取得し、前記学習用データセットに含まれる複数のデータ間で算出される属性値の度数分布から、該属性値を区分けするための複数の区間を決定する区間決定工程と、
予測対象のデータと、前記複数のデータとの間で算出される属性値が、前記複数の区間のいずれに区分けされるかを判定することで、相反する指標に対する前記予測対象のデータの適正を評価する評価工程と、
前記予測対象のデータを入力することで、前記学習済みモデルにより予測された予測値を、前記評価工程における評価結果と対応付けて表示する表示工程と
をコンピュータが実行する。
学習済みモデルの生成に用いられる学習用データセットを取得し、前記学習用データセットに含まれる複数のデータ間で算出される属性値の度数分布から、該属性値を区分けするための複数の区間を決定する区間決定工程と、
予測対象のデータと、前記複数のデータとの間で算出される属性値が、前記複数の区間のいずれに区分けされるかを判定することで、相反する指標に対する前記予測対象のデータの適正を評価する評価工程と、
前記予測対象のデータを入力することで、前記学習済みモデルにより予測された予測値を、前記評価工程における評価結果と対応付けて表示する表示工程と
をコンピュータに実行させる。
<材料設計システムのシステム構成>
はじめに、第1の実施形態に係る材料設計システムのシステム構成について説明する。図1は、材料設計システムのシステム構成の一例を示す図である。図1に示すように、材料設計システム100は、材料特性実験装置110、学習装置120、予測装置130、材料設計装置140、材料生成装置150、材料特性実験装置160を有する。
次に、材料設計システム100を構成する各装置のうち、学習装置120及び予測装置130の機能構成について図2を参照しながら説明する。図2は、学習装置及び予測装置の機能構成の一例を示す図である。
・予測装置130を有し、予測対象データの予測特性を予測する。これにより、第1の実施形態によれば、所定の条件を満たす予測特性が予測されなかった予測対象データを、材料の生成及び検証実験の対象から排除することができる。
・予測装置130を有し、予測対象データの評価結果を出力する。これにより、第1の実施形態によれば、予測装置130によって所定の条件を満たす予測特性が予測された場合であっても、有益な新規材料となる可能性が低い予測対象データを、材料の生成及び検証実験の対象から排除することができる。
次に、学習装置120及び予測装置130のハードウェア構成について説明する。なお、学習装置120及び予測装置130は、同様のハードウェア構成を有するため、ここでは、図3を用いて、学習装置120及び予測装置130のハードウェア構成をまとめて説明する。
次に、学習装置120の各部(ここでは、学習部202)の処理の具体例について説明する。
はじめに、学習装置120の学習部202による処理の具体例について説明する。図4は、学習装置の学習部による処理の具体例を示す図である。図4に示すように、学習部202は、入力部401、予測モデル402、比較/変更部403を有する。
次に、予測装置130の各部(ここでは、学習用データ属性値算出部211、区間決定部212、予測対象データ属性値算出部223、評価部224、予測部222、表示部225)の処理の具体例について説明する。
はじめに、学習用データ属性値算出部211による処理の具体例について説明する。図5は、予測装置の学習用データ属性値算出部による処理の具体例を示す図である。図5に示すように、学習用データ属性値算出部211は、相互属性値算出部501、学習用データ最小属性値抽出部502を有する。
・i番目(1≦i≦N)の学習用データの"材料データ"に含まれる材料の構造式と、
・i番目の学習用データを除く(N-1)個の他の学習用データの"材料データ"に含まれる材料の構造式と、
の組み合わせを生成し、全ての組み合わせについて、材料データ間の属性値を算出する。ここでいう材料データ間の属性値とは、i番目の学習用データの"材料データ"に含まれる材料の構造式と、i番目の学習用データを除く他の学習用データの"材料データ"に含まれる材料の構造式とが、どの程度乖離しているかを示す値を指す。具体的には、i番目の学習用データの"材料データ"に含まれる材料の構造式と、i番目の学習用データを除く他の学習用データの"材料データ"に含まれる材料の構造式との間の距離を指す。あるいは、i番目の学習用データの"材料データ"に含まれる材料の構造式と、i番目の学習用データを除く他の学習用データの"材料データ"に含まれる材料の構造式との間の密度等を指す。
・データ番号="2"の学習用データの材料データ="構造式2"と、
・データ番号="1"の学習用データの材料データ="構造式1"と、
の組み合わせについて算出された、材料データ間の属性値(=0.1)が格納される。
次に、区間決定部212による処理の具体例について説明する。図6は、予測装置の区間決定部による処理の具体例を示す図である。図6に示すように、区間決定部212は、度数分布生成部601、区間算出部602を有する。
・各材料の最小の属性値の中央値、
・各材料の最小の属性値の第一四分位(Q25)、
・各材料の最小の属性値の第三四分位(Q75)、
・各材料の最小の属性値の四分位範囲(IQR=Q75-Q25)、
を算出する。また、区間算出部602は、算出した上記要約統計量に基づいて、各属性値を区分けするための複数の区間を決定する際の、係数(α1、α2)を決定する。
・「属性値<(第三四分位(Q75))」となる属性値が区分けされる区間の上限値、
・「(第三四分位(Q75))≦属性値<(四分位範囲(IQR)をα1倍した値を第三四分位(Q75)に加算した値)」となる属性値が区分けされる区間の下限値、上限値、
・「(四分位範囲(IQR)をα1倍した値を第三四分位(Q75)に加算した値)≦属性値<(四分位範囲(IQR)をα2倍した値を第三四分位(Q75)に加算した値)」となる属性値が区分けされる区間の下限値、上限値、
・「(四分位範囲(IQR)をα2倍した値を第三四分位(Q75)に加算した値)≦属性値」となる属性値が区分けされる区間の下限値、
を決定した様子を示している。
・所定の要約統計量(ここでは、「中央値」)が含まれる区間を、「ランク1」、
・所定の要約統計量が含まれる区間に近い1番目の区間を、「ランク2」、
・所定の要約統計量が含まれる区間に近い2番目の区間を、「ランク3」、
・所定の要約統計量が含まれる区間から最も離れた区間を、「ランク4」、
と規定している。
・予測精度は、「ランク1」→「ランク2」→「ランク3」→「ランク4」の順に低下する。つまり、ランクは、予測精度の高さを表している。
・意外性は、「ランク1」→「ランク2」→「ランク3」→「ランク4」の順に上がる。つまり、ランクは、意外性の低さを表している。
次に、予測対象データ属性値算出部223による処理の具体例について説明する。図7は、予測装置の予測対象データ属性値算出部による処理の具体例を示す図である。図7に示すように、予測対象データ属性値算出部223は、相互属性値算出部701、予測対象データ最小属性値抽出部702を有する。
・i番目(1≦i≦N)の学習用データの"材料データ"に含まれる材料の構造式と、
・予測対象データ700の"材料データ"に含まれる材料の構造式と、
の組み合わせを生成し、全ての組み合わせについて、材料データ間の属性値を算出する。ここでいう材料データ間の属性値とは、i番目の学習用データの"材料データ"に含まれる材料の構造式と、予測対象データ700の"材料データ"に含まれる材料の構造式とが、どの程度乖離しているかを示す値を指す。具体的には、i番目の学習用データの"材料データ"に含まれる材料の構造式と、予測対象データ700の"材料データ"に含まれる材料の構造式との間の距離を指す。あるいは、i番目の学習用データの"材料データ"に含まれる材料の構造式と、予測対象データ700の"材料データ"に含まれる材料の構造式との間の密度等を指す。
・データ番号="2"の学習用データの材料データ="構造式2"と、
・データ番号="X"の予測対象データの材料データ="構造式X"と、
の組み合わせについて算出された、材料データ間の属性値(=0.1)が格納される。
次に、評価部224による処理の具体例について説明する。図8は、予測装置の評価部による処理の具体例を示す図である。図8に示すように、評価部224は、属性値取得部801、評価結果出力部802を有する。
・意外性の低さがR番目(R=2)、
・予測精度の高さがR番目(R=2)、
である(ランク2である)と評価する。つまり、評価結果出力部802は、予測対象データの材料データの属性値が、所定の要約統計量(中央値)が含まれる区間に近い何番目の区間に区分けされるかにより、予測対象データの適正(ランク)を評価する。
次に、予測部222による処理の具体例について説明する。図9は、予測装置の予測部による処理の具体例を示す図である。図9に示すように、予測部222は、予測対象データ入力部901、学習済み予測モデル902、予測特性出力部903を有する。
次に、表示部225による処理の具体例について説明する。図10は、予測装置の表示部による処理の具体例を示す図である。図10に示すように、表示部225は、表示情報取得部1001を有する。表示情報取得部1001は、評価部224より通知された評価結果と、予測部222より通知された予測特性とを取得し、表示データ1011を生成する。
次に、学習装置120による学習処理の流れについて説明する。図11は、学習処理の流れを示すフローチャートである。
次に、予測装置130による予測処理の流れについて説明する。図12は、予測処理の流れを示すフローチャートである。
次に、予測装置130を用いて、複数の予測対象データの組について、予測処理を行った結果(予測特性、評価結果)を以下に示すとともに、相反する2つの指標と評価結果との関係及び予測特性の検証例について説明する。
図13は、実施例1を示す図である。図13に示すように、実施例1では、複数の予測対象データとして、
・ニトロメタン、
・メタノール、
・スクロース、
・ジゴキシン、
について、それぞれ、予測特性を予測するとともに、属性値が区分けされる区間を判定することで、適正を評価した(表1310参照)。なお、上記予測対象データの材料特性(ここでは、水溶解度)は、いずれも既知であるため、予測精度を検証する趣旨で表1320に示した。
・ランク1及びランク2と評価された予測対象データについては、水溶解度の高い予測特性が得られており、かつ、良好な予測精度が得られているが、構造式が単純であり、意外性が低い。
・ランク3と評価された予測対象データについては、水溶解度が比較的高い予測特性が得られており、かつ、良好な予測精度が得られており、かつ、構造式が比較的複雑であり、意外性が高い。
・ランク4と評価された予測対象データについては、水溶解度が非常に高い予測特性が得られているが、実際には、水溶解度の低い材料であり、予測精度が著しく低い。なお、構造式は複雑であり、意外性は高い。
図14は、実施例2を示す図である。図14に示すように、実施例2では、複数の予測対象データとして、
・エリトリトール、
・メタノール、
・ラクトース、
・ラフィノース、
について、それぞれ、予測特性を予測するとともに、属性値が区分けされる区間を判定することで、適正を評価した(表1410参照)。なお、上記予測対象データの材料特性(ここでも水溶解度)は、いずれも既知であるため、予測精度を検証する趣旨で表1420に示した。
・ランク1及びランク2と評価された予測対象データについては、水溶解度の高い予測特性が得られており、かつ、良好な予測精度が得られているが、構造式が単純であり、意外性が低い。
・ランク3と評価された予測対象データについては、水溶解度が比較的高い予測特性が得られており、かつ、良好な予測精度が得られており、かつ、構造式が比較的複雑であり、意外性が高い。
・ランク4と評価された予測対象データについては、水溶解度が比較的高い予測特性が得られており、かつ、良好な予測精度が得られており、かつ、構造式が複雑であり、意外性が高い。
図15は、実施例3を示す図である。図15に示すように、実施例3では、複数の予測対象データとして、
・尿素、
・メタノール、
・カフェイン、
・ジゴキシン、
について、それぞれ、予測特性を予測するとともに、属性値が区分けされる区間を判定することで、適正を評価した(表1510参照)。なお、上記予測対象データの材料特性(ここでも水溶解度)は、いずれも既知であるため、予測精度を検証する趣旨で表1520に示した。
・ランク1及びランク2と評価された予測対象データについては、水溶解度の高い予測特性が得られており、かつ、良好な予測精度が得られているが、構造式が単純であり、意外性が低い。
・ランク3と評価された予測対象データについては、水溶解度が比較的高い予測特性が得られており、かつ、良好な予測精度が得られており、かつ、構造式が比較的複雑であり、意外性が高い。
・ランク4と評価された予測対象データについては、水溶解度が高い予測特性が得られているが、実際には、水溶解度の低い材料であり、予測精度が著しく低い。なお、構造式は複雑であり、意外性は高い。
上記実施例1~実施例3によれば、良好な予測精度のもとで、水溶解度の高い予測特性が得られ、比較的複雑な構造式を有する予測対象データ(つまり、有益な新規材料となる可能性が高い予測対象データ)は、ランク3と評価される可能性が高いことがわかる。
図16は、予測特性の検証例を示す図である。図16に示すように、実施例1~実施例3においてランク3と評価された予測対象データの水溶解度は、客観的にも高いことがわかる。つまり、予測装置130により出力される、予測対象データの予測特性及び予測対象データの評価結果は、有益な新規材料となる可能性を的確に表しているといえる。
以上の説明から明らかなように、第1の実施形態に係る予測装置は、
・学習済み予測モデルの生成に用いた学習用データセットを取得し、当該学習用データセットに含まれる複数の材料データ間で算出される属性値の度数分布から、該属性値を区分けするための複数の区間を決定する。
・予測対象データの材料データと、学習用データセットに含まれる複数の材料データとの間で算出される属性値が、複数の区間のいずれに区分けされるかを判定することで、相反する2つの指標に対する予測対象データの適正を評価する。
・予測対象データを入力することで、学習済みモデルにより予測された予測特性を、評価結果と対応付けて表示する。
上記第1の実施形態では、要約統計量として、中央値、第一四分位、第三四分位、四分位範囲を算出するとともに、係数α1、α2を決定することで、各区間を決定した。しかしながら、各区間の決定方法は、これに限定されない。
・各材料の最小の属性値の平均値、
・各材料の最小の属性値の標準偏差、
を算出し、複数の区間を、
・「属性値<(平均値+β1×標準偏差)」となる属性値が区分けされる区間、
・「(平均値+β1×標準偏差)≦属性値<(平均値+β2×標準偏差)」となる属性値が区分けされる区間、
・「(平均値+β2×標準偏差)≦属性値<(平均値+β3×標準偏差)」となる属性値が区分けされる区間、
・「(平均値+β3×標準偏差)≦属性値」となる属性値が区分けされる区間、
と決定してもよい。
・予測対象データ700の"材料データ"に含まれる材料の構造式(構造式X)について算出された最小の属性値が、選択対象の区間(例えば、所定の要約統計量が含まれる区間に近い3番目の区間)に区分けされると判定された場合、または、
・予測対象データ700の"材料データ"に含まれる材料の構造式(構造式X)が、選択対象の評価結果(例えば、ランク3)であると評価された場合、
当該材料の構造式(構造式X)を選択して、学習済み予測モデル902に入力するように制御してもよい。
110 :材料特性実験装置
120 :学習装置
130 :予測装置
140 :材料設計装置
150 :材料生成装置
160 :材料特性実験装置
201 :学習用データ取得部
202 :学習部
211 :学習用データ属性値算出部
212 :区間決定部
221 :予測対象データ取得部
222 :予測部
223 :予測対象データ属性値算出部
224 :評価部
225 :表示部
400 :学習用データセット
700 :予測対象データ
902 :学習済み予測モデル
Claims (13)
- 学習済みモデルの生成に用いられる学習用データセットを取得し、前記学習用データセットに含まれる複数のデータ間で算出される属性値の度数分布から、該属性値を区分けするための複数の区間を決定する区間決定部と、
予測対象のデータと、前記複数のデータとの間で算出される属性値が、前記複数の区間のいずれに区分けされるかを判定することで、相反する指標に対する前記予測対象のデータの適正を評価する評価部と、
前記予測対象のデータを入力することで、前記学習済みモデルにより予測された予測値を、前記評価部による評価結果と対応付けて表示する表示部と
を有する予測装置。 - 前記区間決定部は、前記複数のデータ間で算出される属性値について要約統計量を算出し、前記複数の区間を規定する、属性値の下限値または上限値を決定する、請求項1に記載の予測装置。
- 前記区間決定部は、互いに重複しない3つ以上の区間を決定する、請求項2に記載の予測装置。
- 前記評価部は、予測対象のデータと、前記複数のデータとの間で算出される属性値が、前記3つ以上の区間のうち、所定の要約統計量が含まれる区間に近い何番目の区間に区分けされるかにより、前記予測対象のデータの適正を評価する、請求項3に記載の予測装置。
- 前記評価部は、予測対象のデータと、前記複数のデータとの間で算出される属性値が、前記3つ以上の区間のうち、所定の要約統計量が含まれる区間から最も離れた区間に区分けされると判定した場合、前記予測対象のデータを、前記学習済みモデルに入力するデータから除外する、請求項3に記載の予測装置。
- 前記評価部は、予測対象のデータと、前記複数のデータとの間で算出される属性値が、前記3つ以上の区間のうち、所定の要約統計量が含まれる区間に近いR番目の区間に区分けされると判定した場合、前記予測対象のデータを、前記学習済みモデルに入力するデータとして選択する、請求項3に記載の予測装置。
- 前記学習用データセットに含まれる複数のデータ間の距離を算出する学習用データ属性値算出部と、
前記複数のデータそれぞれについて算出された他のデータとの間の距離のうち、最小距離を抽出する学習用データ最小属性値抽出部と、を更に有し、
前記区間決定部は、抽出された前記最小距離の度数分布から、該最小距離を区分けするための複数の区間を決定する、請求項1に記載の予測装置。 - 前記学習用データ属性値算出部は、前記学習用データセットに含まれるN個のデータ(Nは任意の整数)のうち、i番目(1≦i≦N)のデータと、i番目のデータを除く(N-1)個のデータとの間の距離をそれぞれ算出し、
前記学習用データ最小属性値抽出部は、前記i番目のデータについて算出された(N-1)個の距離の中から、最小距離を抽出する、
請求項7に記載の予測装置。 - 前記予測対象のデータと、前記複数のデータとの間の距離を算出する予測対象データ属性値算出部と、
前記予測対象のデータと、前記複数のデータとの間の距離のうち、最小距離を抽出する予測対象データ最小属性値抽出部と、を更に有し、
前記評価部は、前記予測対象のデータについて抽出された前記最小距離が、前記複数の区間のうちのいずれに区分けされるかを判定することで、相反する指標に対する前記予測対象のデータの適正を評価する、請求項7に記載の予測装置。 - 請求項1に記載の予測装置と、
前記予測装置の前記評価部により、前記複数のデータとの間で算出された属性値が所定の区間に区分けされると判定された予測対象のデータであって、前記予測装置の前記学習済みモデルにより、所定の条件を満たす予測値が予測された予測対象のデータを入力し、材料設計データを生成する材料設計装置と、
を有する材料設計システム。 - 学習用データセットに基づいて学習済みモデルを生成する学習装置を更に有し、
前記予測装置は、前記学習装置により生成された前記学習済みモデルに、前記予測対象のデータを入力することで前記予測値を予測する、請求項10に記載の材料設計システム。 - 学習済みモデルの生成に用いられる学習用データセットを取得し、前記学習用データセットに含まれる複数のデータ間で算出される属性値の度数分布から、該属性値を区分けするための複数の区間を決定する区間決定工程と、
予測対象のデータと、前記複数のデータとの間で算出される属性値が、前記複数の区間のいずれに区分けされるかを判定することで、相反する指標に対する前記予測対象のデータの適正を評価する評価工程と、
前記予測対象のデータを入力することで、前記学習済みモデルにより予測された予測値を、前記評価工程における評価結果と対応付けて表示する表示工程と
をコンピュータが実行する予測方法。 - 学習済みモデルの生成に用いられる学習用データセットを取得し、前記学習用データセットに含まれる複数のデータ間で算出される属性値の度数分布から、該属性値を区分けするための複数の区間を決定する区間決定工程と、
予測対象のデータと、前記複数のデータとの間で算出される属性値が、前記複数の区間のいずれに区分けされるかを判定することで、相反する指標に対する前記予測対象のデータの適正を評価する評価工程と、
前記予測対象のデータを入力することで、前記学習済みモデルにより予測された予測値を、前記評価工程における評価結果と対応付けて表示する表示工程と
をコンピュータに実行させるための予測プログラム。
Priority Applications (5)
| Application Number | Priority Date | Filing Date | Title |
|---|---|---|---|
| US18/852,625 US20250217552A1 (en) | 2022-05-13 | 2023-05-01 | Prediction device, material design system, prediction method, and prediction program |
| EP23803514.1A EP4524840A4 (en) | 2022-05-13 | 2023-05-01 | Prediction device, material design system, prediction method, and prediction program |
| JP2023548629A JP7480919B2 (ja) | 2022-05-13 | 2023-05-01 | 予測装置、材料設計システム、予測方法及び予測プログラム |
| CN202380039342.1A CN119173889A (zh) | 2022-05-13 | 2023-05-01 | 预测装置、材料设计系统、预测方法以及预测程序 |
| JP2024060722A JP2024086784A (ja) | 2022-05-13 | 2024-04-04 | 材料設計システム及び材料製造方法 |
Applications Claiming Priority (2)
| Application Number | Priority Date | Filing Date | Title |
|---|---|---|---|
| JP2022-079269 | 2022-05-13 | ||
| JP2022079269 | 2022-05-13 |
Publications (1)
| Publication Number | Publication Date |
|---|---|
| WO2023219037A1 true WO2023219037A1 (ja) | 2023-11-16 |
Family
ID=88730514
Family Applications (1)
| Application Number | Title | Priority Date | Filing Date |
|---|---|---|---|
| PCT/JP2023/017086 Ceased WO2023219037A1 (ja) | 2022-05-13 | 2023-05-01 | 予測装置、材料設計システム、予測方法及び予測プログラム |
Country Status (5)
| Country | Link |
|---|---|
| US (1) | US20250217552A1 (ja) |
| EP (1) | EP4524840A4 (ja) |
| JP (2) | JP7480919B2 (ja) |
| CN (1) | CN119173889A (ja) |
| WO (1) | WO2023219037A1 (ja) |
Citations (4)
| Publication number | Priority date | Publication date | Assignee | Title |
|---|---|---|---|---|
| WO2019171115A1 (en) * | 2018-03-05 | 2019-09-12 | Omron Corporation | Method for controlling operations of mechanical device and method and device for determining reliability of data |
| JP2020086778A (ja) * | 2018-11-21 | 2020-06-04 | 株式会社東芝 | 機械学習モデル構築装置および機械学習モデル構築方法 |
| JP2020166499A (ja) * | 2019-03-29 | 2020-10-08 | ファナック株式会社 | 検査装置、検査システム、及びユーザインタフェース |
| JP2022079269A (ja) | 2020-11-16 | 2022-05-26 | 株式会社不二越 | ロボット及び配線ケース |
-
2023
- 2023-05-01 US US18/852,625 patent/US20250217552A1/en active Pending
- 2023-05-01 EP EP23803514.1A patent/EP4524840A4/en active Pending
- 2023-05-01 WO PCT/JP2023/017086 patent/WO2023219037A1/ja not_active Ceased
- 2023-05-01 CN CN202380039342.1A patent/CN119173889A/zh active Pending
- 2023-05-01 JP JP2023548629A patent/JP7480919B2/ja active Active
-
2024
- 2024-04-04 JP JP2024060722A patent/JP2024086784A/ja active Pending
Patent Citations (4)
| Publication number | Priority date | Publication date | Assignee | Title |
|---|---|---|---|---|
| WO2019171115A1 (en) * | 2018-03-05 | 2019-09-12 | Omron Corporation | Method for controlling operations of mechanical device and method and device for determining reliability of data |
| JP2020086778A (ja) * | 2018-11-21 | 2020-06-04 | 株式会社東芝 | 機械学習モデル構築装置および機械学習モデル構築方法 |
| JP2020166499A (ja) * | 2019-03-29 | 2020-10-08 | ファナック株式会社 | 検査装置、検査システム、及びユーザインタフェース |
| JP2022079269A (ja) | 2020-11-16 | 2022-05-26 | 株式会社不二越 | ロボット及び配線ケース |
Non-Patent Citations (3)
| Title |
|---|
| IGOR I. BASKINNATALIA KIREEVAALEXANDRE VARNEK: "The One-Class Classification Approach to Data Description and to Models Applicability Domain", NOL. INF., vol. 29, 2010, pages 581,587p |
| J. S. DELANEY: "Estimating Aqueous Solubility Directly from Molecular Structure", JOURNAL OF CHEMICAL INFORMATION AND COMPUTER SCIENCES, 24 May 2004 (2004-05-24), pages 1000,1005 |
| See also references of EP4524840A4 |
Also Published As
| Publication number | Publication date |
|---|---|
| JP2024086784A (ja) | 2024-06-28 |
| CN119173889A (zh) | 2024-12-20 |
| EP4524840A1 (en) | 2025-03-19 |
| US20250217552A1 (en) | 2025-07-03 |
| JP7480919B2 (ja) | 2024-05-10 |
| JPWO2023219037A1 (ja) | 2023-11-16 |
| EP4524840A4 (en) | 2026-03-04 |
Similar Documents
| Publication | Publication Date | Title |
|---|---|---|
| JP6703264B2 (ja) | 機械学習管理プログラム、機械学習管理方法および機械学習管理装置 | |
| JP7125358B2 (ja) | 計算機システム及び入力データに対する予測結果の根拠に関する情報の提示方法 | |
| JP6954003B2 (ja) | データベースのための畳み込みニューラルネットワークモデルの決定装置及び決定方法 | |
| EP3428856A1 (en) | Information processing method and information processing device | |
| JP2018045559A (ja) | 情報処理装置、情報処理方法およびプログラム | |
| US9249287B2 (en) | Document evaluation apparatus, document evaluation method, and computer-readable recording medium using missing patterns | |
| JP6855604B2 (ja) | 短期利益を予測する方法、装置、コンピューターデバイス、プログラムおよび記憶媒体 | |
| JP7384322B2 (ja) | 予測モデル作成方法、予測方法、予測モデル作成装置、予測装置、予測モデル作成プログラム、予測プログラム | |
| US20220129792A1 (en) | Method and apparatus for presenting determination result | |
| CN114631099B (zh) | 人工智能透明度 | |
| JP2017146888A (ja) | 設計支援装置及び方法及びプログラム | |
| WO2023219037A1 (ja) | 予測装置、材料設計システム、予測方法及び予測プログラム | |
| JP2005222445A (ja) | データマイニングにおける情報処理方法及び解析装置 | |
| JP7274434B2 (ja) | 流用設計支援システム及び流用設計支援方法 | |
| US20210279608A1 (en) | Prediction rationale analysis apparatus and prediction rationale analysis method | |
| JP2003323601A (ja) | 信頼性尺度付き予測装置 | |
| JP5135803B2 (ja) | 最適パラメータ探索プログラム、最適パラメータ探索装置および最適パラメータ探索方法 | |
| Kächele et al. | Cluster Validation Based on Fisher’s Linear Discriminant Analysis | |
| JP7555274B2 (ja) | 提案装置、提案方法及びプログラム | |
| Abrar et al. | App search ranking prediction towards enhanced app store optimization using ML and NLP | |
| JP2010250391A (ja) | データ分類方法及び装置及びプログラム | |
| CN118246062B (zh) | 基于数据分级的电力数据隐私保护方法及相关设备 | |
| JP2021152751A (ja) | 分析支援装置及び分析支援方法 | |
| JP7687862B2 (ja) | 計算機システム及びサイバーセキュリティ情報の評価方法 | |
| US20230351264A1 (en) | Storage medium, accuracy calculation method, and information processing device |
Legal Events
| Date | Code | Title | Description |
|---|---|---|---|
| ENP | Entry into the national phase |
Ref document number: 2023548629 Country of ref document: JP Kind code of ref document: A |
|
| 121 | Ep: the epo has been informed by wipo that ep was designated in this application |
Ref document number: 23803514 Country of ref document: EP Kind code of ref document: A1 |
|
| WWE | Wipo information: entry into national phase |
Ref document number: 18852625 Country of ref document: US |
|
| WWE | Wipo information: entry into national phase |
Ref document number: 2023803514 Country of ref document: EP |
|
| NENP | Non-entry into the national phase |
Ref country code: DE |
|
| ENP | Entry into the national phase |
Ref document number: 2023803514 Country of ref document: EP Effective date: 20241213 |
|
| WWP | Wipo information: published in national office |
Ref document number: 18852625 Country of ref document: US |