WO2024225424A1 - 分娩後の代謝性疾患の評価方法 - Google Patents
分娩後の代謝性疾患の評価方法 Download PDFInfo
- Publication number
- WO2024225424A1 WO2024225424A1 PCT/JP2024/016392 JP2024016392W WO2024225424A1 WO 2024225424 A1 WO2024225424 A1 WO 2024225424A1 JP 2024016392 W JP2024016392 W JP 2024016392W WO 2024225424 A1 WO2024225424 A1 WO 2024225424A1
- Authority
- WO
- WIPO (PCT)
- Prior art keywords
- value
- evaluation
- calving
- cow
- current
- Prior art date
- Legal status (The legal status is an assumption and is not a legal conclusion. Google has not performed a legal analysis and makes no representation as to the accuracy of the status listed.)
- Ceased
Links
Images

























Classifications
-
- A—HUMAN NECESSITIES
- A01—AGRICULTURE; FORESTRY; ANIMAL HUSBANDRY; HUNTING; TRAPPING; FISHING
- A01K—ANIMAL HUSBANDRY; AVICULTURE; APICULTURE; PISCICULTURE; FISHING; REARING OR BREEDING ANIMALS, NOT OTHERWISE PROVIDED FOR; NEW BREEDS OF ANIMALS
- A01K29/00—Other apparatus for animal husbandry
- A01K29/002—Other apparatus for animal husbandry for monitoring or measuring size or weight of the animal, e.g. monitoring growth
-
- A—HUMAN NECESSITIES
- A01—AGRICULTURE; FORESTRY; ANIMAL HUSBANDRY; HUNTING; TRAPPING; FISHING
- A01K—ANIMAL HUSBANDRY; AVICULTURE; APICULTURE; PISCICULTURE; FISHING; REARING OR BREEDING ANIMALS, NOT OTHERWISE PROVIDED FOR; NEW BREEDS OF ANIMALS
- A01K29/00—Other apparatus for animal husbandry
- A01K29/005—Monitoring or measuring activity
-
- A—HUMAN NECESSITIES
- A01—AGRICULTURE; FORESTRY; ANIMAL HUSBANDRY; HUNTING; TRAPPING; FISHING
- A01K—ANIMAL HUSBANDRY; AVICULTURE; APICULTURE; PISCICULTURE; FISHING; REARING OR BREEDING ANIMALS, NOT OTHERWISE PROVIDED FOR; NEW BREEDS OF ANIMALS
- A01K2227/00—Animals characterised by species
- A01K2227/10—Mammal
- A01K2227/101—Bovine
Definitions
- the present invention relates to an evaluation method, a calculation method, an evaluation device, a calculation device, an evaluation program, a calculation program, a recording medium, an evaluation system, a terminal device, and a formula generation method.
- the periparturient period which lasts for three weeks after calving, is a critical period for cows. During this period, many metabolic diseases occur, including ketosis, milk fever, retained placenta, displaced abomasum, metritis, hoof disease, and mastitis.
- ketosis is an important disease that has been reported to be associated with reduced reproductive performance and milk production (Non-Patent Document 1).
- a definitive diagnosis of ketosis is made based on the concentration of beta-hydroxybutyric acid (BHBA) in the blood. If the blood BHBA concentration after parturition is 3000 ⁇ mol/l or higher, it is diagnosed as overt ketosis, and if the blood BHBA concentration after parturition is 1200 ⁇ mol/l or higher, it is diagnosed as subclinical ketosis.
- overt ketosis which is clearly diagnosed as ketosis based on clinical symptoms, attention has been paid to dealing with subclinical ketosis, which does not show clear symptoms but has a relatively high blood BHBA concentration. This is because subclinical ketosis was not previously treated, and has a large impact on the reduction of milk yield and reduced reproductive performance.
- a simple BHBA measurement kit that can easily measure blood BHBA concentrations after parturition was developed for the purpose of definitively diagnosing and treating ketosis and is used on farms.
- Non-Patent Document 2 a metabolic profile has been proposed that presents the normal range of blood indicators at each lactation stage from the dry period to late lactation, and identifies cows that deviate from the normal range as those at risk of ketosis.
- Milk fever, or parturition hypocalcemia is a metabolic disease in which a large amount of calcium is excreted in the milk after parturition, causing a drop in calcium levels in the blood and making it impossible for the muscles to contract, resulting in the inability to stand up.
- a definitive diagnosis can be made by measuring the calcium level in the blood, but there is no established method for quickly dealing with the condition when it first appears, and so it is diagnosed by visual inspection or palpation, and no method for diagnosing the risk has been disclosed.
- Placental retention occurs when the placenta does not detach after the birth of a calf and remains in the uterus, which can lead to abnormal bleeding.
- Patent Publication No. 5710180 discloses a method for predicting its onset using blood estradiol 17 ⁇ concentration as a marker.
- Abomasal displacement which is said to occur within one month of calving due to excess weight at calving and insufficient dry matter intake, can impede the digestion of feed and cause symptoms of obstruction.
- Known risk factors for abomasal displacement include blood GOT concentration, NEFA concentration, 3-hydroxybutyric acid concentration, and glucose concentration the day after calving, body condition score (BCS) before calving, number of days open since previous calving, number of inseminations, and dry period.
- a known technique for predicting the risk of mastitis is to estimate the risk of developing mastitis in parous cows based on the characteristics of milk before calving and the results of the modified CMT method.
- WO 2018/003638 an international application by the applicant, discloses a method for assessing the risk of postpartum ketosis using the blood amino acid profile of dairy cows before parturition.
- China Patent Application Publication No. 114373505 discloses a model for predicting the concentration of ⁇ -hydroxybutyric acid, known as a marker for postpartum ketosis, from the intestinal bacterial flora before parturition.
- Patent Publication No. 5710180 discloses a method for predicting the onset of placental retention using blood estradiol 17 ⁇ concentration as a marker.
- sampling from cows before parturition was an invasive method.
- an invasive method is one that puts a strain on the body.
- inserting a needle into a cow's body to take blood is an invasive method.
- WO 2021/221249 discloses an artificial intelligence-based livestock management method in which a deep learning model is created with body temperature information obtained by photographing livestock with an image camera and a thermography camera and environmental information about the livestock barn as explanatory variables, and the abnormal condition of the livestock as a target variable, to predict symptoms of disease and their infection routes as one of the abnormal signs of livestock.
- a deep learning model is created with body temperature information obtained by photographing livestock with an image camera and a thermography camera and environmental information about the livestock barn as explanatory variables, and the abnormal condition of the livestock as a target variable, to predict symptoms of disease and their infection routes as one of the abnormal signs of livestock.
- no model for predicting specific diseases is disclosed, and no method for assessing the risk of metabolic diseases, for example.
- the above-mentioned kit was developed for the purpose of definitively diagnosing and treating ketosis, and therefore cannot be used for the purpose of predicting the risk of developing ketosis after delivery before delivery. Even if the above-mentioned kit were used for such purposes, reliable results would not be obtained.
- the present invention has been made in consideration of the above, and aims to provide an evaluation method etc. that can evaluate the state of metabolic diseases after the current delivery without using blood data before the current delivery.
- the evaluation method of the present invention is characterized by including an evaluation step of performing a first evaluation to evaluate the state of metabolic disease of the cow after the current calving using a first value, which is a value related to cattle management information of the current pre-calving cow that can be obtained by a non-invasive method, an equation including a variable into which the first value is substituted and a value of the equation calculated using the first value, or a graph generated based on the first value.
- the first value may be at least one of feeding time, rumination time, metabolic protein sufficiency (MP sufficiency), metabolic energy sufficiency (ME sufficiency), dry matter intake sufficiency (DMI sufficiency), milk yield, milk yield sufficiency, and number of days since previous calving.
- MP sufficiency metabolic protein sufficiency
- ME sufficiency metabolic energy sufficiency
- DMI sufficiency dry matter intake sufficiency
- milk yield milk yield sufficiency
- the cow may be a dairy cow or a beef cow.
- the first value may be a value at a specified lactation stage.
- the first value may be at least one of the parity and the total number of milking days of the cow before the current calving.
- the first value may further have at least one attribute of the cow's parity and total number of milking days before the current calving.
- the first value may be at least one of the average value and the standard deviation.
- the first evaluation may include evaluating at least one of whether the cow is in a state where it is suffering from the metabolic disease after the current calving, and whether the cow is in a state where it is not suffering from the metabolic disease after the current calving but requires testing.
- the metabolic disease state may be the metabolic disease state at a predetermined time point after the current delivery.
- the metabolic disease may be subclinical ketosis, overt ketosis, metritis, retained placenta, displaced abomasum, milk fever, acidosis, hoof disease, or mastitis.
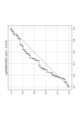
- the first evaluation may be performed using an image of the graph generated by setting the number of days since the previous calving as the value on one axis and the milk volume as the value on the other axis.
- the evaluation step may further include a second evaluation to evaluate the state of the metabolic disease of the cow after the current calving, using a second value, which is the concentration value of the amino acid in the blood of the cow before the current calving, or a value of the formula calculated using a formula including a variable into which the second value is substituted and the second value.
- a third evaluation may be further performed to evaluate the state of the metabolic disease of the cow after the current calving using a third value, which is a value related to cattle management information that can be obtained by a non-invasive method, or a value of the formula calculated using a formula including a variable into which the third value is substituted and the third value, or a graph generated based on the third value.
- a third value which is a value related to cattle management information that can be obtained by a non-invasive method, or a value of the formula calculated using a formula including a variable into which the third value is substituted and the third value, or a graph generated based on the third value.
- the evaluation method of the present invention may further include a suggestion step of proposing preventive treatment to cows that are evaluated in the evaluation step as having a high possibility of suffering from the metabolic disease after calving.
- the preventive treatment may be at least one selected from the group consisting of administration of RumenProtect amino acids, administration of a feed additive, administration of a drug, and veterinary diagnosis.
- the feed additive may be at least one selected from the group consisting of pH regulators, ion balance regulators, mycotoxin adsorbents, propionic acid analogues such as calcium propionate, vitamins, minerals, amino acids, fatty acids, urea, live bacteria agents, yeast, enzymes, antibiotics, antioxidants, antibacterial agents, and organic acids.
- statistical causal inference may be performed on cows that are evaluated as having a possibility of suffering from the metabolic disease to infer the cause of the disease and propose preventive measures corresponding to the cause.
- the evaluation step and the proposal step may be executed in a control unit of an information processing device having a control unit.
- the calculation method according to the present invention is also characterized by including a calculation step of using an equation for evaluating the state of metabolic disease of the cow after the current calving, the equation including a first value, which is a value related to cattle management information of the cow before the current calving that can be obtained by a non-invasive method, and a variable into which the first value is substituted, to calculate the value of the equation.
- the calculation step may be executed in a control unit of an information processing device that includes a control unit.
- the evaluation device is characterized in that it is an evaluation device equipped with a control unit, and the control unit is equipped with evaluation means for performing a first evaluation to evaluate the state of metabolic disease of the cow after the current calving using a first value, which is a value related to cattle management information of the cow before the current calving that can be obtained by a non-invasive method, a formula including a variable into which the first value is substituted and a value of the formula calculated using the first value, or a graph generated based on the first value.
- a first value which is a value related to cattle management information of the cow before the current calving that can be obtained by a non-invasive method
- a formula including a variable into which the first value is substituted and a value of the formula calculated using the first value or a graph generated based on the first value.
- the evaluation device is communicatively connected via a network to a terminal device that provides the first value, the value of the formula, or the graph
- the control unit further includes a data receiving means that receives the first value, the value of the formula, or the graph transmitted from the terminal device, and a result transmitting means that transmits the evaluation result obtained by the evaluation means to the terminal device, and the evaluation means may use the first value, the value of the formula, or the graph received by the data receiving means.
- the calculation device is characterized in that it is a calculation device equipped with a control unit, and the control unit is equipped with a calculation means for calculating the value of an equation for evaluating the state of a metabolic disease of the cow after the current calving, the equation including a first value, which is a value related to cattle management information of the cow before the current calving that can be obtained by a non-invasive method, and a variable into which the first value is substituted.
- the evaluation program of the present invention is an evaluation program to be executed in an information processing device having a control unit, and is characterized by including an evaluation step for performing a first evaluation to evaluate the state of metabolic disease of the cow after the current calving using a first value, which is a value related to cattle management information of the cow before the current calving that can be obtained by a non-invasive method, an equation including a variable into which the first value is substituted and the value of the equation calculated using the first value, or a graph generated based on the first value, to be executed in the control unit.
- a first value which is a value related to cattle management information of the cow before the current calving that can be obtained by a non-invasive method
- an equation including a variable into which the first value is substituted and the value of the equation calculated using the first value or a graph generated based on the first value, to be executed in the control unit.
- the calculation program according to the present invention is a calculation program to be executed in an information processing device having a control unit, and is characterized by including a calculation step for calculating the value of an equation for evaluating the state of metabolic disease of the cow after the current calving, the equation including a first value, which is a value related to cattle management information of the cow before the current calving that can be obtained by a non-invasive method, and a variable into which the first value is substituted, to be executed in the control unit.
- the recording medium according to the present invention is a computer-readable recording medium having the evaluation program or the calculation program recorded thereon.
- the recording medium according to the present invention is a non-transitory computer-readable recording medium, and is characterized in that it includes programmed instructions for causing an information processing device to execute the evaluation method or the calculation method.
- the evaluation system is an evaluation system that is configured by connecting an evaluation device having a control unit and a terminal device having a control unit via a network so that they can communicate with each other, and the control unit of the terminal device is equipped with a data transmission means that transmits to the evaluation device a first value, which is a value related to cattle management information of the current pre-calving cow that can be obtained by a non-invasive method, a formula including a variable into which the first value is substituted and the value of the formula calculated using the first value, or a graph generated based on the first value, and a result receiving means that receives an evaluation result related to the metabolic disease state of the current cattle after calving transmitted from the evaluation device, and the control unit of the evaluation device is equipped with a data receiving means that receives the first value, the value of the formula, or the graph transmitted from the terminal device, an evaluation means that evaluates the metabolic disease state of the current cattle after calving using the first value, the value of the formula, or the graph received by the data receiving means, and
- the terminal device is a terminal device equipped with a control unit, and the control unit is equipped with a result acquisition means for acquiring an evaluation result regarding the state of the metabolic disease of the cow after the current calving, and the evaluation result is a result of evaluating the state of the metabolic disease of the cow after the current calving using a first value, which is a value regarding cattle management information of the cow before the current calving that can be acquired by a non-invasive method, a formula including a variable into which the first value is substituted and a value of the formula calculated using the first value, or a graph generated based on the first value.
- a first value which is a value regarding cattle management information of the cow before the current calving that can be acquired by a non-invasive method
- a formula including a variable into which the first value is substituted and a value of the formula calculated using the first value or a graph generated based on the first value.
- the terminal device may be communicably connected to an evaluation device that performs the evaluation via a network, and the result acquisition means may receive the results transmitted from the evaluation device.
- the formula generation method of the present invention is characterized by including a formula generation step of acquiring a first value, which is a value related to cattle management information of a cow before the current calving that can be acquired by a non-invasive method, acquiring the state of metabolic disease of the cow after the current calving, and using the acquired first value and the acquired state of metabolic disease of the cow after the current calving as teacher data, generating a formula for evaluating the state of metabolic disease of the cow after the current calving before the current calving by a predetermined analysis method.
- a first value which is a value related to cattle management information of a cow before the current calving that can be acquired by a non-invasive method
- the first value may be at least one of feeding time, rumination time, metabolic protein sufficiency (MP sufficiency), metabolic energy sufficiency (ME sufficiency), dry matter intake sufficiency (DMI sufficiency), milk yield, milk yield sufficiency, and number of days since previous calving.
- MP sufficiency metabolic protein sufficiency
- ME sufficiency metabolic energy sufficiency
- DMI sufficiency dry matter intake sufficiency
- milk yield milk yield sufficiency
- the cow may be a dairy cow or a beef cow.
- the first value may be a value at a specified lactation stage.
- the first value may be at least one of the parity of the cow before the current calving and the total number of milking days.
- the first value may further have at least one attribute of the cow's parity and total number of milking days before the current calving.
- the first value may be at least one of the average value and the standard deviation.
- the state of the metabolic disease of the cow after the current calving may be a state in which the cow is suffering from the metabolic disease after the current calving, or a state in which the cow is not suffering from the metabolic disease after the current calving but requires testing.
- the metabolic disease state may be the metabolic disease state at a predetermined time point after the current delivery.
- the metabolic disease may be subclinical ketosis, overt ketosis, metritis, retained placenta, displaced abomasum, milk fever, acidosis, hoof disease, or mastitis.
- the predetermined analysis method may be at least one analysis method selected from the group consisting of a decision tree, a random forest, a neural network, and a logistic regression.
- the present invention has the effect of making it possible to evaluate the state of metabolic diseases after the current delivery without using blood data before the current delivery.
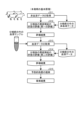
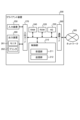
- FIG. 1 is a diagram showing the basic principle of the first embodiment.
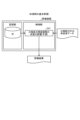
- FIG. 2 is a diagram showing the basic principle of the second embodiment.
- FIG. 3 is a diagram showing an example of the overall configuration of this system.
- FIG. 4 is a diagram showing another example of the overall configuration of the present system.
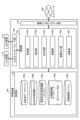
- FIG. 5 is a block diagram showing an example of the configuration of the evaluation device 100 of this system.
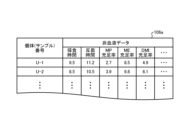
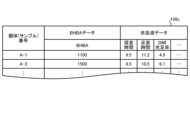
- FIG. 6 is a diagram showing an example of information stored in the non-blood data file 106a.
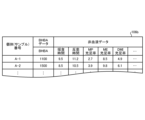
- FIG. 7 is a diagram showing an example of information stored in the BHBA state information file 106b.
- FIG. 8 is a diagram showing an example of information stored in the designated BHBA state information file 106c.
- FIG. 9 is a diagram showing an example of information stored in the formula file 106d1.
- FIG. 1 is a diagram showing the basic principle of the first embodiment.
- FIG. 2 is a diagram showing the basic principle of the second embodiment.
- FIG. 3 is a diagram showing an example of the
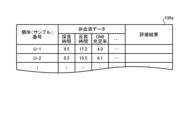
- FIG. 10 is a diagram showing an example of information stored in the evaluation result file 106e.
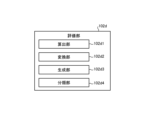
- FIG. 11 is a block diagram showing the configuration of the evaluation unit 102d.
- FIG. 12 is a block diagram showing an example of the configuration of a client device 200 of this system.
- FIG. 13 is a block diagram showing an example of the configuration of the database device 400 of this system.
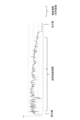
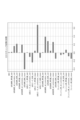
- FIG. 14 is a diagram showing a time series of verifications per production cycle.
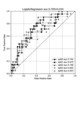
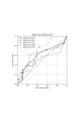
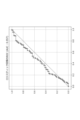
- FIG. 15 is a diagram showing the ROC and AUC scores obtained in Example 1.
- FIG. 16 is a diagram showing the ROC and AUC scores obtained in Example 2.
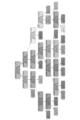
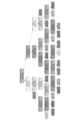
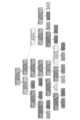
- FIG. 17 is a diagram illustrating an example of a decision tree generated in (1) of the third embodiment.
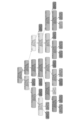
- FIG. 18 is a diagram illustrating an example of a decision tree generated in (1) of the third embodiment.
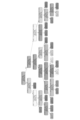
- FIG. 19 is a diagram illustrating an example of a decision tree generated in (1) of the third embodiment.
- FIG. 20 is a diagram illustrating an example of a decision tree generated in (1) of the third embodiment.
- FIG. 21 is a diagram illustrating an example of a decision tree generated in (1) of the third embodiment.
- FIG. 22 is a diagram showing the ROC and AUC scores obtained in Example 3(1).
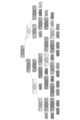
- FIG. 23 is a diagram illustrating an example of a decision tree generated in (2) of the third embodiment.
- FIG. 24 is a diagram illustrating an example of a decision tree generated in (2) of the third embodiment.
- FIG. 25 is a diagram illustrating an example of a decision tree generated in (2) of the third embodiment.
- FIG. 26 is a diagram illustrating an example of a decision tree generated in (2) of the third embodiment.
- FIG. 20 is a diagram illustrating an example of a decision tree generated in (1) of the third embodiment.
- FIG. 21 is a diagram illustrating an example of a decision tree generated in (1) of the third embodiment
- FIG. 27 is a diagram illustrating an example of a decision tree generated in (2) of the third embodiment.
- FIG. 28 is a diagram showing the ROC and AUC scores obtained in Example 3(2).
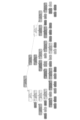
- FIG. 29 is a diagram illustrating an example of a decision tree generated in (3) of the third embodiment.
- FIG. 30 is a diagram illustrating an example of a decision tree generated in (3) of the third embodiment.
- FIG. 31 is a diagram illustrating an example of a decision tree generated in (3) of the third embodiment.
- FIG. 32 is a diagram illustrating an example of a decision tree generated in (3) of the third embodiment.
- FIG. 33 is a diagram illustrating an example of a decision tree generated in (3) of the third embodiment.
- FIG. 34 is a diagram showing the ROC and AUC scores obtained in Example 3(3).
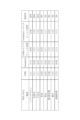
- FIG. 35 is a diagram showing coefficients of each equation.
- FIG. 36 is a diagram showing ROC_AUC.
- FIG. 37 is a diagram showing logistic regression coefficients.
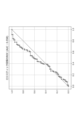
- FIG. 38 is a diagram showing the ROC of logistic regression.
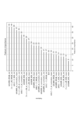
- FIG. 39 is a diagram showing feature importance.
- FIG. 40 is a diagram showing the ROC of LightGBM.
- FIG. 41 is a diagram showing the ROC of logistic regression.
- FIG. 42 is a diagram showing the ROC of LightGBM.
- FIG. 43 is a diagram showing the 11 selected explanatory variables.
- FIG. 44 is a diagram showing the nine selected explanatory variables.
- FIG. 45 is a diagram showing the 13 selected explanatory variables.
- FIG. 46 is a diagram showing a combination of two explanatory variables that configure a two-variable model.
- FIG. 46 is a diagram showing a combination of two explanatory variables that configure a two-variable model.
- FIG. 47A is a diagram showing a combination of three explanatory variables that constitute a three-variable model.
- FIG. 47B is a diagram showing a combination of three explanatory variables constituting a three-variable model.
- FIG. 47C is a diagram showing a combination of three explanatory variables that constitute a three-variable model.
- FIG. 48A is a diagram showing a combination of four explanatory variables that constitute a four-variable model.
- FIG. 48B is a diagram showing combinations of four explanatory variables that constitute a four-variable model.
- FIG. 48C is a diagram showing a combination of four explanatory variables that constitute a four-variable model.
- FIG. 48D is a diagram showing a combination of four explanatory variables that constitute a four-variable model.
- FIG. 49A is a diagram showing a combination of five explanatory variables that constitute a five-variable model.
- FIG. 49B is a diagram showing a combination of five explanatory variables that constitute a five-variable model.
- FIG. 49C is a diagram showing a combination of five explanatory variables that constitute a five-variable model.
- FIG. 49D is a diagram showing a combination of five explanatory variables that constitute a five-variable model.
- FIG. 50A is a diagram showing a combination of six explanatory variables that constitute a six-variable model.
- FIG. 50B is a diagram showing a combination of six explanatory variables that constitute a six-variable model.
- FIG. 50C is a diagram showing a combination of six explanatory variables that constitute a six-variable model.
- FIG. 50D is a diagram showing a combination of six explanatory variables that constitute a six-variable model.
- Fig. 1 is a diagram showing the basic principle of the first embodiment.
- the primary screening which is a screening carried out without using bovine blood, is carried out as follows.
- non-blood data including values (first values) related to cattle management information that can be obtained by non-invasive methods are obtained for the cow that is the subject of this pre-calving evaluation (step S11 in Figure 1).
- the non-invasive method is a method that does not put a burden on or injure the cow, and refers to, for example, a method of acquiring information from a sensor attached to the cow and a method of acquiring information from feed design information for the cow.
- the cattle to be evaluated are not particularly limited, and may be, for example, dairy cattle (dairy cattle) or beef cattle (beef cattle).
- the first value is, for example, at least one of eight numerical values: feeding time, rumination time, metabolic protein sufficiency (MP sufficiency), metabolic energy sufficiency (ME sufficiency), dry matter intake sufficiency (DMI sufficiency), milk yield, milk yield sufficiency, and number of days since previous calving.
- the first value is, for example, a value at a specified lactation stage.
- the specified lactation stage is, for example, one of four lactation stages: fresh stage (1-20 days after previous calving), pre-lactation stage (21-80 days after previous calving), peak lactation stage (81-180 days after previous calving), or late lactation stage (181 days after previous calving to 60 days before current calving).
- the division of the specified lactation period is not limited to the example described in the previous paragraph, and may be, for example, as follows: (1) early period (around 0-10 weeks), middle period (around 10-20 weeks), and late period (around 20 weeks and onward), (2) the first three weeks of the early period as the fresh period, and (3) the peak period approximately three months after calving when milk production peaks.
- the feeding time is the time the cow spends feeding.
- the rumination time is the time the cow spends ruminating (the action of returning food swallowed into the first stomach back into the square and chewing it again).
- the feeding time and rumination time can be automatically obtained daily as a behavioral history, for example, from a sensor (such as an acceleration sensor) attached to the cow.
- the metabolic protein sufficiency rate (MP sufficiency rate) is the ratio of the metabolic protein actually ingested to the amount of metabolic protein assumed from the feed design information.
- the metabolic energy sufficiency rate (ME sufficiency rate) is the ratio of the metabolic energy actually ingested to the metabolic energy assumed from the feed design information.
- the dry matter intake sufficiency rate (DMI sufficiency rate) is the ratio of the dry matter intake actually ingested to the dry matter intake assumed from the feed design information.
- the dry matter intake is the amount of feed intake minus the amount equivalent to water.
- the metabolic protein sufficiency (MP sufficiency), the metabolic energy sufficiency (ME sufficiency), and the dry matter intake sufficiency (DMI sufficiency) can be calculated using the relative ratio of feeding time.
- the value of ⁇ is adjusted so that the variance of the estimated DMI of the farm's past data becomes a specified value. By reducing the value of ⁇ , the weight when the intake time is long can be reduced.
- the milk yield can be obtained, for example, from the cow's feed design information.
- the milk yield sufficiency rate is the ratio of the actual measured milk yield to the milk yield estimated from the feed design information.
- the first value may be at least one of the cow's parity and the total number of milking days before the current calving.
- the parity is a number that indicates how many calvings the cow has experienced.
- the first value may further have at least one attribute of the cow's parity and total number of milking days before the current calving.
- the first value may be a value at a specified parity or a specified total number of milking days.
- the feeding time in the cattle management information can be expressed as the feeding time at a certain parity (the number of births the cow has experienced) or the feeding time at a certain total number of milking days.
- the first value is, for example, at least one of two statistical values: the mean value and the standard deviation.
- the combination of the four lactation stages, the eight numerical values, and the two statistical numerical values is defined as a basic data set.
- a combination that constitutes the basic data set is "the average milk volume during the peak lactation stage.”
- Another example of a combination that constitutes the basic data set is "the standard deviation of the rumination time during the fresh stage.”
- a first evaluation is performed to evaluate (predict/estimate) the metabolic disease state of the cow being evaluated after this calving using the first value contained in the non-blood data acquired in step S11 (step S12 in FIG. 1). Note that before performing step S12, data such as missing values and outliers may be removed from the non-blood data acquired in step S11.
- the first evaluation may include at least one of the following: whether the cow being evaluated is suffering from the metabolic disease after the current calving, and whether the cow being evaluated is not suffering from the metabolic disease after the current calving but requires further evaluation (the second evaluation described below).
- the metabolic disease state is, for example, the metabolic disease state at a specified time point after the current calving.
- the metabolic disease may be, for example, subclinical ketosis, overt ketosis, metritis, retained placenta, displaced abomasum, milk fever, acidosis, hoof disease, mastitis, etc.
- the first evaluation may be performed by calculating the value of an equation for evaluating the state of the metabolic disease of the cow after the current calving, the equation including the first value and a variable into which the first value is substituted. Furthermore, the variable into which the first value is substituted may be substituted with a value obtained by converting the first value, for example, using a method described below.
- the formula may further include variables into which, for example, values related to the factors listed below that affect the onset of metabolic diseases are substituted, other than the variable into which the first value is substituted.
- Parity term binary variable indicating parity or nulliparity
- the first value or the value of the formula may be converted, for example, by the methods listed below, and the converted value may be used to evaluate the postpartum metabolic disease state of the subject.
- a predetermined range e.g., a range of 0.0 to 1.0, a range of 0.0 to 10.0, a range of 0.0 to 100.0, or a range of -10.0 to 10.0, etc.
- the first value or the value of the formula may be converted by adding, subtracting, multiplying, or dividing any value, converting the first value or the value of the formula using a predetermined conversion method (e.g., exponential conversion, logarithmic conversion, angular conversion, square root conversion, probit conversion, reciprocal conversion, Box-Cox conversion, or power conversion, etc.), or by performing a combination of these calculations on the first value or the value of the formula.
- a predetermined conversion method e.g., exponential conversion, logarithmic conversion, angular conversion, square root conversion, probit conversion, reciprocal conversion, Box-Co
- the value of an exponential function with the first value or the value of the formula as the exponent and the Napier's number as the base (specifically, the value of p/(1-p) when the natural logarithm ln(p/(1-p)) when the probability p of the state of postpartum metabolic disease being in a predetermined state (for example, a state in which the blood BHBA concentration exceeds a reference value) is defined is equal to the first value or the value of the formula) may be further calculated, and a value obtained by dividing the calculated exponential function value by the sum of 1 and the value itself (specifically, the value of probability p) may be further calculated.
- the first value or the value of the formula may be converted so that the converted value under a specific condition is a specific value.
- the first value or the value of the formula may be converted so that the converted value is 5.0 when the sensitivity is 95% and 8.0 when the sensitivity is 80%.
- the first value may be converted into a standard deviation value so that the average is 50 and the standard deviation is 10.
- the value of the formula may be converted into a standard deviation value so that the average is 50 and the standard deviation is 10.
- position information regarding the position of a predetermined mark on a predetermined ruler that is visibly displayed on a display device such as a monitor or a physical medium such as paper may be generated using the first value (the converted value if the value is converted) or the value of the formula (the converted value if the value of the formula is converted), and the generated position information may be used as the evaluation result regarding the postpartum metabolic disease state of the evaluation subject.
- the predetermined ruler is for evaluating the postpartum metabolic disease state, and is, for example, a ruler with a scale that shows at least scales corresponding to the upper and lower limits of the "range in which the first value or the value of the formula can be taken" or "a part of the range".
- the predetermined mark corresponds to the first value or the value of the formula, or the converted value, and is, for example, a circle or a star.
- the state of the postpartum metabolic disease of the subject may be evaluated.
- a predetermined value such as the mean value ⁇ 1 SD, 2 SD, 3 SD, N quantile, N percentile, or a cutoff value recognized for clinical significance
- the state of the postpartum metabolic disease of the subject may be evaluated.
- a standard deviation may be used instead of the first value or the value of the formula itself. For example, when the standard deviation is less than the mean value - 2 SD (standard deviation ⁇ 30) or when the standard deviation is higher than the mean value + 2 SD (standard deviation > 70), the state of the postpartum metabolic disease of the subject may be evaluated.
- the risk (possibility) of the subject developing a metabolic disease after delivery may be qualitatively evaluated.
- the first value and one or more preset thresholds, or the first value and an equation including a variable into which the first value is substituted and one or more preset thresholds may be used to classify the subject into one of a plurality of categories defined by at least considering the degree of risk of developing a metabolic disease after delivery.
- the plurality of categories may include a category for subjects with a high risk of developing a metabolic disease after delivery (e.g., subjects whose postpartum blood BHBA concentration is equal to or greater than a reference value (e.g., 1200 ⁇ mol/dl)) and a category for subjects whose postpartum blood BHBA concentration is less than a reference value (e.g., 1200 ⁇ mol/dl).
- the plurality of categories may also include a category for subjects whose postpartum blood BHBA concentration is high, a category for subjects whose postpartum blood BHBA concentration is low, and a category for subjects whose postpartum metabolic disease risk is medium.
- the concentration value of BHBA in the postpartum blood of the subject may be estimated, for example, using the first value and one or more preset threshold values, or using an equation including the first value and a variable into which the first value is substituted, and one or more preset threshold values.
- the first value or the value of the formula may be converted by a predetermined method, and the converted value may be used to classify the evaluation target into one of a plurality of categories.
- the formula used for the evaluation can be in any format, but may be, for example, in the format shown below.
- Linear models such as multiple regression equations based on the least squares method, linear discriminant equations, principal component analysis, and canonical discriminant analysis
- Generalized linear models such as logistic regression and Cox regression based on the maximum likelihood method
- Generalized linear mixed models that take into account random effects such as individual differences and facility differences in addition to generalized linear models - Equations created based on Bayesian statistics such as MCMC (Markov chain Monte Carlo method), Bayesian networks, and naive Bayes methods - Equations created by cluster analysis such as K-means method and hierarchical cluster analysis - Equations created by class classification such as k-nearest neighbor method, support vector machine, and decision tree - Equations created by deep learning based on neural networks, convolutional neural networks, and recursive neural networks - Equations created by class classification based on ensemble learning such as random forest and gradient boosting - Equations created by class classification
- the formula used in the evaluation may be prepared, for example, by the method described in International Publication No. WO 2004/052191, an international application filed by the present applicant, or the method described in International Publication No. WO 2006/098192, an international application filed by the present applicant. Note that, if the formula is obtained by these methods, the formula can be suitably used to evaluate the state of postpartum metabolic diseases, regardless of the unit of the first value in the non-blood data as input data.
- coefficients and constant terms are added to each variable, and these coefficients and constant terms are preferably real numbers, more preferably values within the range of the 99% confidence interval of the coefficients and constant terms obtained to perform the various classifications from the data, and even more preferably values within the range of the 95% confidence interval of the coefficients and constant terms obtained to perform the various classifications from the data.
- the value of each coefficient and its confidence interval may be multiplied by a real number, and the value of the constant term and its confidence interval may be added, subtracted, multiplied, or divided by any real constant.
- linear transformation addition of a constant, constant multiplication
- monotonically increasing (decreasing) transformation for example, logit transformation, etc.
- Fractional expressions are expressions in which the numerator is the sum of the variables A, B, C, ... and/or the denominator is the sum of the variables a, b, c, .... Fractional expressions also include sums of fractional expressions of this type ⁇ , ⁇ , ⁇ , ... (such as ⁇ + ⁇ ). Fractional expressions also include divided fractional expressions.
- the variables used in the numerator and denominator may each have an appropriate coefficient.
- the variables used in the numerator and denominator may also be duplicated.
- Each fractional expression may have an appropriate coefficient.
- the coefficient value of each variable and the value of the constant term may be real numbers.
- fractional formulas include those in which the numerator and denominator variables have been swapped.
- the first evaluation may be performed using a graph generated based on the first value.
- the first evaluation may be performed by a convolutional neural network (CNN) using an image of the graph generated by taking the number of days since the previous calving as a value on one axis (X-axis) and the milk volume as a value on the other axis (Y-axis).
- the graph generated may be any figure created using cattle management information, such as a scatter plot, line graph, radar chart, bar graph, pie chart, bar graph, histogram, etc.
- the evaluation method according to this embodiment makes it possible to evaluate the state of metabolic diseases after the current calving without using blood data before the current calving. More specifically, by performing the primary screening according to this embodiment using information obtained daily from a sensor (the feeding time and the rumination time) and feed design information, rather than the cow's blood data, it is possible to provide highly reliable information regarding the state of metabolic diseases after the current calving before the current calving. This can, for example, save dairy farmers the trouble of taking blood samples from each cow.
- step S12 an evaluation method including step S12 was described, but the present invention may also be a rearing method, feeding method, etc. that includes step S12.
- the primary screening described in [1-1], which is performed without using blood data may be followed by the secondary screening (blood screening) described in [1-2], which is performed using blood data.
- the selection of cattle to be subject to secondary screening can be carried out, for example, as follows. That is, as a result of the primary screening using a decision tree and logistic regression, among the cattle that were judged to be "at risk" in the primary screening using the decision tree, the top N cattle (e.g. 12 cattle) with high risk values in the primary screening using logistic regression may be selected as the cattle to be subject to secondary screening. Then, the secondary screening is carried out as follows.
- blood data including concentration values (second values) of amino acids in the blood (including, for example, plasma, serum, etc.) of the cow to be evaluated before this pre-calving is obtained (step S13 in FIG. 1).
- the blood data may further include biochemical test values together with or instead of the concentration values.
- concentration values and test values may be, for example, those described in WO 2018/003638, an international application by the present applicant.
- step S13 blood data measured by a company or the like that measures the concentration value or the test value may be obtained.
- the blood data may be obtained by measuring the concentration value or the test value from prepartum blood collected from the subject to be evaluated, for example, by the following measurement method (A), (B), or (C).
- the unit of the concentration value may be, for example, molar concentration, weight concentration, or enzyme activity, or may be obtained by adding, subtracting, multiplying, or dividing any constant by these concentrations.
- A The collected blood samples are centrifuged to separate plasma from the blood. All plasma samples are frozen and stored at ⁇ 80° C. until the measurement of the concentration value.
- concentration value When the concentration value is measured, 0.02 N hydrochloric acid is added and protein is removed by ultrafiltration, followed by pre-column derivatization using a labeling reagent (3-aminopyridyl-N-hydroxysuccinimidyl carbamate), and the concentration value is analyzed by liquid chromatography mass spectrometry (LC/MS) (see WO 2003/069328 and WO 2005/116629).
- LC/MS liquid chromatography mass spectrometry
- concentration values 0.02N hydrochloric acid is added, and protein is removed by ultrafiltration, after which the concentration values are analyzed using an amino acid analyzer based on the post-column derivatization method using a ninhydrin reagent.
- C The collected blood sample is subjected to blood cell separation using membranes, MEMS technology, or the principle of centrifugation to separate plasma or serum from the blood. Plasma or serum samples that are not subjected to concentration measurement immediately after plasma or serum acquisition are frozen and stored at -80°C until the concentration value is measured.
- the concentration value is analyzed by quantifying substances or spectroscopic values that increase or decrease due to substrate recognition using molecules such as enzymes and aptamers that react or bind with the target amino acids or biochemistry.
- a second evaluation is performed to evaluate (predict/estimate) the metabolic disease state of the cow being evaluated after this calving using the second value contained in the blood data acquired in step S13 (step S14 in Figure 1). Note that before executing step S14, data such as missing values and outliers may be removed from the blood data acquired in step S13.
- the second evaluation may be performed by calculating the value of an equation for evaluating the state of the metabolic disease of the cow after the current calving, the equation including the second value and a variable into which the second value is substituted. Furthermore, the variable into which the second value is substituted may be substituted with a value obtained by converting the second value, for example, using a method described below.
- the secondary screening using blood data can be carried out after narrowing down the number of cows through the primary screening. This means that even when carrying out secondary screening, dairy farmers do not need to collect blood from all of their cows, significantly reducing the burden on them.
- tertiary screening (classification of medium-risk group)
- tertiary clustering which is clustering performed using information related to cattle management information that can be obtained by non-invasive methods, is performed on cattle (medium-risk group cattle) excluding "cattle judged to have an extremely high risk of contracting the metabolic disease in the secondary screening (high-risk group cattle)" and "healthy cattle judged to have a low risk of contracting the metabolic disease in the secondary screening (low-risk group cattle).
- the high-risk group of cattle are cattle that require preventive treatment as diagnosed by a veterinarian.
- the low-risk group of cattle are cattle that do not require preventive treatment.
- the medium-risk group of cattle are cattle for which preventive treatment by administering feed additives is effective.
- By further classifying the medium-risk group of cattle using the tertiary clustering it is possible to determine the feed additives appropriate for each classification, taking into account the attribute information, causal relationships, and mechanisms of action for each classification.
- the tertiary clustering can also be considered as a third evaluation that evaluates the state of the metabolic disease of the cow after the current calving using a third value, which is a value related to cattle management information that can be obtained by a non-invasive method, or a value of the formula calculated using a formula including a variable into which the third value is substituted and the third value, or a graph generated based on the third value, following the second evaluation (step S14).
- a third value which is a value related to cattle management information that can be obtained by a non-invasive method, or a value of the formula calculated using a formula including a variable into which the third value is substituted and the third value, or a graph generated based on the third value, following the second evaluation (step S14).
- the selection of cattle to be the subject of tertiary clustering can be carried out, for example, as follows. That is, as a result of the secondary screening using logistic regression, the top N cattle (e.g. 12 cattle) with high risk values and the bottom M cattle (e.g. 10 cattle) with low risk values may be excluded and the cattle selected as the subject of tertiary clustering may be selected.
- the top N cattle e.g. 12 cattle
- the bottom M cattle e.g. 10 cattle
- Hierarchical clustering As a method for tertiary clustering, hierarchical clustering, non-hierarchical clustering such as the k-means method, and a Gaussian mixture model can be used. Furthermore, the method disclosed in JP 2022-013409 A can also be used.
- a preventive treatment is proposed (step S15 in FIG. 1).
- the proposal of the preventive treatment may be made after only the first evaluation (primary screening), after the first evaluation (primary screening) and the second evaluation (secondary screening), or after the first evaluation (primary screening), the second evaluation (secondary screening), and the third evaluation (tertiary screening).
- the preventive treatment is, for example, at least one selected from the group consisting of administration of RumenProtect amino acids such as AjiPro (registered trademark)-L, administration of feed additives, administration of medicines, and veterinary diagnosis.
- AjiPro (registered trademark)-L for example, the one described in International Publication WO 2008/041371, an international application by the present applicant, can be used.
- the feed additive is, for example, at least one selected from the group consisting of pH adjusters, ion balance adjusters, mycotoxin adsorbents, propionic acid analogs such as calcium propionate, vitamins, minerals, amino acids, fatty acids, urea, probiotics, yeast, enzymes, antibiotics, antioxidants, antibacterial agents, and organic acids.
- step S15 for cattle that are evaluated as having a possibility of suffering from the metabolic disease, statistical causal inference may be performed to infer the cause of the disease and preventive treatment corresponding to the cause may be proposed.
- the proposed preventive treatment may be changed depending on the first evaluation (primary screening) and the degree of risk of metabolic disease.
- a clustering analysis may be performed on cattle that are evaluated as having a medium risk in the primary screening to further subdivide the degree of risk and propose the cause and the corresponding preventive treatment for each.
- a preventive treatment may be proposed again for each leaf node based on the result of the decision tree in which the primary screening was performed.
- a causal search analysis may be performed on cattle in the medium risk group to analyze the causality between the explanatory variables and the metabolic disease, and the type of preventive treatment may be selected.
- a preventive treatment may be proposed by individual handling by a veterinarian.
- the metabolic energy sufficiency rate (ME sufficiency rate) or the metabolic protein sufficiency rate (MP sufficiency rate) and the results of the secondary screening (blood screening) may be used to suggest changes to the feed design information as described below.
- the required standard for the fresh period (1-20 days after the previous delivery) is that the ME or MP sufficiency rate exceeds 80%. However, if the result of the secondary screening is "positive (high risk)", an additional required standard will be set at +2% for the ME sufficiency rate and +6% for the MP sufficiency rate.
- the fresh phase score can be calculated by multiplying "1 - (number of cows determined to be in short supply/total number of cows in the fresh phase)" by 100. For example, if the total number of cows in the fresh phase is 30 and the "number of cows determined to be in short supply” is 12, the fresh phase score can be calculated as 60pt by multiplying "1 - (12/30)" by 100.
- the required standard for late lactation is that ME or MP sufficiency rate during the late lactation period (181 days after the previous calving to 60 days before the current calving) must be 120% or less.
- the late lactation score can be calculated by multiplying "1 - (number of cows determined to be overweight/total number of cows in late lactation)" by 100. For example, if the total number of cows in late lactation is 120 and the "number of cows determined to be overweight" is 20, the late lactation score can be calculated as 83.3 pts by multiplying "1 - (20/120)" by 100.
- a health score (combined value) is calculated based on the calculated fresh phase score and the calculated late lactation score.
- the health score can be calculated using the formula "fresh phase score x fresh phase importance + late lactation score x late lactation importance".
- the calculated health score of 69.3 pts is the current health score calculated using the current feed design information.
- a provisional health score can be calculated using provisional feed design information (e.g., with a changed nutritional concentration). If the calculated provisional health score is greater than the current health score of 69.3 pts, this means that the provisional feed design information is preferable, and therefore a change to the feed design information can be proposed by proposing the provisional feed design information instead of the current feed design information.
- a first value is obtained, which is a value related to cattle management information that can be obtained non-invasively for the current pre-calving cow.
- the cattle are not particularly limited, and may be, for example, dairy cattle (dairy cattle) or beef cattle (beef cattle).
- the first value is, for example, at least one of feeding time, rumination time, metabolic protein sufficiency (MP sufficiency), metabolic energy sufficiency (ME sufficiency), dry matter intake sufficiency (DMI sufficiency), milk yield, milk yield sufficiency, and number of days since previous calving.
- the first value is, for example, a value at a specified lactation stage.
- the first value may be at least one of the cow's parity and total number of milking days before the current calving.
- the first value may further include at least one of the attributes of the cow's parity and total number of milking days before the current calving.
- the first value is, for example, at least one of the two statistical values, the mean value and the standard deviation.
- the state of the metabolic disease of the cow after the current calving is obtained.
- the state of the metabolic disease of the cow after the current calving is, for example, whether the cow is suffering from the metabolic disease after the current calving, or whether the cow is not suffering from the metabolic disease after the current calving but needs to be examined.
- binary information indicating whether the cow has a metabolic disease or not may be obtained, or graded information indicating whether the cow is in one of three states: overt ketosis, in which the post-calving blood BHBA concentration is 3000 ⁇ mol/l or more; subclinical ketosis, in which the post-calving blood BHBA concentration is 1200 ⁇ mol/l or more; or non-ketosis, in which the post-calving blood BHBA concentration is less than 1200 ⁇ mol/l.
- the metabolic disease state is, for example, the metabolic disease state at a specified time point after the current calving.
- the metabolic disease may be, for example, subclinical ketosis, overt ketosis, metritis, retained placenta, displaced abomasum, milk fever, acidosis, hoof disease, mastitis, etc.
- a formula is generated using a specified analysis method to evaluate the state of the metabolic disease of the cow after the current calving compared to before the current calving.
- the predetermined analysis method is not particularly limited, but is, for example, at least one analysis method selected from the group consisting of decision trees, random forests, neural networks, and logistic regression.
- An example of the neural network is a convolutional neural network (CNN).
- FIG. 2 is a diagram showing the basic principle of the second embodiment.
- descriptions overlapping with those of the first embodiment may be omitted.
- a case in which the value of the formula or a value obtained after conversion of the value of the formula is used when evaluating the state of a metabolic disease after delivery is described as an example here, but the first value or a value obtained after conversion thereof may also be used, for example.
- the control unit evaluates the postpartum metabolic disease state of the subject by calculating the value of an equation stored in advance in the storage unit, the equation including the first value contained in the non-blood data and a variable into which the first value is substituted (step S21 in FIG. 2).
- step S21 may be one created based on the formula creation process (steps 1 to 4) described below. Here, we will provide an overview of the formula creation process.
- BHBA status information which may be data from which missing values or outliers have been removed in advance
- multiple candidate formulas may be created from the BHBA condition information by using multiple different formula creation methods (including those related to multivariate analysis such as principal component analysis, discriminant analysis, support vector machine, multiple regression analysis, Cox regression analysis, logistic regression analysis, k-means method, cluster analysis, and decision tree).
- multiple groups of candidate formulas may be created simultaneously in parallel using multiple different algorithms for BHBA condition information, which is multivariate data consisting of non-blood data before parturition and BHBA data after parturition obtained from a large number of cows.
- discriminant analysis and logistic regression analysis may be performed simultaneously using different algorithms to create two different candidate formulas.
- candidate formulas may be created by converting BHBA condition information using a candidate formula created by performing principal component analysis and performing discriminant analysis on the converted BHBA condition information. This allows the creation of a formula that is optimal for evaluation.
- the candidate equation created using principal component analysis is a linear equation including each variable that maximizes the variance of all non-blood data.
- the candidate equation created using discriminant analysis is a higher-order equation (including exponential and logarithmic) including each variable that minimizes the ratio of the sum of the variance within each group to the variance of all non-blood data.
- the candidate equation created using support vector machine is a higher-order equation (including kernel function) including each variable that maximizes the boundary between groups.
- the candidate equation created using multiple regression analysis is a higher-order equation including each variable that minimizes the sum of the distance from all non-blood data.
- the candidate equation created using Cox regression analysis is a linear model including a log hazard ratio, and is a linear equation including each variable and its coefficient that maximizes the likelihood of the model.
- the candidate equation created using logistic regression analysis is a linear model that represents the log odds of the probability, and is a linear equation including each variable that maximizes the likelihood of the probability.
- the k-means method is a method of searching k neighbors of each non-blood data, defining the group to which the most neighboring points belong as the group to which the data belongs, and selecting the variable that best matches the defined group to which the input blood data belongs.
- Cluster analysis is a method of clustering (grouping) points that are closest to each other among all non-blood data.
- a decision tree is a method of ranking variables and predicting the group of non-blood data from the possible patterns of variables with higher rankings.
- the control unit verifies (cross-validates) the candidate formulas created in step 1 based on a predetermined verification method (step 2).
- Candidate formula verification is performed for each candidate formula created in step 1.
- the candidate formula may be verified for at least one of the discrimination rate, sensitivity, specificity, information criterion, ROC_AUC (area under the receiver characteristic curve), etc. based on at least one of the bootstrap method, hold-out method, N-fold method, leave-one-out method, etc. This makes it possible to create candidate formulas with high predictability or robustness that take into account BHBA state information and evaluation conditions.
- the discrimination rate is, for example, the proportion of subjects who have developed a metabolic disease after delivery (specifically, subjects whose postpartum blood BHBA concentration is equal to or greater than a reference value (e.g., 1200 ⁇ mol/dl)) correctly evaluated as "high risk (specifically, equal to or greater than the reference value)" by the evaluation method according to this embodiment, and subjects who have not developed a metabolic disease after delivery (specifically, subjects whose postpartum blood BHBA concentration is less than a reference value (e.g., 1200 ⁇ mol/dl)) correctly evaluated as "low risk (specifically, less than the reference value)" by the evaluation method according to this embodiment.
- a reference value e.g. 1200 ⁇ mol/dl
- the sensitivity is, for example, the proportion of subjects who have developed a metabolic disease after delivery (specifically, subjects whose postpartum blood BHBA concentration is equal to or greater than a reference value) correctly evaluated as "high risk (specifically, equal to or greater than the reference value)" by the evaluation method according to this embodiment.
- the specificity is, for example, the proportion of subjects who did not develop metabolic disease after delivery (specifically, subjects whose blood BHBA concentration after delivery is below the reference value) that are correctly evaluated as "low risk (specifically, below the reference value)" by the evaluation method according to this embodiment.
- Akaike's information criterion is a criterion that indicates the degree to which observed data matches a statistical model in the case of regression analysis, etc., and determines that the model with the smallest value defined by "-2 x (maximum logarithmic likelihood of statistical model) + 2 x (number of free parameters of statistical model)" is the best.
- ROC_AUC area under the curve of the receiver characteristic curve
- ROC receiver characteristic curve
- control unit selects a combination of non-blood data included in the BHBA state information to be used when creating the candidate formula by selecting variables for the candidate formula based on a predetermined variable selection method (step 3).
- variable selection may be performed for each candidate formula created in step 1. This allows the variables for the candidate formula to be appropriately selected.
- Step 1 is then executed again using the BHBA state information including the non-blood data selected in step 3.
- variables for the candidate formula may be selected based on at least one of the stepwise method, best path method, local search method, and genetic algorithm from the verification results in step 2.
- the best path method is a method of selecting variables by sequentially reducing the variables included in the candidate formula one by one and optimizing the evaluation index provided by the candidate formula.
- control unit repeatedly executes steps 1, 2, and 3 described above, and creates a formula to be used during evaluation by selecting a candidate formula to be used during evaluation from among multiple candidate formulas based on the verification results accumulated thereby (step 4).
- selection of a candidate formula may involve, for example, selecting the optimal one from among candidate formulas created using the same formula creation method, or selecting the optimal one from among all candidate formulas.
- the processes related to the creation of candidate equations, verification of the candidate equations, and selection of variables for the candidate equations are systematized (systemized) into a series of steps based on the BHBA state information, and executed, making it possible to create an equation that is optimal for evaluating the state of postpartum metabolic diseases.
- the non-blood data is used in multivariate statistical analysis, and a variable selection method and cross-validation are combined to select an optimal and robust set of variables, to extract an equation with high evaluation performance.
- this section [2-1] has explained the outline of the second embodiment when performing primary screening, but by replacing "non-blood data" in this section [2-1] with “blood data” and “first value” in this section [2-1] with “second value,” the outline of the second embodiment when performing secondary screening can also be applied.
- Fig. 3 is a diagram showing an example of the overall configuration of this system.
- Fig. 4 is a diagram showing another example of the overall configuration of this system.
- this system is configured by connecting an evaluation device 100 that evaluates the state of postpartum metabolic diseases and a client device 200 (corresponding to the terminal device of the present invention) that provides non-blood data in a manner that allows communication via a network 300.
- a client device 200 corresponding to the terminal device of the present invention
- this system may also be configured by connecting a database device 400 that stores BHBA state information used when creating a formula in the evaluation device 100 and formulas used in evaluation, in a manner that allows communication via the network 300.
- Fig. 5 is a block diagram showing an example of the configuration of the evaluation device 100 of this system, and conceptually shows only the parts of the configuration that are related to the present invention.
- the evaluation device 100 is composed of a control unit 102 such as a CPU that controls the evaluation device in an integrated manner, a communication interface unit 104 that communicatively connects the evaluation device to a network 300 via a communication device such as a router and a wired or wireless communication line such as a dedicated line, a storage unit 106 that stores various databases, tables, files, etc., and an input/output interface unit 108 that connects to an input device 112 and an output device 114, and these units are communicatively connected via any communication path.
- the evaluation device 100 may be composed in the same housing as various analysis devices (e.g., non-blood data analysis devices, etc.).
- a small analysis device having a configuration (hardware and software) that calculates (measures) the first value and outputs (prints, displays on a monitor, etc.) the calculated value may further include an evaluation unit 102d described later, and the results obtained by the evaluation unit 102d may be output using the configuration.
- the communication interface unit 104 mediates communication between the evaluation device 100 and the network 300 (or a communication device such as a router). In other words, the communication interface unit 104 has the function of communicating data with other terminals via a communication line.
- the input/output interface unit 108 is connected to an input device 112 and an output device 114.
- the output device 114 may be a monitor (including a home television), a speaker, or a printer.
- the input device 112 may be a keyboard, a mouse, a microphone, or a monitor that works with a mouse to provide a pointing device function.
- the memory unit 106 is a storage means, and may be, for example, a memory device such as a RAM or ROM, a fixed disk device such as a hard disk, a flexible disk, an optical disk, etc.
- the memory unit 106 records computer programs that work in conjunction with the OS (Operating System) to give commands to the CPU to perform various processes. As shown in the figure, the memory unit 106 stores a non-blood data file 106a, a BHBA status information file 106b, a specified BHBA status information file 106c, a formula-related information database 106d, and an evaluation result file 106e.
- the non-blood data file 106a stores non-blood data related to the first value.
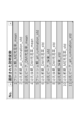
- FIG. 6 is a diagram showing an example of information stored in the non-blood data file 106a.
- the information stored in the non-blood data file 106a is configured by associating an individual number for uniquely identifying the individual (sample) to be evaluated with non-blood data.
- the non-blood data is treated as a numerical value, i.e., a continuous scale, but the non-blood data may be a nominal scale or an ordinal scale. In the case of a nominal scale or an ordinal scale, analysis may be performed by assigning an arbitrary numerical value to each state.
- values related to the above-mentioned factors that affect the occurrence of metabolic diseases may be combined with the non-blood data.
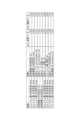
- FIG. 7 is a diagram showing an example of information stored in BHBA state information file 106b.
- the information stored in BHBA state information file 106b is configured by correlating individual numbers, BHBA data (T) indicating the concentration value of BHBA in blood after delivery, and non-blood data.
- T BHBA data
- the BHBA data and non-blood data are treated as numerical values (i.e., continuous scale), but the BHBA data and non-blood data may be nominal or ordinal scales. In the case of nominal or ordinal scales, analysis may be performed by assigning any numerical value to each state.
- the designated BHBA status information file 106c stores the BHBA status information designated by the designation unit 102b, which will be described later.
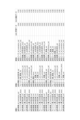
- FIG. 8 is a diagram showing an example of information stored in the designated BHBA status information file 106c. As shown in FIG. 8, the information stored in the designated BHBA status information file 106c is configured by associating an individual number, designated BHBA data, and designated non-blood data with each other.
- the formula-related information database 106d is composed of a formula file 106d1 that stores formulas created by the formula creation unit 102c, which will be described later.
- the formula file 106d1 stores formulas used during evaluation.
- FIG. 9 is a diagram showing an example of information stored in the formula file 106d1. As shown in FIG. 9, the information stored in the formula file 106d1 is composed of a rank, a formula (in FIG.
- Fp feeding time, (7), Fp (feeding time, rumination time, DMI fulfillment rate), Fk (feeding time, rumination time, DMI fulfillment rate, ...), etc.), a threshold value corresponding to each formula creation method, and a verification result of each formula (for example, the value of each formula), which are mutually associated with each other.
- FIG. 10 is a diagram showing an example of information stored in the evaluation result file 106e.
- the information stored in the evaluation result file 106e is configured by correlating an individual number for uniquely identifying the individual (sample) to be evaluated, non-blood data of the individual previously acquired, and evaluation results regarding the state of metabolic diseases after delivery (for example, the value of a formula calculated by a calculation unit 102d1, which will be described later, the converted value obtained by a conversion unit 102d2, which will be described later, the position information generated by a generation unit 102d3, which will be described later, or the classification result obtained by a classification unit 102d4, which will be described later, etc.).
- control unit 102 has an internal memory for storing control programs such as an OS (Operating System), programs that define various processing procedures, required data, etc., and executes various information processing based on these programs.
- control unit 102 is broadly equipped with an acquisition unit 102a, a designation unit 102b, a formula creation unit 102c, an evaluation unit 102d, a result output unit 102e, and a transmission unit 102f.
- the control unit 102 also performs data processing such as removing data with missing values, removing data with many outliers, and removing variables with many missing values for the BHBA status information transmitted from the database device 400 and the non-blood data transmitted from the client device 200.
- the acquisition unit 102a acquires information (specifically, non-blood data, BHBA state information, and formulas, etc.). For example, the acquisition unit 102a may acquire information by receiving information (specifically, non-blood data, BHBA state information, and formulas, etc.) transmitted from the client device 200 or the database device 400 via the network 300, etc. The acquisition unit 102a may receive data used in the evaluation transmitted from a client device 200 other than the client device 200 to which the evaluation results are transmitted. For example, if the evaluation device 100 has a mechanism (including hardware and software) for reading information recorded on a recording medium, the acquisition unit 102a may acquire information by reading information (specifically, non-blood data, BHBA state information, and formulas, etc.) recorded on the recording medium via the mechanism.
- the designation unit 102b designates the BHBA data and non-blood data to be targeted when creating the formula.
- the formula creation unit 102c creates a formula based on the BHBA state information acquired by the acquisition unit 102a and the BHBA state information specified by the designation unit 102b. If the formula is stored in advance in a specified storage area of the storage unit 106, the formula creation unit 102c may create the formula by selecting a desired formula from the storage unit 106. The formula creation unit 102c may also create a formula by selecting and downloading a desired formula from another computer device (e.g., database device 400) that has formulas stored in advance.
- another computer device e.g., database device 400
- the evaluation unit 102d evaluates the individual's postpartum metabolic disease state by calculating the value of the formula using a formula obtained in advance (e.g., a formula created by the formula creation unit 102c or a formula acquired by the acquisition unit 102a) and the first value included in the non-blood data acquired by the acquisition unit 102a.
- the evaluation unit 102d may also evaluate the individual's postpartum metabolic disease state using the first value or a value obtained after conversion thereof.
- the evaluation unit 102d may also evaluate the state of the individual's postpartum metabolic disease using a graph generated based on the first value included in the non-blood data acquired by the acquisition unit 102a. Specifically, the evaluation unit 102d may evaluate the state of the individual's postpartum metabolic disease using a convolutional neural network (CNN) using an image of the graph generated by taking the number of days since the previous delivery as a value on one axis (X-axis) and the amount of milk expressed as a value on the other axis (Y-axis).
- CNN convolutional neural network
- FIG. 11 is a block diagram showing the configuration of the evaluation unit 102d, and conceptually shows only the parts of the configuration that are relevant to the present invention.
- the evaluation unit 102d further includes a calculation unit 102d1, a conversion unit 102d2, a generation unit 102d3, and a classification unit 102d4.
- the calculation unit 102d1 calculates the value of the expression using an expression that includes the first value and a variable into which the first value is substituted.
- the evaluation unit 102d may store the value of the expression calculated by the calculation unit 102d1 as the evaluation result in a specified storage area of the evaluation result file 106e.
- the conversion unit 102d2 converts the value of the formula calculated by the calculation unit 102d1, for example, using the conversion method described above.
- the conversion unit 102d2 may also convert the first value included in the non-blood data, for example, using the conversion method described above.
- the evaluation unit 102d may also store the converted value obtained by the conversion unit 102d2 as the evaluation result in a specified storage area of the evaluation result file 106e.
- the generating unit 102d3 generates position information regarding the position of a specified mark on a specified ruler that is visibly shown on a display device such as a monitor or a physical medium such as paper, using the value of the formula calculated by the calculating unit 102d1 or the converted value obtained by the converting unit 102d2 (which may be the first value or its converted value).
- the evaluating unit 102d may store the position information generated by the generating unit 102d3 in a specified storage area of the evaluation result file 106e as the evaluation result.
- the classification unit 102d4 uses the value of the formula calculated by the calculation unit 102d1 or the converted value obtained by the conversion unit 102d2 (which may be the first value or its converted value) to classify the individual into one of a number of categories defined with at least consideration of the degree of risk of developing a metabolic disease after delivery.
- the result output unit 102e outputs the processing results of each processing unit in the control unit 102 (including the evaluation results obtained by the evaluation unit 102d) to the output device 114.
- the transmission unit 102f transmits the evaluation results to the client device 200 that transmitted the non-blood data of the individual, and transmits the formula and evaluation results created by the evaluation device 100 to the database device 400.
- FIG. 12 is a block diagram showing an example of the configuration of the client device 200 of this system, and conceptually shows only the parts of the configuration that are relevant to the present invention.
- the client device 200 is composed of a control unit 210, a ROM 220, a HD 230, a RAM 240, an input device 250, an output device 260, an input/output IF 270, and a communication IF 280, and each of these units is connected to enable communication via any communication path.
- the client device 200 may be based on an information processing device (for example, a known information processing terminal such as a personal computer, a workstation, a home game device, an Internet TV, a PHS terminal, a portable terminal, a mobile communication terminal, a PDA, etc.) to which peripheral devices such as a printer, a monitor, an image scanner, etc. are connected as necessary.
- an information processing device for example, a known information processing terminal such as a personal computer, a workstation, a home game device, an Internet TV, a PHS terminal, a portable terminal, a mobile communication terminal, a PDA, etc.
- the input device 250 is a keyboard, mouse, microphone, etc.
- the monitor 261 which will be described later, also works with the mouse to realize a pointing device function.
- the output device 260 is an output means that outputs information received via the communication IF 280, and includes a monitor (including a home television) 261 and a printer 262. In addition, the output device 260 may be provided with a speaker, etc.
- the input/output IF 270 is connected to the input device 250 and the output device 260.
- the communication IF 280 connects the client device 200 to the network 300 (or a communication device such as a router) so that they can communicate with each other.
- the client device 200 is connected to the network 300 via a communication device such as a modem, TA, or router and a telephone line, or via a dedicated line. This allows the client device 200 to access the evaluation device 100 in accordance with a specified communication protocol.
- the control unit 210 includes a receiving unit 211 and a transmitting unit 212.
- the receiving unit 211 receives various information, such as the evaluation results, transmitted from the evaluation device 100 via the communication IF 280.
- the transmitting unit 212 transmits various information, such as the non-blood data of the individual, to the evaluation device 100 via the communication IF 280.
- the control unit 210 may realize all or any part of the processing performed by the control unit with a CPU and a program that is interpreted and executed by the CPU.
- the ROM 220 or HD 230 records a computer program that works in cooperation with an OS (operating system) to give instructions to the CPU and perform various processes.
- the computer program is executed by being loaded into the RAM 240, and works in cooperation with the CPU to constitute the control unit 210.
- the computer program may also be recorded in an application program server connected to the client device 200 via any network, and the client device 200 may download all or any part of it as necessary.
- the processing performed by the control unit 210 may also be realized in whole or any part by hardware such as wired logic.
- control unit 210 may include an evaluation unit 210a (including a calculation unit 210a1, a conversion unit 210a2, a generation unit 210a3, and a classification unit 210a4) having functions similar to those of the evaluation unit 102d included in the evaluation device 100.
- evaluation unit 210a including a calculation unit 210a1, a conversion unit 210a2, a generation unit 210a3, and a classification unit 210a4 having functions similar to those of the evaluation unit 102d included in the evaluation device 100.
- the evaluation unit 210a may convert the value of the formula (which may be the first value) in the conversion unit 210a2, generate position information corresponding to the value of the formula or the converted value (which may be the first value or the converted value) in the generation unit 210a3, and classify the individual into one of a plurality of categories using the value of the formula or the converted value (which may be the first value or the converted value) in the classification unit 210a4, depending on information included in the evaluation result transmitted from the evaluation device 100.
- the network 300 has a function of connecting the evaluation device 100, the client device 200, and the database device 400 so that they can communicate with each other, and is, for example, the Internet, an intranet, or a LAN (including both wired and wireless).
- the network 300 may also be a VAN, a personal computer communication network, a public telephone network (including both analog and digital), a leased line network (including both analog and digital), a CATV network, a mobile circuit switching network or a mobile packet switching network (including the IMT2000 system, the GSM (registered trademark) system, or the PDC/PDC-P system, etc.), a radio paging network, a local wireless network such as Bluetooth (registered trademark), a PHS network, or a satellite communication network (including CS, BS, or ISDB, etc.).
- FIG. 13 is a block diagram showing an example of the configuration of the database device 400 of this system, and conceptually shows only the parts of the configuration that are related to the present invention.
- the database device 400 has a function of storing BHBA state information used when creating expressions in the evaluation device 100 or the database device itself, expressions created in the evaluation device 100, evaluation results in the evaluation device 100, etc.
- the database device 400 is composed of a control unit 402 such as a CPU that controls the database device in an overall manner, a communication interface unit 404 that communicatively connects the database device to the network 300 via a communication device such as a router and a wired or wireless communication circuit such as a dedicated line, a memory unit 406 that stores various databases, tables, files, etc., and an input/output interface unit 408 that connects to an input device 412 and an output device 414, and each of these units is communicatively connected via any communication path.
- a control unit 402 such as a CPU that controls the database device in an overall manner
- a communication interface unit 404 that communicatively connects the database device to the network 300 via a communication device such as a router and a wired or wireless communication circuit such as
- the memory unit 406 is a storage means, and may be, for example, a memory device such as a RAM or ROM, a fixed disk device such as a hard disk, a flexible disk, an optical disk, or the like.
- the memory unit 406 stores various programs used for various processes.
- the communication interface unit 404 mediates communication between the database device 400 and the network 300 (or a communication device such as a router). In other words, the communication interface unit 404 has a function of communicating data with other terminals via a communication line.
- the input/output interface unit 408 is connected to an input device 412 and an output device 414.
- the output device 414 may be a monitor (including a home television), a speaker, or a printer.
- the input device 412 may be a keyboard, a mouse, a microphone, or a monitor that works with a mouse to realize a pointing device function.
- the control unit 402 has an internal memory for storing control programs such as an OS (Operating System), programs that define various processing procedures, and required data, and executes various information processing based on these programs. As shown in the figure, the control unit 402 is roughly divided into a transmission unit 402a and a reception unit 402b.
- the transmission unit 402a transmits various information such as BHBA state information and equations to the evaluation device 100.
- the reception unit 402b receives various information such as equations and evaluation results transmitted from the evaluation device 100.
- the evaluation device 100 performs the operations from obtaining non-blood data, calculating the value of the formula, classifying the individual into categories, and transmitting the evaluation results, and the client device 200 receives the evaluation results.
- the client device 200 is equipped with the evaluation unit 210a, it is sufficient for the evaluation device 100 to calculate the value of the formula.
- the conversion of the value of the formula, the generation of position information, and the classification of the individual into categories may be appropriately shared between the evaluation device 100 and the client device 200.
- the evaluation unit 210a may convert the value of the equation in the conversion unit 210a2, generate location information corresponding to the value of the equation or the converted value in the generation unit 210a3, and classify the individual into one of a plurality of categories using the value of the equation or the converted value in the classification unit 210a4.
- the evaluation unit 210a may generate position information corresponding to the converted value in the generation unit 210a3, or classify the individual into one of a plurality of categories using the converted value in the classification unit 210a4.
- the evaluation unit 210a may classify the individual into one of a plurality of categories using the value of the formula or the converted value in the classification unit 210a4.
- this section [2-2] has explained the configuration of the second embodiment when performing primary screening, but by replacing "non-blood data" in this section [2-2] with “blood data” and “first value” in this section [2-2] with “second value,” it can also be used in the configuration of the second embodiment when performing secondary screening.
- evaluation device evaluation method, evaluation program, evaluation system, and information and communication terminal device of the present invention may be embodied in various different embodiments within the scope of the technical idea described in the claims, in addition to the second embodiment described above.
- all or part of the processes described as being performed automatically can be performed manually, or all or part of the processes described as being performed manually can be performed automatically using a known method.
- processing procedures, control procedures, specific names, registered data for each process, information including search conditions and other parameters, screen examples, and database configurations shown in the above documents and drawings may be changed as desired unless otherwise specified.
- each component shown in the figure is a functional concept, and does not necessarily have to be physically configured as shown in the figure.
- the processing functions of the evaluation device 100 may be realized in whole or in part by a CPU (Central Processing Unit) and a program interpreted and executed by the CPU, or may be realized as hardware using wired logic.
- the program is recorded on a non-transient computer-readable recording medium that contains programmed instructions for causing the information processing device to execute the evaluation method of the present invention, and is mechanically read by the evaluation device 100 as necessary. That is, a computer program is recorded in the storage unit 106, such as a ROM or HDD, for working with an OS (Operating System) to give instructions to the CPU and perform various processes. This computer program is executed by being loaded into RAM, and works with the CPU to form the control unit.
- OS Operating System
- this computer program may be stored in an application program server connected to the evaluation device 100 via any network, and it is also possible to download all or part of it as needed.
- the evaluation program of the present invention may be stored in a non-transitory computer-readable recording medium, and may also be configured as a program product.
- the term "recording medium” includes any "portable physical medium” such as a memory card, USB memory, SD card, flexible disk, magneto-optical disk, ROM, EPROM, EEPROM (registered trademark), CD-ROM, MO, DVD, and Blu-ray (registered trademark) Disc.
- a "program” is a data processing method written in any language or description method, and may be in any format, such as source code or binary code.
- a "program” is not necessarily limited to a single configuration, but also includes a distributed configuration consisting of multiple modules or libraries, and a program that achieves its function by working together with a separate program, such as an OS (Operating System).
- OS Operating System
- well-known configurations and procedures can be used for the specific configurations and reading procedures for reading a recording medium in each device shown in the embodiments, as well as installation procedures after reading.
- the various databases stored in the memory unit 106 are storage devices such as memory devices such as RAM and ROM, fixed disk devices such as hard disks, flexible disks, and optical disks, and store various programs, tables, databases, and web page files used for various processes and website provision.
- storage devices such as memory devices such as RAM and ROM, fixed disk devices such as hard disks, flexible disks, and optical disks, and store various programs, tables, databases, and web page files used for various processes and website provision.
- the evaluation device 100 may be configured as an information processing device such as a known personal computer or workstation, or may be configured as the information processing device to which any peripheral device is connected.
- the evaluation device 100 may also be realized by implementing software (including programs or data, etc.) that causes the information processing device to realize the evaluation method of the present invention.
- Example 1 it was confirmed that the state of postpartum metabolic diseases can be evaluated using non-blood data and a logistic regression equation.
- Horse management data was collected for a total of 399 female Holstein dairy cows (mature cows) at a general dairy farm.
- the herd management data included the following items as explanatory variables.
- the explanatory variables consist of variables calculated for each cow's parity and daily data recorded during the lactation period after calving.
- the daily data includes behavioral data of the cow, such as feeding behavior and rumination time, during the day.
- the behavioral data can be obtained from sensors. Milk yield, feeding time, and rumination time
- the average value and standard deviation (variance) were calculated for each lactation period for each of the three variables of the daily data.
- the calculated average value and standard deviation (variance) were then used as explanatory variables.
- the lactation periods are the four periods: fresh (1-20 days after previous calving), pre-lactation (21-80 days after previous calving), peak lactation (81-180 days after previous calving), and late lactation (181 days after previous calving to 60 days before current calving).
- the objective variable is whether or not ketosis will occur after this delivery (1) or not (0).
- the accuracy of the generated logistic regression equation was verified using cross-validation, which divides the data into five parts.
- the logistic regression parameters (regression coefficients) for each divided data set are shown in Table 2.
- the area under the ROC curve (ROC AUC) was used as an index of accuracy.
- the obtained ROC and AUC scores are shown in Figure 15.
- the ROC_AUC was a high value of 0.665 to 0.748. This demonstrates that the state of postpartum metabolic diseases can be evaluated using non-blood data with a logistic regression equation.
- Example 2 it was confirmed that the state of postpartum metabolic diseases can be evaluated using a logistic regression equation using non-blood data (behavioral data) excluding milk volume.
- verification was performed in the same manner as in Example 1, but milk volume was not used as an explanatory variable.
- the accuracy of the generated logistic regression formula was verified by a cross-validation method in which the data was divided into five parts.
- the parameters (regression coefficients) of the logistic regression for each divided data set are shown in Table 4.
- the area under the ROC curve was used as an index of accuracy.
- the obtained ROC and AUC scores are shown in FIG.
- the ROC_AUC was a high value of 0.554 to 0.687. This demonstrated that the state of postpartum metabolic diseases can be evaluated by logistic regression using non-blood data (behavioral data) without milk volume.
- Example 3 it was confirmed that the state of postpartum metabolic diseases can be evaluated using a decision tree using non-blood data.
- the same cows, explanatory variables, and objective variables as in Example 1 were used unless otherwise specified.
- Example 3 it was confirmed that the generated decision tree could be used to evaluate the state of postpartum metabolic diseases in three cases: (1) when milk yield data was used as an explanatory variable, (2) when milk yield data and behavioral data (rumination time) were used as explanatory variables, and (3) when milk yield data and feeding time were used as explanatory variables.
- explanatory variables used were parity, mean fresh milk yield, mean early lactation milk yield, mean peak lactation milk yield, mean late lactation milk yield, standard deviation of fresh milk yield, standard deviation of early lactation milk yield, standard deviation of peak lactation milk yield and standard deviation of late lactation milk yield.
- the accuracy of the generated decision trees was verified using cross-validation, which divides the data into five parts.
- the five generated decision trees are shown in Figures 17 to 21.
- the area under the ROC curve was used as an index of accuracy.
- the obtained ROC and AUC scores are shown in Figure 22.
- the ROC_AUC was a high value ranging from 0.511 to 0.659. This shows that it is possible to use milk yield data and a decision tree to evaluate the state of metabolic diseases after parturition.
- the accuracy of the generated decision trees was verified using cross-validation, which divides the data into five parts.
- the five generated decision trees are shown in Figures 23 to 27.
- the area under the ROC curve was used as an index of accuracy.
- the obtained ROC and AUC scores are shown in Figure 28.
- the ROC_AUC was a high value of 0.503 to 0.651. This shows that it is possible to evaluate the state of metabolic diseases after parturition using a decision tree, using behavioral data (rumination time) in addition to milk yield data.
- the accuracy of the generated decision trees was verified using cross-validation, which divides the data into five parts.
- the five generated decision trees are shown in Figures 29 to 33.
- the area under the ROC curve was used as an index of accuracy.
- the obtained ROC and AUC scores are shown in Figure 34.
- the ROC_AUC was a high value ranging from 0.535 to 0.703. This shows that the state of metabolic diseases after parturition can be evaluated using a decision tree, using feeding time in addition to milk yield data.
- Example 4 it was confirmed that the state of postpartum metabolic diseases can be evaluated using non-blood data and a logistic regression equation.
- Horde management data was collected from a total of 4,460 female Holstein dairy cows (multiparous cows) at three general dairy farms.
- the herd management data included daily milk yield, parity, number of days between calvings, and records of postpartum ketosis as explanatory variables before calving.
- the estimated model was applied to validation data consisting of a healthy group (875 cattle) and a ketosis group (17 cattle), and the discrimination performance for the validation data was evaluated using the area under the ROC curve.
- the ROC_AUC was a high value of 0.716. This demonstrated that the state of metabolic diseases after parturition can be evaluated using non-blood data with a logistic regression equation.
- Example 5 it was confirmed that the state of postpartum metabolic diseases can be evaluated using non-blood data and a convolutional neural network (CNN).
- CNN convolutional neural network
- Example 5 the same herd management data for 4,460 female Holstein dairy cows as in Example 4 was used.
- the number of days since calving from the previous calving was plotted on the X-axis and the daily milk yield on the Y-axis, and the ranges for the X-axis and Y-axis were set.
- This plot was saved as image data (png format), and then the image data was converted into three-dimensional tensor data using an image analysis program.
- the 4,460 cows were randomly divided into 3,032 for training data, 536 for validation data, and 892 for verification data. Then, using the tensor data obtained from the plots corresponding to each of the 3,032 training data and 536 validation data, a discrimination model for discriminating between the healthy and ketosis groups was constructed using a convolutional neural network (CNN). Note that the variables used in the discrimination model are not limited to milk yield, and can be any information obtained daily (such as body weight), and the range of days since calving can also be any range.
- CNN convolutional neural network
- the constructed discrimination model obtained a prediction score for each individual being in ketosis.
- the ROC_AUC was a high value of 0.810. This demonstrated that the state of postpartum metabolic diseases can be evaluated using non-blood data with a convolutional neural network (CNN).
- CNN convolutional neural network
- Example 6 it was confirmed that the state of postpartum metabolic diseases can be evaluated using non-blood data with a convolutional neural network (CNN) and a logistic regression equation.
- CNN convolutional neural network
- the calving number and calving interval days obtained in Example 4 from the herd management data of 892 female Holstein dairy cows used as validation data in Examples 4 and 5, and the prediction score obtained in Example 5 were applied to the estimated model, and the discrimination performance in the validation data was evaluated using the area under the ROC curve.
- the ROC_AUC was a high value of 0.811. This demonstrated that the state of postpartum metabolic diseases can be evaluated using non-blood data with a convolutional neural network (CNN) and a logistic regression equation.
- CNN convolutional neural network
- Herd management data was collected from a total of 4,815 female Holstein dairy cows (multiparous cows) at general dairy farms (total of seven).
- the herd management data included daily milk yield, parity, number of days between calvings, and records of postpartum ketosis as explanatory variables before calving.
- the number of days since calving from the previous calving was plotted on the X-axis and daily milk yield on the Y-axis, and the range of the X-axis and Y-axis was set for all data. This plot was saved as an image file (png format), and the image data was then converted into three-dimensional tensor data using an image analysis program.
- a classification model for distinguishing between healthy and ketosis groups was constructed using a convolutional neural network (CNN) using the tensor data obtained from plots corresponding to each individual of the 3,721 cows from one farm used for learning data out of the 4,815 cows.
- CNN convolutional neural network
- the variables used in the classification model are not limited to milk yield, and can be any information obtained daily (such as body weight), and the range of days since calving can also be any range.
- Three-dimensional tensor data based on a plot of the number of days since calving in the previous calving on the X-axis and daily milk yield on the Y-axis for each of the 1,094 individuals from six farms was used as validation data, and a prediction score was obtained for each individual that they were in ketosis using the constructed discrimination model.
- CNN's ROC_AUC was 0.557
- Inception's ROC_AUC was 0.62.
- a model for discriminating between healthy and ketosis groups was estimated by logistic regression using the ketosis prediction scores of the 3,721 individuals used for the training data obtained in Verification 1 above, as well as the calving date and number of days since calving contained in the herd management data as explanatory variables.
- ROC_AUC calving number and calving interval days contained in the herd management data of 1,094 female Holstein dairy cows, as well as the ketosis prediction score obtained in the above verification 1, were applied to the logistic regression model estimated above as verification data, and the discrimination performance of the model was evaluated using ROC_AUC.
- CNN's ROC_AUC was 0.654
- Inception's ROC_AUC was 0.688.
- ROC_AUC The scores calculated from the four models were used to predict the level of haptoglobin after parturition (standard 800 ⁇ g/mL), and the prediction accuracy was evaluated using ROC_AUC.
- the four models created for seven types of diseases were used to predict the onset of each disease after parturition, and the prediction accuracy was evaluated using ROC_AUC.
- the results of ROC_AUC are shown in Figure 36.
- ROC_AUC was 0.55 or higher for two models, and therefore these two models are considered to be useful for predicting the level of haploglobin.
- at least one model had an ROC_AUC of 0.55 or higher, so models with an ROC_AUC of 0.55 or higher are considered to be useful for predicting the onset of each disease after delivery.
- a prediction equation was created by selecting variables from 40 explanatory variables using the same dataset as in Example 8, excluding 16 items of data related to milk volume.
- Example 8 the data from the 442 cases used in Example 8 was divided into training data and validation data so that the proportion of individuals with ketosis was equal.
- the sample size ratio of training data to validation data was set to 3:1 (i.e., training data was 331 cases, validation data was 111 cases), and the following ketosis prediction model was constructed.
- logistic regression (Lasso regression) with L1 regularization was performed using the training data to narrow down the explanatory variables.
- the training data was randomly divided into four parts for cross-validation to estimate the optimal condition for the coefficient of the regularization term to minimize the mean squared error of prediction. Under this condition, the 11 types of explanatory variables shown in Figure 43 were selected.
- the logistic regression model using the obtained 11 explanatory variable candidates was used as the full model, and the logistic regression model with the smallest AIC was estimated using stepwise variable selection. As a result, nine explanatory variables were selected. The selected explanatory variables are shown in Figure 44.
- a prediction equation was created by selecting variables from 40 explanatory variables using the same dataset as in Example 8, excluding 16 items of data related to milk volume.
- Example 8 the data from the 442 cases used in Example 8 was divided into training data and validation data so that the proportion of individuals with ketosis was equal.
- the sample size ratio of training data to validation data was set to 3:1 (i.e., training data was 331 cases, validation data was 111 cases), and the following ketosis prediction model was constructed.
- the explanatory variables were narrowed down by performing "logistic regression with L1 regularization (Lasso regression)" using the training data.
- logistic regression with L1 regularization 100 operations were performed to extract 100 patterns of explanatory variables by "estimating the optimal condition for minimizing the mean squared error of the prediction with the coefficient of the regularization term by cross-validation in which the training data was randomly divided into four parts, thereby narrowing down the explanatory variables" (cross-validation resampling). From the 100 resampling results obtained, "explanatory variables that were selected at least once" were extracted. As a result, the 13 types of explanatory variables shown in Figure 45 were extracted.
- the model with the combination of variables shown in Figure 46 was selected; for the 3-variable model, the model with the combination of variables shown in Figures 47A, 47B, and 47C was selected; for the 4-variable model, the model with the combination of variables shown in Figures 48A, 48B, 48C, and 48D was selected; for the 5-variable model, the model with the combination of variables shown in Figures 49A, 49B, 49C, and 49D was selected; and for the 6-variable model, the model with the combination of variables shown in Figures 50A, 50B, 50C, and 50D was selected.
- the present invention is extremely useful and can be widely implemented in many industrial fields, particularly in dairy farming, the development of pharmaceuticals or feed for cattle, and veterinary medicine for cattle.
- Evaluation device Control unit 102a Acquisition unit 102b Designation unit 102c Formula creation unit 102d Evaluation unit 102d1 Calculation unit 102d2 Conversion unit 102d3 Generation unit 102d4 Classification unit 102e Result output unit 102f Transmission unit 104 Communication interface unit 106 Storage unit 106a Non-blood data file 106b BHBA state information file 106c Designated BHBA state information file 106d Formula-related information database 106d1 Formula file 106e Evaluation result file 108 Input/output interface unit 112 Input device 114 Output device 200 Client device (Terminal device (information communication terminal device)) 300 Network 400 Database device
Landscapes
- Life Sciences & Earth Sciences (AREA)
- Environmental Sciences (AREA)
- Animal Husbandry (AREA)
- Biodiversity & Conservation Biology (AREA)
- Biophysics (AREA)
- Investigating Or Analysing Biological Materials (AREA)
Abstract
Description
ここでは、第1実施形態の概要について図1を参照して説明する。図1は第1実施形態の基本原理を示す原理構成図である。
最初に、牛の血液を用いずに行うスクリーニングである一次スクリーニングを以下のようにして行う。
・経産か未経産かを意味する産次項(2値変数)
・体重、摂食量、ボディコンディションスコア(BCS)、気温、湿度、飼育密度、及び季節
前記第一の値または前記式の値の取り得る範囲が所定範囲(例えば0.0から1.0までの範囲、0.0から10.0までの範囲、0.0から100.0までの範囲、又は-10.0から10.0までの範囲、など)に収まるようにする等のために、例えば、前記第一の値または前記式の値に対して任意の値を加減乗除したり、前記第一の値または前記式の値を所定の変換手法(例えば、指数変換、対数変換、角変換、平方根変換、プロビット変換、逆数変換、Box-Cox変換、又はべき乗変換など)で変換したり、また、前記第一の値または前記式の値に対してこれらの計算を組み合わせて行ったりすることで、前記第一の値または前記式の値を変換してもよい。例えば、前記第一の値または前記式の値を指数としネイピア数を底とする指数関数の値(具体的には、分娩後の代謝性疾患の状態が所定の状態(例えば血中BHBA濃度が基準値を超えた状態など)である確率pを定義したときの自然対数ln(p/(1-p))が前記第一の値または前記式の値と等しいとした場合におけるp/(1-p)の値)をさらに算出してもよく、また、算出した指数関数の値を1と当該値との和で割った値(具体的には、確率pの値)をさらに算出してもよい。
また、特定の条件のときの変換後の値が特定の値となるように、前記第一の値または前記式の値を変換してもよい。例えば、感度が95%のときの変換後の値が5.0となり且つ感度が80%のときの変換後の値が8.0となるように前記第一の値または前記式の値を変換してもよい。
また、前記第一の値を正規分布化した後、平均50、標準偏差10となるように前記第一の値を偏差値化してもよい。また、前記式の値に関しては、平均50、標準偏差10となるように前記式の値を偏差値化してもよい。
例えば、前記第一の値と予め設定された1つ又は複数の閾値を用いて、又は、前記第一の値と前記第一の値が代入される変数を含む式と予め設定された1つ又は複数の閾値とを用いて、評価対象を、分娩後に代謝性疾患となるリスクの程度を少なくとも考慮して定義された複数の区分のうちのどれか1つに分類してもよい。なお、複数の区分には、分娩後に代謝性疾患となるリスクが高い対象(例えば、分娩後の血中BHBA濃度が基準値(例えば1200μmol/dlなど)以上となる対象)を属させるための区分、および、分娩後に代謝性疾患となるリスクが低い対象(例えば、分娩後の血液BHBA濃度が基準値(例えば1200μmol/dlなど)未満となる対象)を属させるための区分が含まれていてもよい。また、複数の区分には、分娩後に代謝性疾患となるリスクが高い対象を属させるための区分、分娩後に代謝性疾患となるリスクが低い対象を属させるための区分、および分娩後に代謝性疾患となるリスクが中程度の対象を属させるための区分が含まれていてもよい。
また、例えば、前記第一の値と予め設定された1つ又は複数の閾値を用いて、又は、前記第一の値と前記第一の値が代入される変数を含む式と予め設定された1つ又は複数の閾値とを用いて、評価対象の分娩後の血液中のBHBAの濃度値を推定してもよい。
また、前記第一の値または前記式の値を所定の手法で変換し、変換後の値を用いて、評価対象を複数の区分のうちのどれか1つに分類してもよい。
・最小二乗法に基づく重回帰式、線形判別式、主成分分析、正準判別分析などの線形モデル
・最尤法に基づくロジスティック回帰、Cox回帰などの一般化線形モデル
・一般化線形モデルに加えて個体間差、施設間差などの変量効果を考慮した一般化線形混合モデル
・MCMC(マルコフ連鎖モンテカルロ法)、ベイジアンネットワーク、ナイーブベイズ法などベイズ統計に基づき作成された式
・K-means法、階層的クラスター解析などクラスター解析で作成された式
・k近傍法、サポートベクターマシン、決定木などクラス分類により作成された式
・ニューラルネットワークおよび畳み込みニューラルネットワークや再帰的ニューラルネットワークに基づく深層学習で作成された式
・ランダムフォレストや勾配ブースティングなどアンサンブル学習に基づくクラス分類により作成された式
・既存の学習済みモデルに基づく転移学習に基づくクラス分類により作成された式
・分数式など上記のカテゴリに属さない手法により作成された式
・異なる形式の式の和で示されるような式
つぎに、「一次スクリーニングにおいて前記代謝性疾患に罹患するリスクが高いと判断された牛」または「一次スクリーニングにおいて前記代謝性疾患に罹患するリスクが極めて低いと判断された健康な牛を除いた牛」を対象として、牛の血液を用いて行うスクリーニングである二次スクリーニング(血液スクリーニング)を行う。
(A)採取した血液サンプルを遠心することにより血液から血漿を分離する。全ての血漿サンプルは、濃度値の測定時まで-80℃で凍結保存する。濃度値測定時には、0.02N塩酸を添加し限外ろ過で除蛋白処理を行った後、標識試薬(3-アミノピリジル-N-ヒドロキシスクシンイミジルカルバメート)を用いてプレカラム誘導体化を行い、そして、液体クロマトグラフ質量分析計(LC/MS)により濃度値を分析する(国際公開第2003/069328号、国際公開第2005/116629号を参照)。
(B)採取した血液サンプルを遠心することにより血液から血漿を分離する。全ての血漿サンプルは、濃度値の測定時まで-80℃で凍結保存する。濃度値測定時には、0.02N塩酸を添加し限外ろ過で除蛋白処理を行った後、ニンヒドリン試薬を用いたポストカラム誘導体化法を原理としたアミノ酸分析計により濃度値を分析する。
(C)採取した血液サンプルを、膜やMEMS技術または遠心分離の原理を用いて血球分離を行い、血液から血漿または血清を分離する。血漿または血清取得後すぐに濃度値の測定を行わない血漿または血清サンプルは、濃度値の測定時まで-80℃で凍結保存する。濃度値測定時には、酵素やアプタマーなど、標的とするアミノ酸又は生化学と反応または結合する分子等を用い、基質認識によって増減する物質や分光学的値を定量等することにより濃度値を分析する。
さらに、「二次スクリーニングにおいて前記代謝性疾患に罹患するリスクが極めて高いと判断された牛(高リスク群の牛)」および「二次スクリーニングにおいて前記代謝性疾患に罹患するリスクが低いと判断された健康な牛(低リスク群の牛)」を除いた牛(中リスク群の牛)を対象として、非侵襲的な方法により取得可能な畜牛管理情報に関する情報を用いて行うクラスタリングである三次クラスタリングを行う。
つぎに、前記評価ステップにおいて分娩後に前記代謝性疾患に罹患している可能性が高いと評価された牛に対して、予防的処置を提案する(図1のステップS15)。なお、予防的処置の提案は、前記第一の評価(一次スクリーニング)のみを行った後に行ってもよいし、前記第一の評価(一次スクリーニング)および前記第二の評価(二次スクリーニング)を行った後に行ってもよいし、前記第一の評価(一次スクリーニング)、前記第二の評価(二次スクリーニング)および前記第三の評価(三次スクリーニング)を行った後に行ってもよい。
一次スクリーニングに先立って、今回の分娩後の牛の代謝性疾患の状態を今回の分娩前に評価するための式を以下のようにして生成してもよい。
[2-1.第2実施形態の概要]
ここでは、第2実施形態の概要について図2を参照して説明する。図2は第2実施形態の基本原理を示す原理構成図である。なお、本第2実施形態の説明では、上述した第1実施形態と重複する説明を省略する場合がある。特に、ここでは、分娩後の代謝性疾患の状態を評価する際に、式の値又は当該式の値の変換後の値を用いるケースを一例として記載しているが、例えば、前記第一の値又はその変換後の値を用いてもよい。
ここでは、第2実施形態にかかる評価システム(以下では本システムと記す場合がある。)の構成について、図3から図13を参照して説明する。なお、本システムはあくまでも一例であり、本発明はこれに限定されない。特に、ここでは、分娩後の代謝性疾患の状態を評価する際に、式の値又はその変換後の値を用いるケースを一例として記載しているが、例えば、前記第一の値又はその変換後の値を用いてもよい。
例えば、クライアント装置200が評価装置100から式の値を受信した場合には、評価部210aは、変換部210a2で式の値を変換したり、生成部210a3で式の値又は変換後の値に対応する位置情報を生成したり、分類部210a4で式の値又は変換後の値を用いて個体を複数の区分のうちのどれか1つに分類したりしてもよい。
また、クライアント装置200が評価装置100から変換後の値を受信した場合には、評価部210aは、生成部210a3で変換後の値に対応する位置情報を生成したり、分類部210a4で変換後の値を用いて個体を複数の区分のうちのどれか1つに分類したりしてもよい。
また、クライアント装置200が評価装置100から式の値又は変換後の値と位置情報とを受信した場合には、評価部210aは、分類部210a4で式の値又は変換後の値を用いて個体を複数の区分のうちのどれか1つに分類してもよい。
本発明にかかる評価装置、評価方法、評価プログラム、評価システム、および情報通信端末装置は、上述した第2実施形態以外にも、特許請求の範囲に記載した技術的思想の範囲内において種々の異なる実施形態にて実施されてよいものである。
・今回の分娩の産次(今回の分娩の産次数が2以下の場合は今回の分娩の産次を「0」とし、今回の分娩の産次数が3以上の場合は今回の分娩の産次を「1」とした)
・搾乳日数(今回の分娩日60日前までの搾乳日数)
・分娩間隔
・搾乳量
・採食時間
・反芻時間
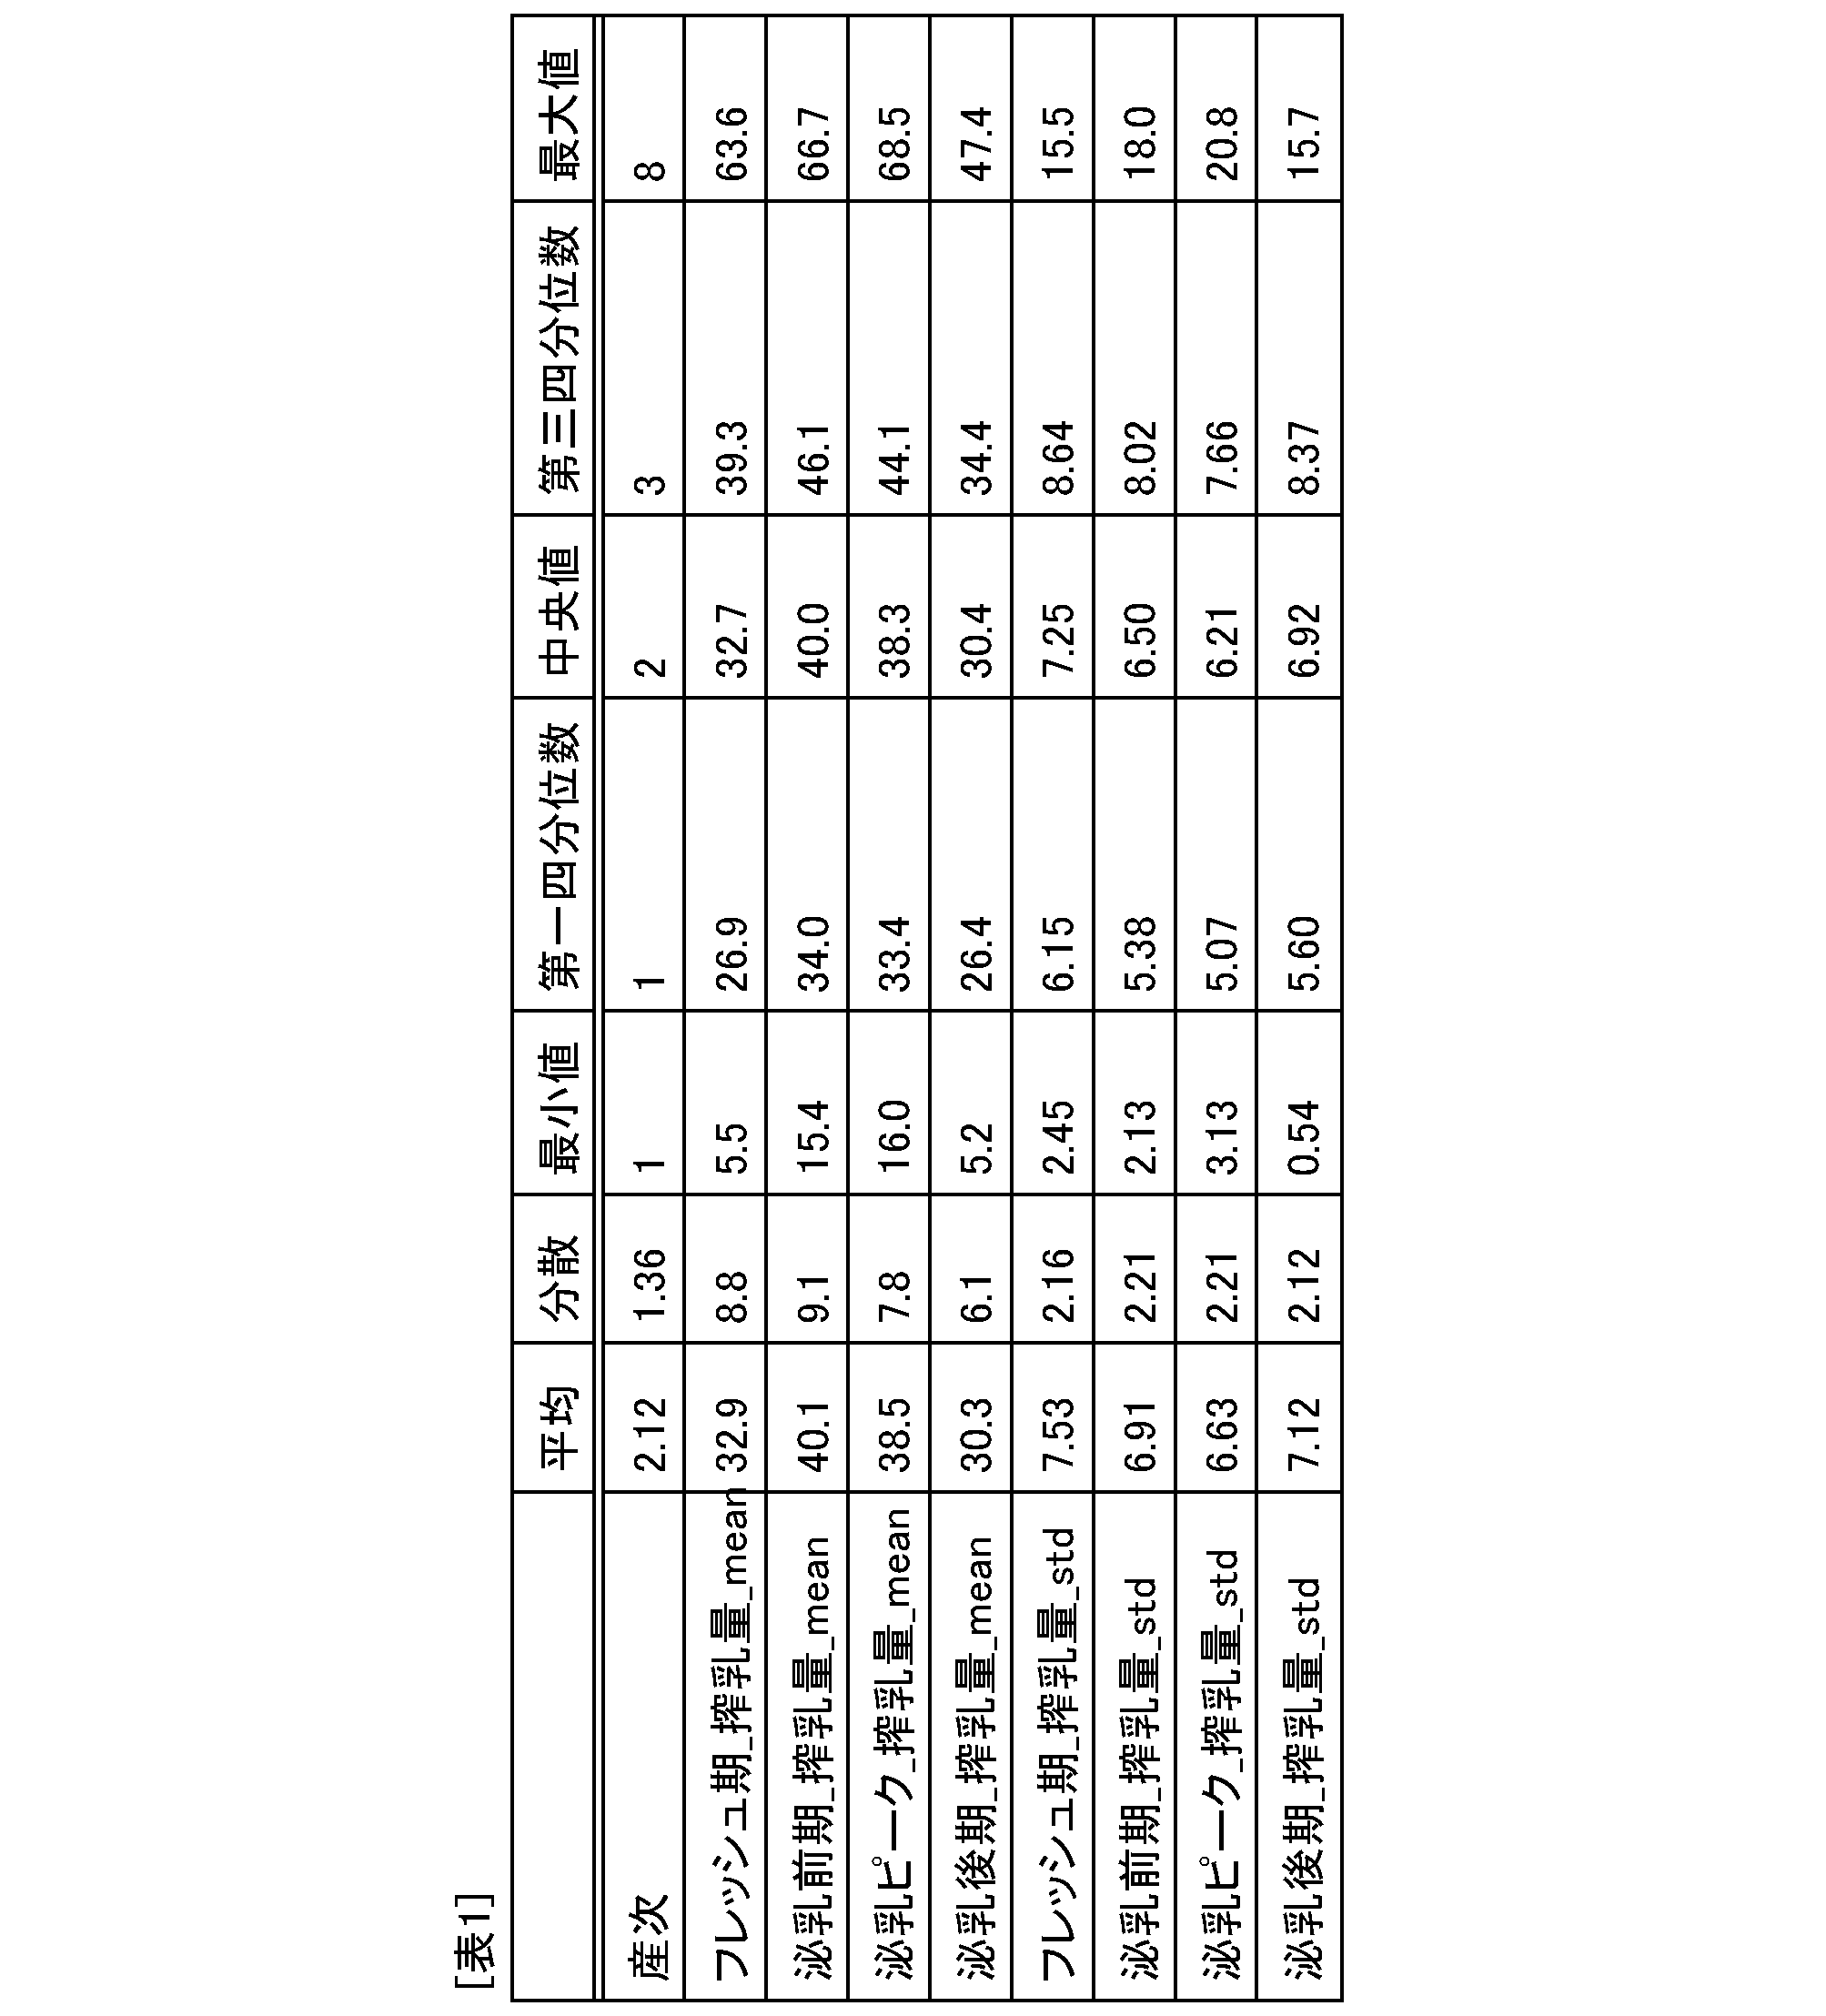
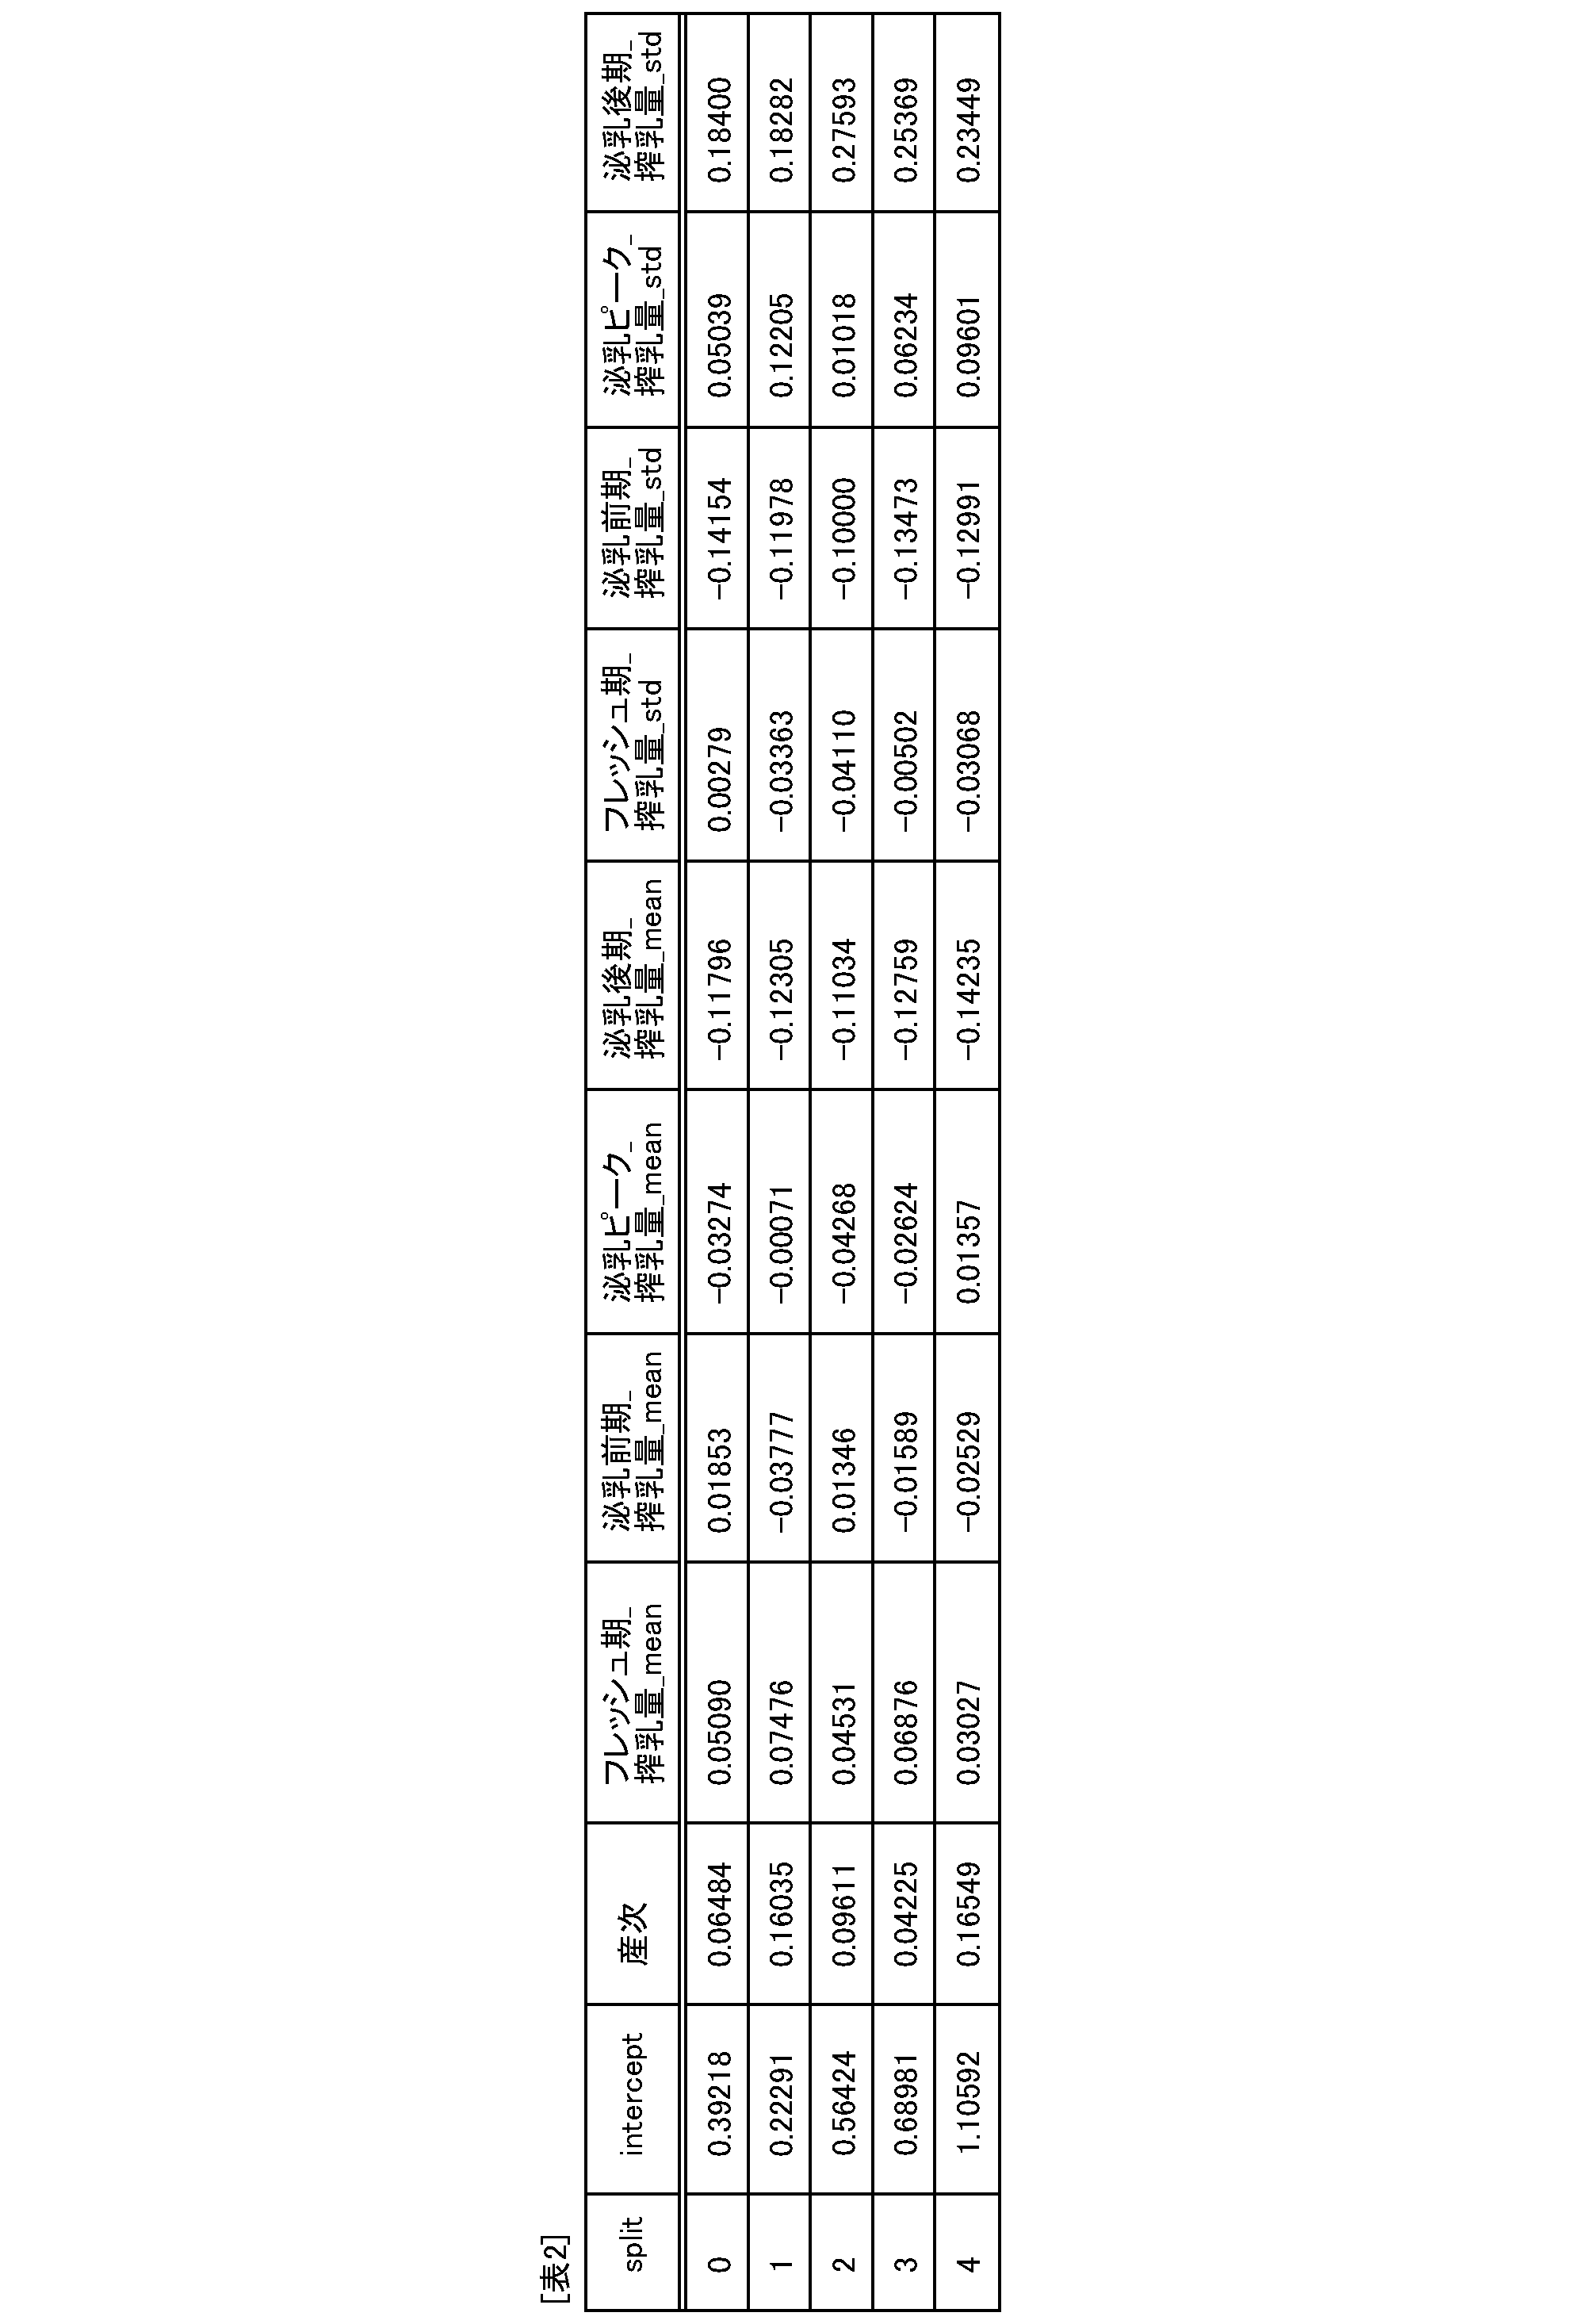
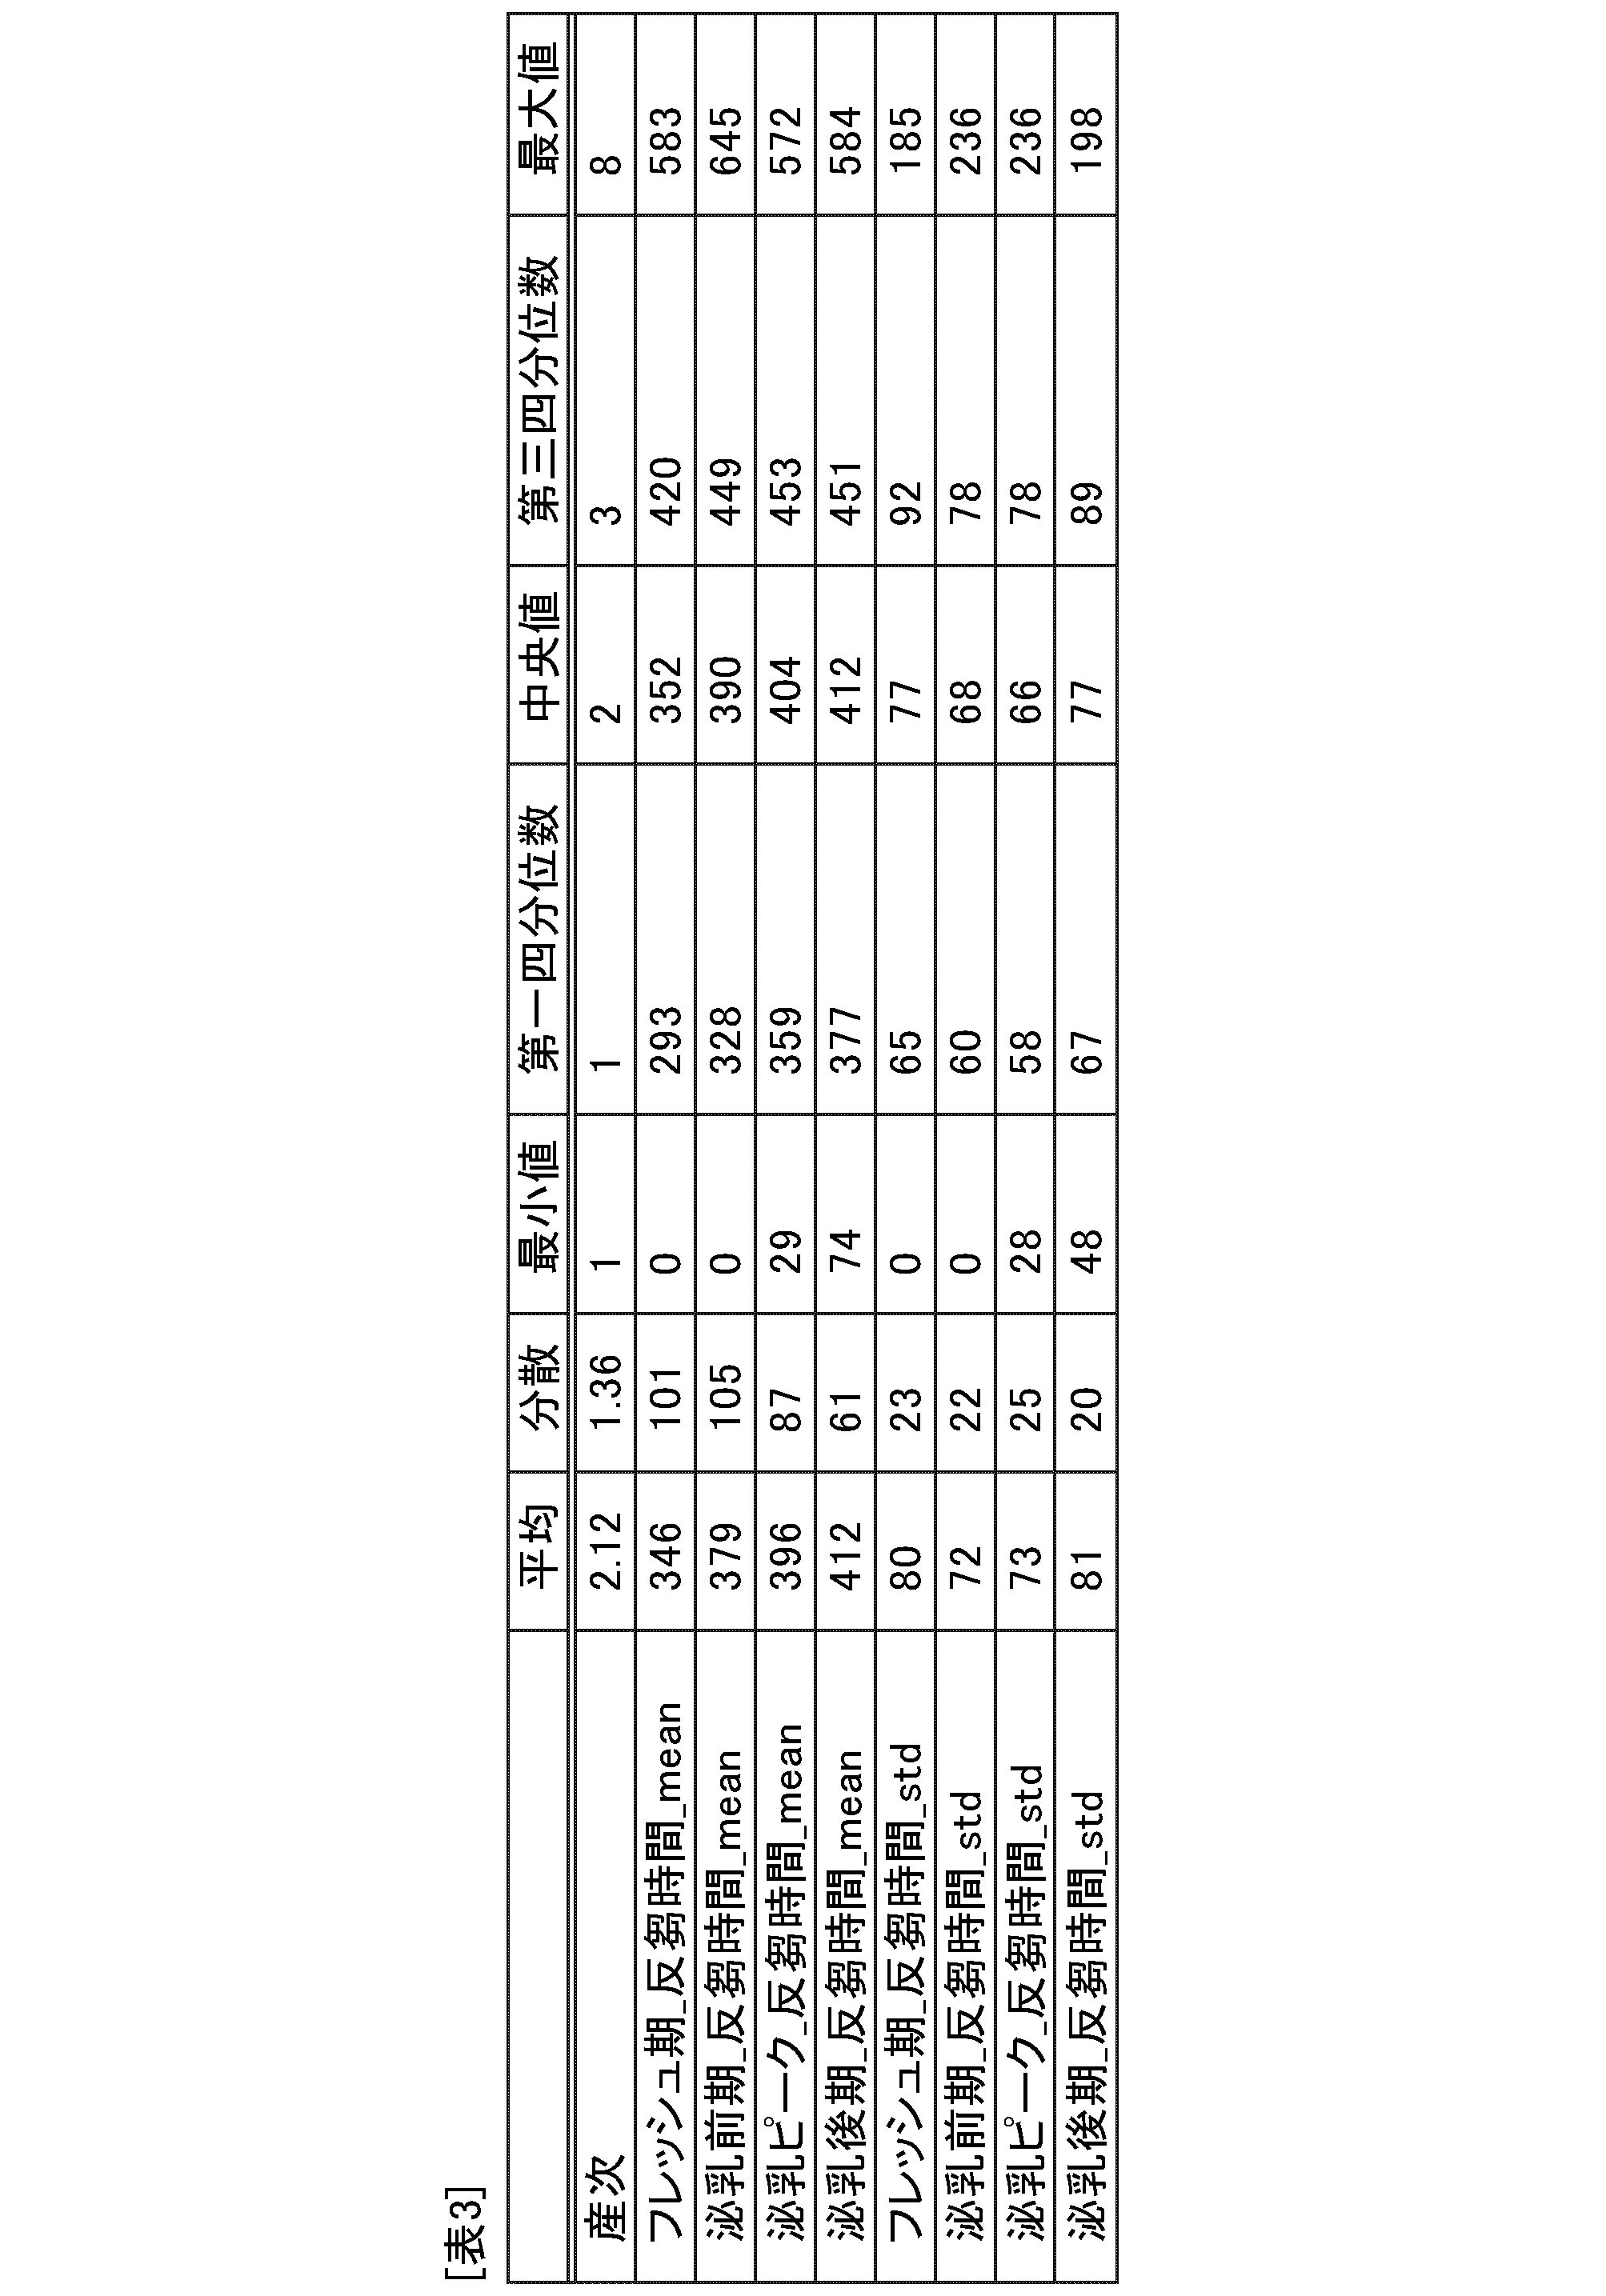
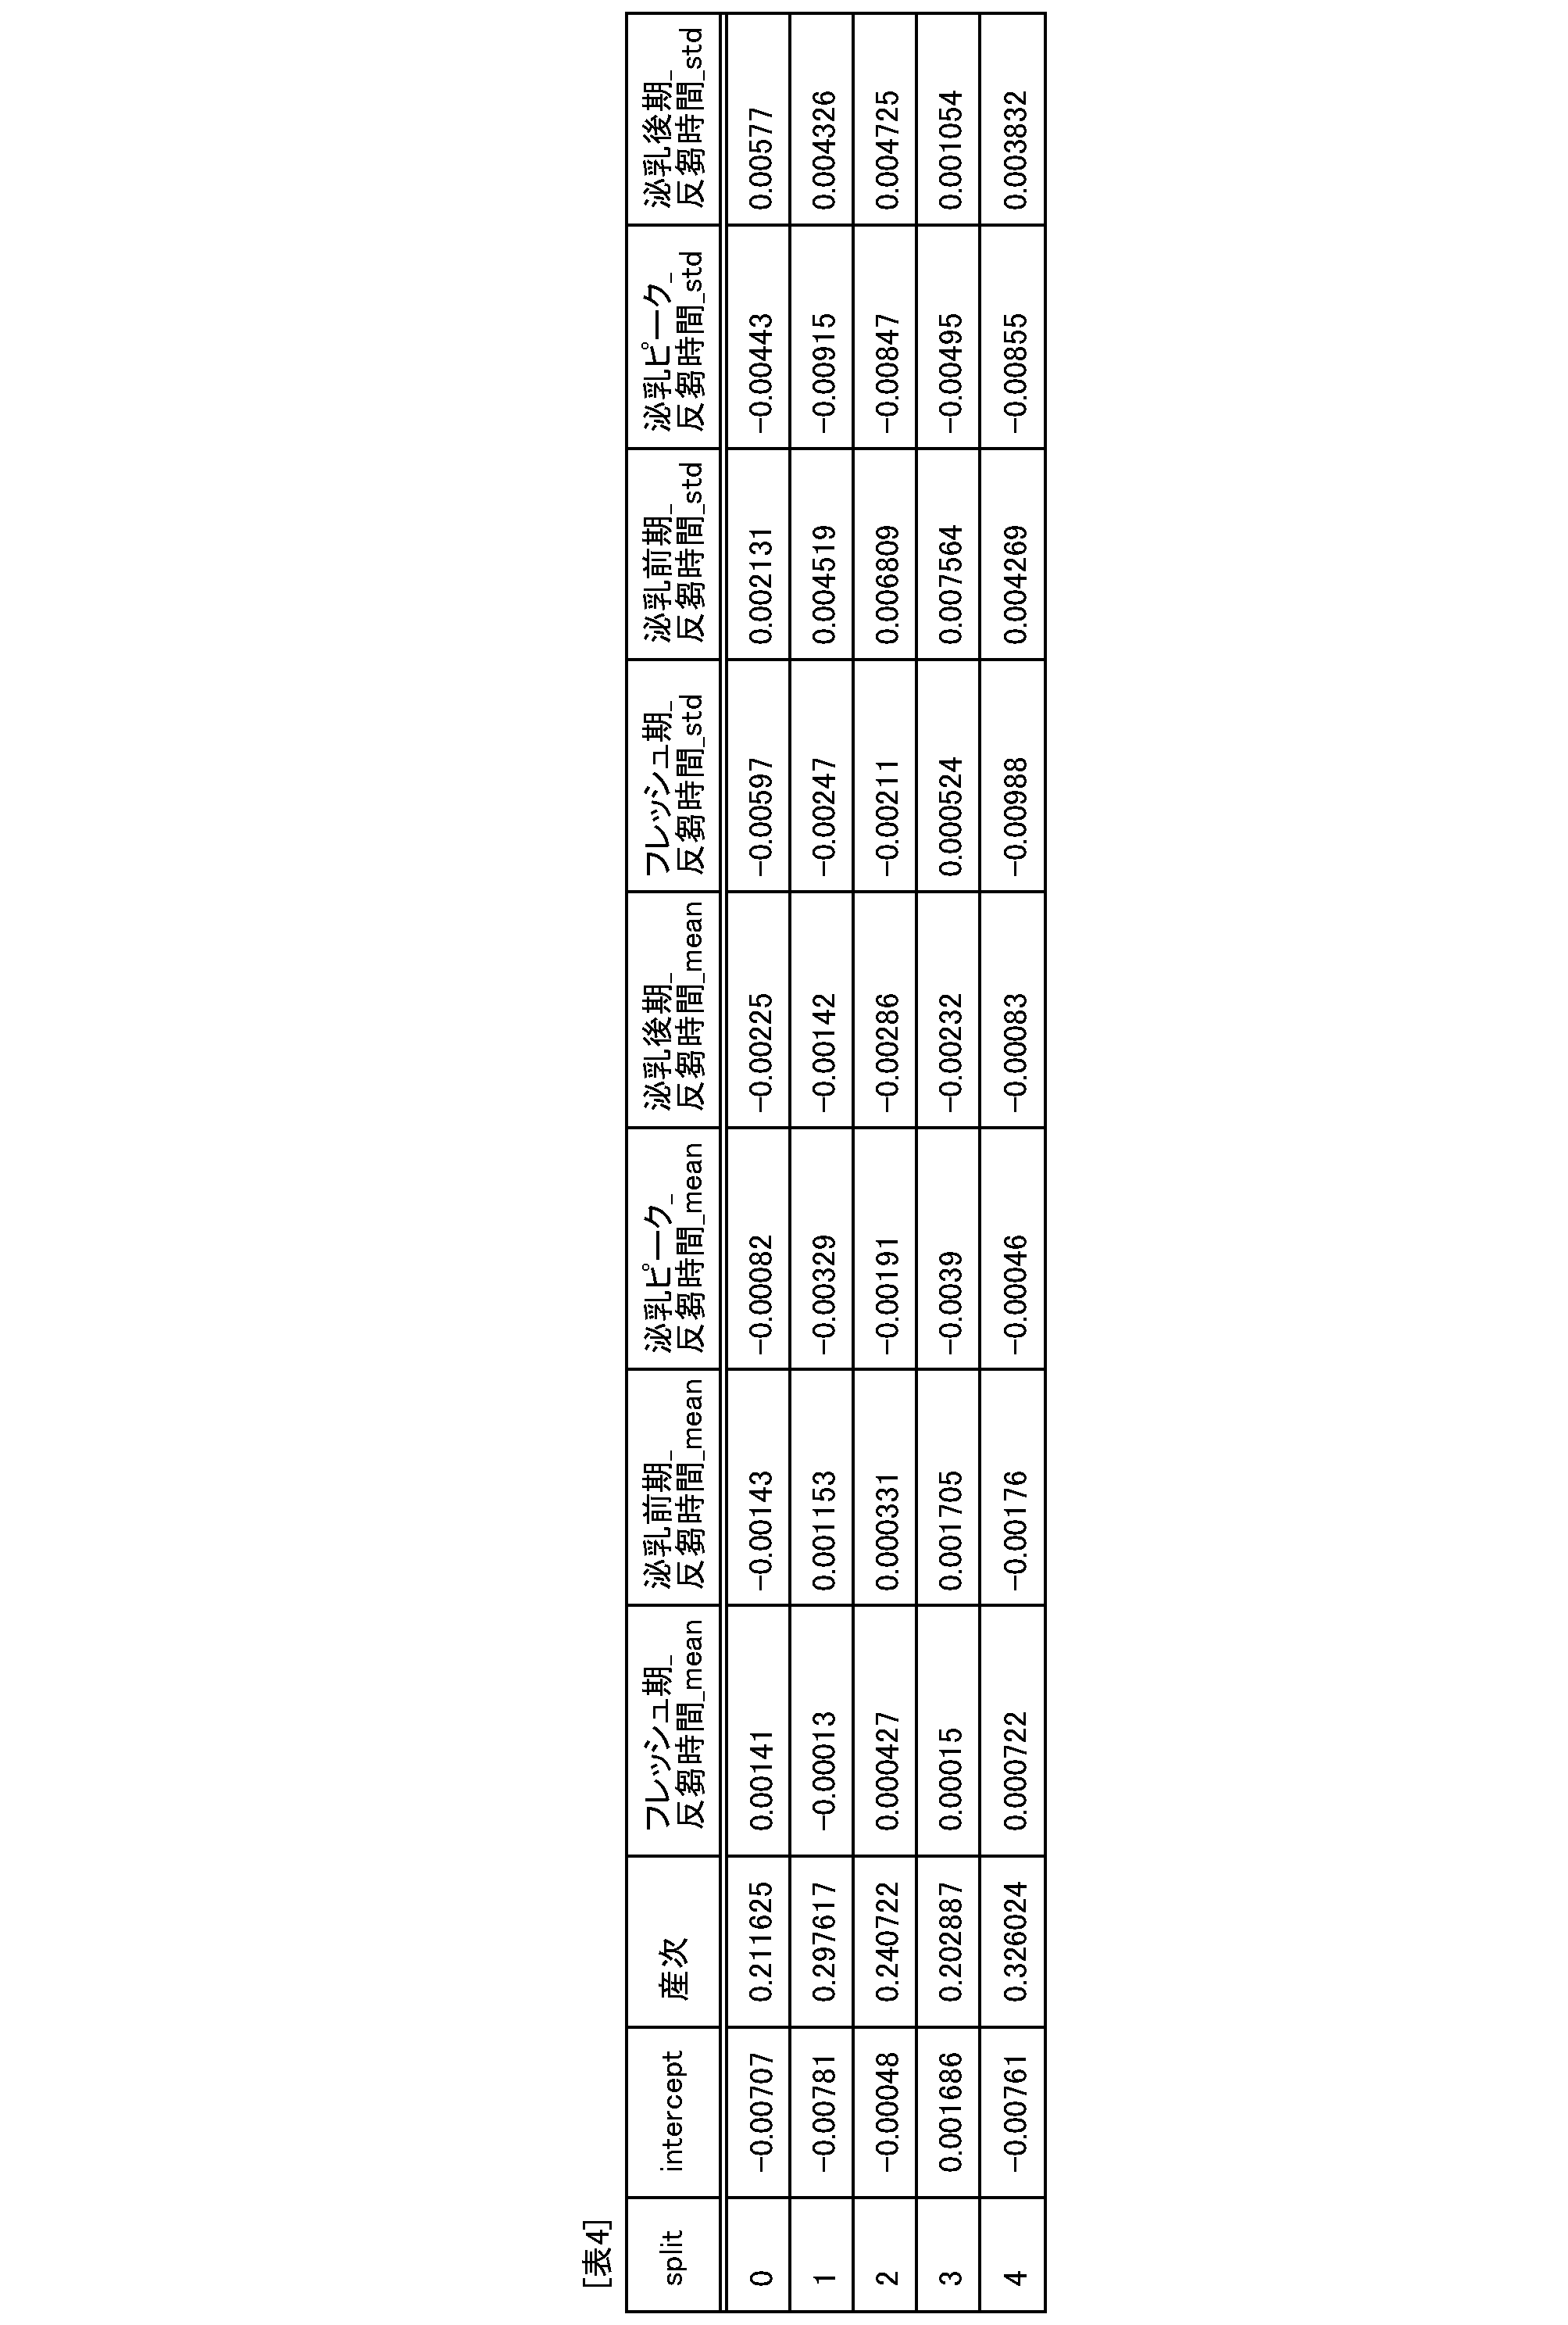
計399頭の牛を、分娩後ケトーシス罹患の有無を基準に、健常群(334頭)とケトーシス群(65頭)の2群に分類した。そして、分娩前牛群管理データを用いて、この2群の判別性能を最大化する決定木を生成した。この際、ノードの最大深さは6、最小頭数15頭を指定した。
乳量データに加えて行動データ(反芻時間)も説明変数として用いた以外は(1)と同様の方法で、決定木を生成した。
乳量データに加えて採食時間も説明変数として用いた以外は(1)と同様の方法で、決定木を生成した。
畳み込みニューラルネットワーク(CNN)を用いたケトーシス予測式及びInception(CNN)を用いたケトーシス予測式の作成を行った。
CNNとロジスティック回帰を用いたケトーシス予測式及びInception(CNN)とロジスティック回帰を用いたケトーシス予測式の作成を行った。
上記検証1、2により、ケトーシスを予測できる4種類の式を構築できた。なお、InceptionはCNNの1種である。各式の係数を図35に示す。また、前産次における日乳量について、本実施例では、データの不規則な変動や欠損などを除去するべく、10日間分の時系列の日乳量データを平均した10日移動平均の日乳量を採用した。続いて、式を構築した牧場とは異なる牧場のデータを用いて、構築した式を用いてスコアを算出し、分娩後の代謝性疾患、炎症関連因子の予測精度を検証した。
・産次
・フレッシュ期採食平均(フレッシュ期_採食_mean)、泌乳前期採食平均(泌乳前期_採食_mean)、泌乳ピーク期採食平均(泌乳ピーク_採食_mean)、泌乳後期採食平均(泌乳後期_採食_mean)
・フレッシュ期全反芻時間平均(フレッシュ期_all_rumination_mean)、泌乳前期全反芻時間平均(泌乳前期_all_rumination_mean)泌乳ピーク期全反芻時間平均(泌乳前期_all_rumination_mean)、泌乳後期全反芻時間平均(泌乳前期_all_rumination_mean)
・フレッシュ期乳量充足率平均(フレッシュ期_乳量充足率_mean)、泌乳前期乳量充足率平均(泌乳前期_乳量充足率_mean)、泌乳ピーク期乳量充足率平均(泌乳ピーク期_乳量充足率_mean)、泌乳後期乳量充足率平均(泌乳後期_乳量充足率_mean)
・フレッシュ期DMI充足率平均(フレッシュ期_DMI充足率_mean)、泌乳前期DMI充足率平均(泌乳前期_DMI充足率_mean)、泌乳ピーク期DMI充足率平均(泌乳ピーク期_DMI充足率_mean)、泌乳後期DMI充足率平均(泌乳後期_DMI充足率_mean)
・フレッシュ期ME充足率平均(フレッシュ期_ME充足率_mean)、泌乳前期ME充足率平均(泌乳前期_ME充足率_mean)、泌乳ピーク期ME充足率平均(泌乳ピーク期_ME充足率_mean)、泌乳後期ME充足率平均(泌乳後期_ME充足率_mean)
・フレッシュ期MP充足率平均(フレッシュ期_MP充足率_mean)、泌乳前期MP充足率平均(泌乳前期_MP充足率_mean)、泌乳ピーク期MP充足率平均(泌乳ピーク期_MP充足率_mean)、泌乳後期MP充足率平均(泌乳後期_MP充足率_mean)
・フレッシュ期搾乳量平均(フレッシュ期_搾乳量_mean)、泌乳前期搾乳量平均(泌乳前期_搾乳量_mean)、泌乳ピーク期搾乳量平均(泌乳ピーク期_搾乳量_mean)、泌乳後期搾乳量平均(泌乳後期_搾乳量_mean)
・フレッシュ期採食標準偏差(フレッシュ期_採食_std)、泌乳前期採食標準偏差(泌乳前期_採食_std)、泌乳ピーク期採食標準偏差(泌乳ピーク期_採食_std)、泌乳後期採食標準偏差(泌乳後期_採食_std)
・フレッシュ期全反芻時間標準偏差(フレッシュ期_all_rumination_std)、泌乳前期全反芻時間標準偏差(泌乳前期_all_rumination_std)、泌乳ピーク期全反芻時間標準偏差(泌乳ピーク期_all_rumination_std)、泌乳後期全反芻時間標準偏差(泌乳後期_all_rumination_std)
・フレッシュ期乳量充足率標準偏差(フレッシュ期_乳量充足率_std)、泌乳前期乳量充足率標準偏差(泌乳前期_乳量充足率_std)、泌乳ピーク期乳量充足率標準偏差(泌乳ピーク期_乳量充足率_std)、泌乳後期乳量充足率標準偏差(泌乳後期_乳量充足率_std)
・フレッシュ期DMI充足率標準偏差(フレッシュ期_DMI充足率_std)、泌乳前期DMI充足率標準偏差(泌乳前期_DMI充足率_std)、泌乳ピーク期DMI充足率標準偏差(泌乳ピーク期_DMI充足率_std)、泌乳後期DMI充足率標準偏差(泌乳後期_DMI充足率_std)
・フレッシュ期ME充足率標準偏差(フレッシュ期_ME充足率_std)、泌乳前期ME充足率標準偏差(泌乳前期_ME充足率_std)、泌乳ピーク期ME充足率標準偏差(泌乳ピーク期_ME充足率_std)、泌乳後期ME充足率標準偏差(泌乳後期_ME充足率_std)
・フレッシュ期MP充足率標準偏差(フレッシュ期_MP充足率_std)、泌乳前期MP充足率標準偏差(泌乳前期_MP充足率_std)、泌乳ピーク期MP充足率標準偏差(泌乳ピーク期_MP充足率_std)、泌乳後期MP充足率標準偏差(泌乳後期_MP充足率_std)
・フレッシュ期搾乳量標準偏差(フレッシュ期_搾乳量_std)、泌乳前期搾乳量標準偏差(泌乳前期_搾乳量_std)、泌乳ピーク期搾乳量標準偏差(泌乳ピーク期_搾乳量_std)、泌乳後期搾乳量標準偏差(泌乳後期_搾乳量_std)
・採食
・動態
・横臥
・起立
・全反芻時間(all_rumination)
・起立反芻
・横臥反芻
・搾乳量
102 制御部
102a 取得部
102b 指定部
102c 式作成部
102d 評価部
102d1 算出部
102d2 変換部
102d3 生成部
102d4 分類部
102e 結果出力部
102f 送信部
104 通信インターフェース部
106 記憶部
106a 非血液データファイル
106b BHBA状態情報ファイル
106c 指定BHBA状態情報ファイル
106d 式関連情報データベース
106d1 式ファイル
106e 評価結果ファイル
108 入出力インターフェース部
112 入力装置
114 出力装置
200 クライアント装置(端末装置(情報通信端末装置))
300 ネットワーク
400 データベース装置
Claims (40)
- 今回の分娩前の牛の、非侵襲的な方法により取得可能な畜牛管理情報に関する値である第一の値、前記第一の値が代入される変数を含む式および前記第一の値を用いて算出された前記式の値、または、前記第一の値に基づいて生成されたグラフを用いて、今回の分娩後の前記牛の代謝性疾患の状態を評価する第一の評価を行う評価ステップを含むこと、
を特徴とする評価方法。 - 前記第一の値が、採食時間、反芻時間、代謝タンパク質充足率(MP充足率)、代謝エネルギー充足率(ME充足率)、乾物摂取量充足率(DMI充足率)、搾乳量、乳量充足率および前回の分娩後の日数のうちの少なくとも一つの値であること、
を特徴とする請求項1に記載の評価方法。 - 前記牛が、乳牛または肉牛であること、
を特徴とする請求項1に記載の評価方法。 - 前記第一の値が、所定の乳期における値であること、
を特徴とする請求項1に記載の評価方法。 - 前記第一の値が、今回の分娩前の牛の産次数および総搾乳日数の少なくとも一方であること、
を特徴とする請求項1に記載の評価方法。 - 前記第一の値が、更に、今回の分娩前の牛の産次数および総搾乳日数の少なくとも一方の属性を持つこと、
を特徴とする請求項1に記載の評価方法。 - 前記第一の値が、平均値および標準偏差の少なくとも一方であること、
を特徴とする請求項1に記載の評価方法。 - 前記第一の評価においては、前記牛が今回の分娩後に前記代謝性疾患に罹患している状態であるか、および、前記牛が今回の分娩後に前記代謝性疾患に罹患してはいないものの検査が必要な状態であるか、の少なくとも一方を評価すること、
を特徴とする請求項1に記載の評価方法。 - 前記代謝性疾患の状態が、今回の分娩後の所定時点における代謝性疾患の状態であること、
を特徴とする請求項1に記載の評価方法。 - 前記代謝性疾患が、潜在性ケトーシス、顕在性ケトーシス、子宮炎、胎盤停滞、第四胃変位、乳熱、アシドーシス、蹄病または乳房炎であること、
を特徴とする請求項1に記載の評価方法。 - 前記評価ステップにおいては、前記前回の分娩後の日数を一方の軸の値とし、前記搾乳量を他方の軸の値とすることで生成された前記グラフの画像を用いて、前記第一の評価を行うこと、
を特徴とする請求項2に記載の評価方法。 - 前記評価ステップにおいては、今回の分娩前の前記牛の血液中のアミノ酸の濃度値である第二の値、または、前記第二の値が代入される変数を含む式および前記第二の値を用いて算出された前記式の値を用いて、今回の分娩後の前記牛の代謝性疾患の状態を評価する第二の評価を更に行うこと、
を特徴とする請求項1に記載の評価方法。 - 前記評価ステップにおいては、前記第二の評価に続いて、非侵襲的な方法により取得可能な畜牛管理情報に関する値である第三の値、または、前記第三の値が代入される変数を含む式および前記第三の値を用いて算出された前記式の値、または、前記第三の値に基づいて生成されたグラフを用いて、今回の分娩後の前記牛の代謝性疾患の状態を評価する第三の評価を更に行うこと、
を特徴とする請求項12に記載の評価方法。 - 前記評価ステップにおいて分娩後に前記代謝性疾患に罹患する可能性が高いと評価された牛に対して、予防的処置を提案する提案ステップを更に含むこと、
を特徴とする請求項1に記載の評価方法。 - 前記予防的処置が、RumenProtectアミノ酸の投与、飼料添加物の投与、薬剤の投与および獣医の診断からなる群から選択される少なくとも一つであること、
を特徴とする請求項14に記載の評価方法。 - 前記飼料添加物が、PH調整剤、イオンバランス調整剤、カビ毒吸着剤、プロピオン酸カルシウム等のプロピオン酸類縁体、ビタミン、ミネラル、アミノ酸、脂肪酸、尿素、生菌剤、酵母、酵素、抗生物質、抗酸化剤、抗菌剤および有機酸からなる群から選択される少なくとも一つであること、
を特徴とする請求項15に記載の評価方法。 - 前記提案ステップにおいては、前記代謝性疾患に罹患する可能性があると評価された牛に対して、統計的因果推論を行って罹患する原因を推測し、その原因に対応する予防的処置を提案すること、
を特徴とする請求項14から16のいずれか一つに記載の評価方法。 - 前記評価ステップおよび前記提案ステップが、制御部を備える情報処理装置の前記制御部において実行されること、
を特徴とする請求項14に記載の評価方法。 - 今回の分娩前の牛の、非侵襲的な方法により取得可能な畜牛管理情報に関する値である第一の値、および、前記第一の値が代入される変数を含む、今回の分娩後の前記牛の代謝性疾患の状態を評価するための式を用いて、前記式の値を算出する算出ステップを含むこと、
を特徴とする算出方法。 - 前記算出ステップは、制御部を備える情報処理装置の前記制御部において実行されること、
を特徴とする請求項19に記載の算出方法。 - 制御部を備える評価装置であって、
前記制御部は
今回の分娩前の牛の、非侵襲的な方法により取得可能な畜牛管理情報に関する値である第一の値、前記第一の値が代入される変数を含む式および前記第一の値を用いて算出された前記式の値、または、前記第一の値に基づいて生成されたグラフを用いて、今回の分娩後の前記牛の代謝性疾患の状態を評価する第一の評価を行う評価手段を備えること、
を特徴とする評価装置。 - 前記第一の値、前記式の前記値または前記グラフを提供する端末装置とネットワークを介して通信可能に接続されており、
前記制御部は、
前記端末装置から送信された前記第一の値、前記式の前記値または前記グラフを受信するデータ受信手段と、
前記評価手段で得られた評価結果を前記端末装置へ送信する結果送信手段と、
を更に備え、
前記評価手段は、前記データ受信手段で受信した前記第一の値、前記式の前記値または前記グラフを用いること、
を特徴とする請求項21に記載の評価装置。 - 制御部を備える算出装置であって、
前記制御部は、
今回の分娩前の牛の、非侵襲的な方法により取得可能な畜牛管理情報に関する値である第一の値、および、前記第一の値が代入される変数を含む、今回の分娩後の前記牛の代謝性疾患の状態を評価するための式を用いて、前記式の値を算出する算出手段を備えること、
を特徴とする算出装置。 - 制御部を備える情報処理装置において実行させるための評価プログラムであって、
前記制御部において実行させるための、
今回の分娩前の牛の、非侵襲的な方法により取得可能な畜牛管理情報に関する値である第一の値、前記第一の値が代入される変数を含む式および前記第一の値を用いて算出された前記式の値、または、前記第一の値に基づいて生成されたグラフを用いて、今回の分娩後の前記牛の代謝性疾患の状態を評価する第一の評価を行う評価ステップを含むこと、
を特徴とする評価プログラム。 - 制御部を備える情報処理装置において実行させるための算出プログラムであって、
前記制御部において実行させるための、
今回の分娩前の牛の、非侵襲的な方法により取得可能な畜牛管理情報に関する値である第一の値、および、前記第一の値が代入される変数を含む、今回の分娩後の前記牛の代謝性疾患の状態を評価するための式を用いて、前記式の値を算出する算出ステップを含むこと、
を特徴とする算出プログラム。 - 請求項24または25に記載のプログラムを記録したコンピュータ読み取り可能な記録媒体。
- 制御部を備える評価装置と制御部を備える端末装置とをネットワークを介して通信可能に接続して構成される評価システムであって、
前記端末装置の前記制御部は、
今回の分娩前の牛の、非侵襲的な方法により取得可能な畜牛管理情報に関する値である第一の値、前記第一の値が代入される変数を含む式および前記第一の値を用いて算出された前記式の値、または、前記第一の値に基づいて生成されたグラフを前記評価装置へ送信するデータ送信手段と、
前記評価装置から送信された、今回の分娩後の前記牛の代謝性疾患の状態に関する評価結果を受信する結果受信手段と、
を備え、
前記評価装置の前記制御部は、
前記端末装置から送信された前記第一の値、前記式の前記値または前記グラフを受信するデータ受信手段と、
前記データ受信手段で受信した前記第一の値、前記式の前記値または前記グラフを用いて、今回の分娩後の前記牛の代謝性疾患の状態を評価する評価手段と、
前記評価手段で得られた前記評価結果を前記端末装置へ送信する結果送信手段と、
を備えること、
を特徴とする評価システム。 - 制御部を備えた端末装置であって、
前記制御部は、
今回の分娩後の牛の代謝性疾患の状態に関する評価結果を取得する結果取得手段
を備え、
前記評価結果は、今回の分娩前の牛の、非侵襲的な方法により取得可能な畜牛管理情報に関する値である第一の値、前記第一の値が代入される変数を含む式および前記第一の値を用いて算出された前記式の値、または、前記第一の値に基づいて生成されたグラフを用いて、今回の分娩後の前記牛の代謝性疾患の状態を評価した結果であること、
を特徴とする端末装置。 - 前記評価を行う評価装置とネットワークを介して通信可能に接続されており、
前記結果取得手段は、前記評価装置から送信された前記結果を受信すること、
を特徴とする請求項28に記載の端末装置。 - 今回の分娩前の牛の、非侵襲的な方法により取得可能な畜牛管理情報に関する値である第一の値を取得し、
今回の分娩後の前記牛の代謝性疾患の状態を取得し、
前記取得した第一の値および前記取得した今回の分娩後の前記牛の代謝性疾患の状態を教師データとして用いて、所定の解析手法により、今回の分娩後の前記牛の代謝性疾患の状態を今回の分娩前に評価するための式を生成する式生成ステップを含むこと、
を特徴とする式生成方法。 - 前記第一の値が、採食時間、反芻時間、代謝タンパク質充足率(MP充足率)、代謝エネルギー充足率(ME充足率)、乾物摂取量充足率(DMI充足率)、搾乳量、乳量充足率および前回の分娩後の日数のうちの少なくとも一つの値であること、
を特徴とする請求項30に記載の式生成方法。 - 前記牛が、乳牛または肉牛であること、
を特徴とする請求項30に記載の式生成方法。 - 前記第一の値が、所定の乳期における値であること、
を特徴とする請求項30に記載の式生成方法。 - 前記第一の値が、今回の分娩前の牛の産次数および総搾乳日数の少なくとも一方であること、
を特徴とする請求項30に記載の式生成方法。 - 前記第一の値が、更に、今回の分娩前の牛の産次数および総搾乳日数の少なくとも一方の属性を持つこと、
を特徴とする請求項30に記載の式生成方法。 - 前記第一の値が、平均値および標準偏差の少なくとも一方であること、
を特徴とする請求項30に記載の式生成方法。 - 今回の分娩後の前記牛の代謝性疾患の状態とは、前記牛が今回の分娩後に前記代謝性疾患に罹患している状態であるか、または、前記牛が今回の分娩後に前記代謝性疾患に罹患してはいないものの検査が必要な状態であるか、であること、
を特徴とする請求項30に記載の式生成方法。 - 前記代謝性疾患の状態が、今回の分娩後の所定時点における代謝性疾患の状態であること、
を特徴とする請求項30に記載の式生成方法。 - 前記代謝性疾患が、潜在性ケトーシス、顕在性ケトーシス、子宮炎、胎盤停滞、第四胃変位、乳熱、アシドーシス、蹄病または乳房炎であること、
を特徴とする請求項30に記載の式生成方法。 - 前記所定の解析手法が、決定木、ランダムフォレスト、ニューラルネットワークおよびロジスティック回帰からなる群から選択される少なくとも一つの解析手法であること、
を特徴とする請求項30から39のいずれか一つに記載の式生成方法。
Priority Applications (5)
| Application Number | Priority Date | Filing Date | Title |
|---|---|---|---|
| JP2025516911A JPWO2024225424A1 (ja) | 2023-04-28 | 2024-04-26 | |
| CN202480028330.3A CN121078973A (zh) | 2023-04-28 | 2024-04-26 | 分娩后的代谢性疾病的评价方法 |
| EP24797169.0A EP4702837A1 (en) | 2023-04-28 | 2024-04-26 | Method for evaluating metabolic disease following calving |
| US19/368,067 US20260047557A1 (en) | 2023-04-28 | 2025-10-24 | Evaluating method of postpartum metabolic diseases |
| MX2025012845A MX2025012845A (es) | 2023-04-28 | 2025-10-27 | Metodo de evaluacion de enfermedades metabolicas posparto |
Applications Claiming Priority (2)
| Application Number | Priority Date | Filing Date | Title |
|---|---|---|---|
| JP2023074785 | 2023-04-28 | ||
| JP2023-074785 | 2023-04-28 |
Related Child Applications (1)
| Application Number | Title | Priority Date | Filing Date |
|---|---|---|---|
| US19/368,067 Continuation US20260047557A1 (en) | 2023-04-28 | 2025-10-24 | Evaluating method of postpartum metabolic diseases |
Publications (1)
| Publication Number | Publication Date |
|---|---|
| WO2024225424A1 true WO2024225424A1 (ja) | 2024-10-31 |
Family
ID=93256769
Family Applications (1)
| Application Number | Title | Priority Date | Filing Date |
|---|---|---|---|
| PCT/JP2024/016392 Ceased WO2024225424A1 (ja) | 2023-04-28 | 2024-04-26 | 分娩後の代謝性疾患の評価方法 |
Country Status (6)
| Country | Link |
|---|---|
| US (1) | US20260047557A1 (ja) |
| EP (1) | EP4702837A1 (ja) |
| JP (1) | JPWO2024225424A1 (ja) |
| CN (1) | CN121078973A (ja) |
| MX (1) | MX2025012845A (ja) |
| WO (1) | WO2024225424A1 (ja) |
Citations (12)
| Publication number | Priority date | Publication date | Assignee | Title |
|---|---|---|---|---|
| WO2003069328A1 (en) | 2002-02-14 | 2003-08-21 | Ajinomoto Co., Inc. | Method of analyzing aminofunctional compound and analytical reagent |
| WO2004052191A1 (ja) | 2002-12-09 | 2004-06-24 | Ajinomoto Co., Inc. | 生体状態情報処理装置、生体状態情報処理方法、生体状態情報管理システム、プログラム、および、記録媒体 |
| WO2005116629A1 (ja) | 2004-05-26 | 2005-12-08 | Ajinomoto Co., Inc. | アミノ官能性化合物の分析方法及び装置 |
| WO2006098192A1 (ja) | 2005-03-16 | 2006-09-21 | Ajinomoto Co., Inc. | 生体状態評価装置、生体状態評価方法、生体状態評価システム、生体状態評価プログラム、評価関数作成装置、評価関数作成方法、評価関数作成プログラムおよび記録媒体 |
| WO2008041371A1 (fr) | 2006-10-04 | 2008-04-10 | Ajinomoto Co., Inc. | Composition d'additif alimentaire pour ruminants et procédé de fabrication de celle-ci |
| JP5710180B2 (ja) | 2010-08-30 | 2015-04-30 | 独立行政法人農業・食品産業技術総合研究機構 | 胎盤停滞の発生予測法 |
| WO2018003638A1 (ja) | 2016-06-30 | 2018-01-04 | 味の素株式会社 | 分娩後ケトーシスの評価方法 |
| JP2020137430A (ja) * | 2019-02-27 | 2020-09-03 | 光和ネットサービス株式会社 | 行動検出装置および行動検出方法 |
| WO2021221249A1 (ko) | 2020-04-27 | 2021-11-04 | 주식회사 아이티테크 | 스마트 가축 관리 시스템 및 그 방법 |
| JP2022013409A (ja) | 2020-07-03 | 2022-01-18 | 国立大学法人京都大学 | 関係性推定システム |
| JP2022052809A (ja) * | 2020-09-24 | 2022-04-05 | 国立大学法人 宮崎大学 | 牛用鼻輪 |
| CN114373505A (zh) | 2021-12-29 | 2022-04-19 | 浙江大学 | 一种基于肠道微生物早期预测奶牛产后亚临床酮病的系统 |
-
2024
- 2024-04-26 JP JP2025516911A patent/JPWO2024225424A1/ja active Pending
- 2024-04-26 WO PCT/JP2024/016392 patent/WO2024225424A1/ja not_active Ceased
- 2024-04-26 CN CN202480028330.3A patent/CN121078973A/zh active Pending
- 2024-04-26 EP EP24797169.0A patent/EP4702837A1/en active Pending
-
2025
- 2025-10-24 US US19/368,067 patent/US20260047557A1/en active Pending
- 2025-10-27 MX MX2025012845A patent/MX2025012845A/es unknown
Patent Citations (12)
| Publication number | Priority date | Publication date | Assignee | Title |
|---|---|---|---|---|
| WO2003069328A1 (en) | 2002-02-14 | 2003-08-21 | Ajinomoto Co., Inc. | Method of analyzing aminofunctional compound and analytical reagent |
| WO2004052191A1 (ja) | 2002-12-09 | 2004-06-24 | Ajinomoto Co., Inc. | 生体状態情報処理装置、生体状態情報処理方法、生体状態情報管理システム、プログラム、および、記録媒体 |
| WO2005116629A1 (ja) | 2004-05-26 | 2005-12-08 | Ajinomoto Co., Inc. | アミノ官能性化合物の分析方法及び装置 |
| WO2006098192A1 (ja) | 2005-03-16 | 2006-09-21 | Ajinomoto Co., Inc. | 生体状態評価装置、生体状態評価方法、生体状態評価システム、生体状態評価プログラム、評価関数作成装置、評価関数作成方法、評価関数作成プログラムおよび記録媒体 |
| WO2008041371A1 (fr) | 2006-10-04 | 2008-04-10 | Ajinomoto Co., Inc. | Composition d'additif alimentaire pour ruminants et procédé de fabrication de celle-ci |
| JP5710180B2 (ja) | 2010-08-30 | 2015-04-30 | 独立行政法人農業・食品産業技術総合研究機構 | 胎盤停滞の発生予測法 |
| WO2018003638A1 (ja) | 2016-06-30 | 2018-01-04 | 味の素株式会社 | 分娩後ケトーシスの評価方法 |
| JP2020137430A (ja) * | 2019-02-27 | 2020-09-03 | 光和ネットサービス株式会社 | 行動検出装置および行動検出方法 |
| WO2021221249A1 (ko) | 2020-04-27 | 2021-11-04 | 주식회사 아이티테크 | 스마트 가축 관리 시스템 및 그 방법 |
| JP2022013409A (ja) | 2020-07-03 | 2022-01-18 | 国立大学法人京都大学 | 関係性推定システム |
| JP2022052809A (ja) * | 2020-09-24 | 2022-04-05 | 国立大学法人 宮崎大学 | 牛用鼻輪 |
| CN114373505A (zh) | 2021-12-29 | 2022-04-19 | 浙江大学 | 一种基于肠道微生物早期预测奶牛产后亚临床酮病的系统 |
Non-Patent Citations (5)
| Title |
|---|
| K. KIDA: "The metabolic profile test: Its practicability in assessing feeding management and periparturient diseases in high yielding commercial dairy herds", J. VET. MED. SCI, vol. 64, 2002, pages 557 - 563 |
| OIKAWA, SHIN: "Research Trend on Subclinical Ketosis in Dairy Cattle.", JOURNAL OF THE JAPAN VETERINARY MEDICAL ASSOCIATION, vol. 68, 1 January 2015 (2015-01-01), pages 33 - 42, XP093227871 * |
| P. A. OSPINA, D. V. NYDAM, T.STOKOL, AND T. R. OVERTON, DAIRY. SCI, vol. 93, 2010, pages 546 - 554 |
| See also references of EP4702837A1 |
| T. F. DUFFIELDK. D. LISSEMOREB. W. MCBRIDEK. E. LESLIE: "Impact of hyperketonemia in early lactation dairy cows on health and production", J. DAIRY. SCI, vol. 92, 2009, pages 571 - 580 |
Also Published As
| Publication number | Publication date |
|---|---|
| EP4702837A1 (en) | 2026-03-04 |
| MX2025012845A (es) | 2025-12-01 |
| US20260047557A1 (en) | 2026-02-19 |
| CN121078973A (zh) | 2025-12-05 |
| JPWO2024225424A1 (ja) | 2024-10-31 |
Similar Documents
| Publication | Publication Date | Title |
|---|---|---|
| Bowen et al. | Early prediction of respiratory disease in preweaning dairy calves using feeding and activity behaviors | |
| Fenlon et al. | A comparison of 4 predictive models of calving assistance and difficulty in dairy heifers and cows | |
| Maselyne et al. | Online warning systems for individual fattening pigs based on their feeding pattern | |
| Cantor et al. | Using machine learning and behavioral patterns observed by automated feeders and accelerometers for the early indication of clinical bovine respiratory disease status in preweaned dairy calves | |
| Lukas et al. | A novel method of analyzing daily milk production and electrical conductivity to predict disease onset | |
| Goetz et al. | Identification of biomarkers measured upon arrival associated with morbidity, mortality, and average daily gain in grain-fed veal calves | |
| JP7501573B2 (ja) | 分娩後ケトーシスの評価方法 | |
| Naqvi et al. | Mastitis detection with recurrent neural networks in farms using automated milking systems | |
| Decaris et al. | Diagnostic accuracy of Wisconsin and California scoring systems to detect bovine respiratory disease in preweaning dairy calves under subtropical environmental conditions | |
| Mei et al. | Identification of aflatoxin-poisoned broilers based on accelerometer and machine learning | |
| Van Leerdam et al. | A predictive model for hypocalcaemia in dairy cows utilizing behavioural sensor data combined with deep learning | |
| Trapanese et al. | Short review of current limits and challenges of application of machine learning algorithms in the dairy sector | |
| Fenlon et al. | The creation and evaluation of a model predicting the probability of conception in seasonal-calving, pasture-based dairy cows | |
| Kasab-Bachi et al. | The use of large databases to inform the development of an intestinal scoring system for the poultry industry | |
| Dallago et al. | The associations of early-life health and performance with subsequent dairy cow longevity, productivity, and profitability | |
| Perttu et al. | Predictive models for disease detection in group-housed preweaning dairy calves using data collected from automated milk feeders | |
| Çakmakçı | Sheep's coping style can be identified by unsupervised machine learning from unlabeled data | |
| Cihan et al. | Effect of imputation methods in the classifier performance | |
| WO2024225424A1 (ja) | 分娩後の代謝性疾患の評価方法 | |
| Thomas et al. | Repeatability and predictability of lying and feeding behaviours in dairy cattle | |
| Cihan et al. | A review on determination of computer aid diagnosis and/or risk factors using data mining methods in veterinary field | |
| Alrhmoun | Exploring critical animal-based traits as potential predictors of production diseases in dairy cattle: a systematic review and meta-analysis | |
| Chakraborty et al. | Performance analysis of machine learning classifier on different cow health datasets | |
| Tusingwiire et al. | Genetic determinism of sensitivity to environmental challenges using daily feed intake records in three lines of pigs | |
| Ruegg | Basic epidemiologic concepts related to assessment of animal health and performance |
Legal Events
| Date | Code | Title | Description |
|---|---|---|---|
| 121 | Ep: the epo has been informed by wipo that ep was designated in this application |
Ref document number: 24797169 Country of ref document: EP Kind code of ref document: A1 |
|
| ENP | Entry into the national phase |
Ref document number: 2025516911 Country of ref document: JP Kind code of ref document: A |
|
| WWE | Wipo information: entry into national phase |
Ref document number: 2025516911 Country of ref document: JP |
|
| WWE | Wipo information: entry into national phase |
Ref document number: MX/A/2025/012845 Country of ref document: MX |
|
| REG | Reference to national code |
Ref country code: BR Ref legal event code: B01A Ref document number: 112025023347 Country of ref document: BR |
|
| WWE | Wipo information: entry into national phase |
Ref document number: 2024797169 Country of ref document: EP |
|
| NENP | Non-entry into the national phase |
Ref country code: DE |
|
| ENP | Entry into the national phase |
Ref document number: 2024797169 Country of ref document: EP Effective date: 20251128 |
|
| WWP | Wipo information: published in national office |
Ref document number: MX/A/2025/012845 Country of ref document: MX |
|
| ENP | Entry into the national phase |
Ref document number: 2024797169 Country of ref document: EP Effective date: 20251128 |
|
| ENP | Entry into the national phase |
Ref document number: 2024797169 Country of ref document: EP Effective date: 20251128 |
|
| ENP | Entry into the national phase |
Ref document number: 2024797169 Country of ref document: EP Effective date: 20251128 |
|
| ENP | Entry into the national phase |
Ref document number: 2024797169 Country of ref document: EP Effective date: 20251128 |
|
| ENP | Entry into the national phase |
Ref document number: 2024797169 Country of ref document: EP Effective date: 20251128 |
|
| ENP | Entry into the national phase |
Ref document number: 2024797169 Country of ref document: EP Effective date: 20251128 |
|
| ENP | Entry into the national phase |
Ref document number: 2024797169 Country of ref document: EP Effective date: 20251128 |
|
| ENP | Entry into the national phase |
Ref document number: 2024797169 Country of ref document: EP Effective date: 20251128 |
|
| WWP | Wipo information: published in national office |
Ref document number: 2024797169 Country of ref document: EP |