WO2024248147A1 - 画像評価方法、画像評価装置、コンピュータプログラム、および非一時的なコンピュータ可読媒体 - Google Patents
画像評価方法、画像評価装置、コンピュータプログラム、および非一時的なコンピュータ可読媒体 Download PDFInfo
- Publication number
- WO2024248147A1 WO2024248147A1 PCT/JP2024/020089 JP2024020089W WO2024248147A1 WO 2024248147 A1 WO2024248147 A1 WO 2024248147A1 JP 2024020089 W JP2024020089 W JP 2024020089W WO 2024248147 A1 WO2024248147 A1 WO 2024248147A1
- Authority
- WO
- WIPO (PCT)
- Prior art keywords
- image
- image evaluation
- feature points
- index value
- subject
- Prior art date
- Legal status (The legal status is an assumption and is not a legal conclusion. Google has not performed a legal analysis and makes no representation as to the accuracy of the status listed.)
- Ceased
Links
Images










Classifications
-
- G—PHYSICS
- G06—COMPUTING OR CALCULATING; COUNTING
- G06T—IMAGE DATA PROCESSING OR GENERATION, IN GENERAL
- G06T7/00—Image analysis
- G06T7/0002—Inspection of images, e.g. flaw detection
- G06T7/0012—Biomedical image inspection
-
- A—HUMAN NECESSITIES
- A61—MEDICAL OR VETERINARY SCIENCE; HYGIENE
- A61B—DIAGNOSIS; SURGERY; IDENTIFICATION
- A61B8/00—Diagnosis using ultrasonic, sonic or infrasonic waves
- A61B8/08—Clinical applications
-
- A—HUMAN NECESSITIES
- A61—MEDICAL OR VETERINARY SCIENCE; HYGIENE
- A61B—DIAGNOSIS; SURGERY; IDENTIFICATION
- A61B8/00—Diagnosis using ultrasonic, sonic or infrasonic waves
- A61B8/13—Tomography
- A61B8/14—Echo-tomography
-
- G—PHYSICS
- G06—COMPUTING OR CALCULATING; COUNTING
- G06T—IMAGE DATA PROCESSING OR GENERATION, IN GENERAL
- G06T7/00—Image analysis
- G06T7/10—Segmentation; Edge detection
- G06T7/12—Edge-based segmentation
-
- G—PHYSICS
- G06—COMPUTING OR CALCULATING; COUNTING
- G06T—IMAGE DATA PROCESSING OR GENERATION, IN GENERAL
- G06T7/00—Image analysis
- G06T7/10—Segmentation; Edge detection
- G06T7/168—Segmentation; Edge detection involving transform domain methods
-
- G—PHYSICS
- G06—COMPUTING OR CALCULATING; COUNTING
- G06T—IMAGE DATA PROCESSING OR GENERATION, IN GENERAL
- G06T2207/00—Indexing scheme for image analysis or image enhancement
- G06T2207/10—Image acquisition modality
- G06T2207/10132—Ultrasound image
-
- G—PHYSICS
- G06—COMPUTING OR CALCULATING; COUNTING
- G06T—IMAGE DATA PROCESSING OR GENERATION, IN GENERAL
- G06T2207/00—Indexing scheme for image analysis or image enhancement
- G06T2207/20—Special algorithmic details
- G06T2207/20048—Transform domain processing
- G06T2207/20061—Hough transform
-
- G—PHYSICS
- G06—COMPUTING OR CALCULATING; COUNTING
- G06T—IMAGE DATA PROCESSING OR GENERATION, IN GENERAL
- G06T2207/00—Indexing scheme for image analysis or image enhancement
- G06T2207/30—Subject of image; Context of image processing
- G06T2207/30004—Biomedical image processing
Definitions
- the present disclosure relates to a method and apparatus for evaluating indicators related to at least one of lower urinary tract function and pelvic floor function based on ultrasound images of a subject's pelvic region, as well as a computer program executable by a processor mounted on the apparatus and a non-transitory computer-readable medium on which the computer program is stored.
- Patent Document 1 discloses a device capable of acquiring ultrasound images that capture the subject's pelvic region.
- the ultrasound images can be used, for example, to evaluate lower urinary tract function after radical prostatectomy, and for pelvic floor muscle training to suppress incontinence due to reduced pelvic floor function that can occur after childbirth.
- evaluation of the ultrasound images depends on the subjectivity and experience of the observer.
- One example aspect provided by the present disclosure is a method for evaluating images executed by at least one computing device, the method comprising: acquiring image data corresponding to an ultrasound image of the subject's pelvic region; extracting a plurality of feature points relating to a predetermined region by applying image processing to the image data; An index value associated with at least one of a lower urinary tract function and a pelvic floor function is calculated based on the plurality of feature points.
- One example aspect provided by the present disclosure is an image evaluation device, an interface for receiving image data corresponding to an ultrasound image of a pelvic region of the subject; a processor that applies image processing to the image data to extract a plurality of feature points related to a predetermined region, and calculates an index value associated with at least one of a lower urinary tract function and a pelvic floor function based on the plurality of feature points; It is equipped with:
- One example of the embodiment provided by the present disclosure is a computer program executable by a processor installed in an image evaluation device, By executing the above, the image evaluation device receiving image data corresponding to an ultrasound image of a pelvic region of the subject; extracting a plurality of feature points relating to a predetermined region by applying image processing to the image data; An index value associated with at least one of a lower urinary tract function and a pelvic floor function is calculated based on the plurality of feature points.
- a non-transitory computer-readable medium on which the above computer program is stored is also one of the exemplary aspects provided by the present disclosure.
- the process of calculating an index value associated with at least one of the subject's lower urinary tract function and pelvic floor function can be automated. Since the index value can be obtained without relying on the subjectivity or experience of the person observing the ultrasound image, an objective evaluation environment can be provided.
- 1 illustrates diagrammatically the organs contained in the male pelvic region. Illustrates the situation after a radical prostatectomy has been performed.
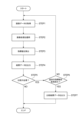
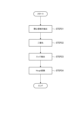
- 1 illustrates a method for evaluating images according to an embodiment. 4 illustrates a detailed flow of the image processing in FIG. 3 .
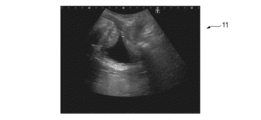
- 1 illustrates an example ultrasound image showing a subject's pelvic region.
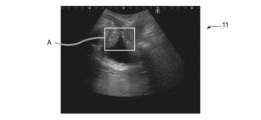
- 6 illustrates an example of a region of interest being identified in the ultrasound image of FIG. 5;
- FIG. 7 illustrates an example of an image in which only the region of interest is extracted.
- 8 illustrates an example of an image obtained by applying binarization processing to the image in FIG. 7.
- An example of an image to which edge extraction processing has been applied is shown in FIG. 8 .
- An example of an image obtained by applying Hough transform to the image of FIG. 9 is shown.
- 11A and 11B are diagrams for explaining a process for calculating the angle of the bladder neck.
- 11A and 11B are diagrams for explaining the process of calculating the angle of the bladder neck.
- 11A and 11B are diagrams for explaining a process for calculating the angle of the bladder neck.
- 13 illustrates an example of the bladder neck angle being displayed.
- FIG. 13 is a diagram for explaining the angle of the bulbar urethra.
- 1 illustrates an ultrasound image showing a subject's urethra.
- 13A and 13B are diagrams for explaining the process of calculating the angle of the bulbar urethra.
- 13A and 13B are diagrams for explaining the process of calculating the angle of the bulbar urethra.
- FIG. 13A and 13B are diagrams for explaining the process of calculating the angle of the bulbar urethra.
- FIG. 2 is a diagram for explaining the distance between the lower edge of the pubic bone and the anorectal angle.
- 11A and 11B are diagrams for explaining a process of calculating the distance between the pubic lower edge and the anorectal angle. 2 illustrates an example of a functional configuration of an image evaluation device according to an embodiment.
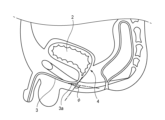
- Figure 1 shows a schematic illustration of the organs contained in the male pelvic region.
- Figure 2 shows the state after radical prostatectomy, a procedure known as a curative treatment for prostate cancer.
- Urinary incontinence is an example of a disease associated with decreased function of the lower urinary tract.
- the occurrence of funneling is characterized by the bladder neck angle ⁇ being smaller than before surgery (180°).
- the bladder neck angle ⁇ corresponds to the degree of funneling.
- the greater the angle ⁇ the greater the degree of funneling and the greater the severity of the functional impairment of the lower urinary tract.
- Lower urinary tract function is assessed by medical professionals visually inspecting ultrasound images that capture the subject's pelvic region.
- the bladder neck angle ⁇ can be an index value for quantitatively evaluating the function of the lower urinary tract.
- the index value is automatically calculated based on an ultrasound image that captures the subject's pelvic region.
- image data corresponding to an ultrasound image that captures the subject's pelvic region is acquired (STEP 1).
- the ultrasound image can be acquired, for example, by placing an ultrasound probe between the subject's legs.
- the image data is subjected to image processing (STEP 2).
- the image processing is a preliminary process to enable automatic calculation of the bladder neck angle ⁇ .
- the detailed flow of the image processing will be explained with reference to Figure 4.
- a process is performed to extract, as a region of interest, an area that includes at least the bladder neck from the ultrasound image that includes the pelvic region (STEP 21). This process is performed by applying a well-known object detection algorithm to the image data acquired in STEP 1.
- YOLO You Only Look Once
- Regions where YOLO determines that the probability of the bladder neck being reflected exceeds a predetermined threshold are identified as regions of interest.
- training data is used in which the position of the bladder neck is annotated for ultrasound images that reflect the pelvic region.
- FIG. 5 illustrates an ultrasound image 11 that includes the subject's pelvic region. Note that in this image, the up-down direction is opposite to that in FIG. 2; that is, the bladder neck is included at the top of the bladder.
- FIG. 6 illustrates an example where a region of interest A has been identified in ultrasound image 11 by applying YOLO.
- FIG. 7 illustrates an extracted image 12 where only region of interest A has been extracted from ultrasound image 11.
- binarization processing is performed on the extracted image 12 (STEP 22 in FIG. 4).
- Each of the multiple pixels that make up the extracted image 12 has one of the number of gradation values that can express shades of gray.
- the gradation value of each pixel is converted to either a value corresponding to white or a value corresponding to black.
- the gradation value of a pixel is less than a threshold, it is converted to a value corresponding to black, and if it is equal to or greater than the threshold, it is converted to a value corresponding to white.
- the threshold may be a predetermined fixed value, or may be a variable value determined through discriminant analysis.
- Figure 8 shows an example of a binary image 13 obtained by applying a binarization process to an extracted image 12.
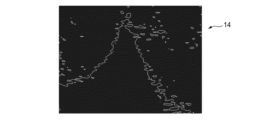
- edge extraction processing is performed on the binarized image 13 (STEP 23 in FIG. 4).
- Edge extraction is a process that emphasizes areas where there is a large difference in the gradation values of adjacent pixels. As is clear from the binarized image 13, the gradation values change significantly at the boundary between the bladder lumen and the inner wall. Therefore, the edge extraction processing emphasizes the boundary that forms part of the bladder neck.
- FIG. 9 shows an example of an edge-extracted image 14 obtained by applying edge extraction processing to a binarized image 13.
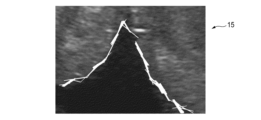
- the Hough transform is a process that detects straight lines in an input image.
- FIG. 10 shows an example of a straight line detection image 15 obtained by applying the Hough transform to the edge extraction image 14. A large number of straight lines are displayed, arranged along the boundary between the bladder lumen and the inner wall.
- edge extraction image 14 and straight line detection image 15 are shown as examples for ease of understanding, and do not necessarily need to be made visible to the user.
- Each process can be explained as a conversion process performed on the data corresponding to each image without visualization.
- the index value is then calculated (STEP 3). Based on the line detection image 15, the angle ⁇ of the subject's bladder neck is calculated as the index value.
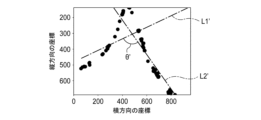
- FIG. 11 shows an example of a graph obtained by plotting the positions of the representative points in the line detection image 15, each of which is taken as a representative point for each of the many lines detected in the line detection image 15.
- the horizontal axis represents the horizontal coordinate in the line detection image 15, and the vertical axis represents the vertical coordinate in the same image.
- clustering is applied to the many plots obtained as described above. Specifically, the gradient value of the line that is the basis of each plot in the line detection image 15 is referenced. As illustrated in FIG. 12, plots obtained from lines whose gradients have positive values are classified into cluster C1. Plots obtained from lines whose gradients have negative values are classified into cluster C2. In FIG. 12, the vertical axis represents the horizontal coordinate in the line detection image 15, and the vertical axis represents the gradient value.
- cluster C1 those whose absolute value of the gradient is equal to or greater than the threshold are classified into cluster C11, and those whose absolute value is less than the threshold are classified into cluster C12.
- cluster C21 those whose absolute value of the gradient is equal to or greater than the threshold are classified into cluster C21, and those whose absolute value is less than the threshold are classified into cluster C22.
- FIG. 13 illustrates a state in which the plots classified into clusters C12 and C22 have been removed from the multiple plots illustrated in FIG. 11.
- the plots that remain have gradients whose absolute values are equal to or greater than a threshold value.
- Line L1 is obtained by applying linear regression to the multiple plots belonging to cluster C12 after weighting them according to the length of the line obtained by applying the Hough transform.
- Line L1 corresponds to a line approximating the inner wall surface of the bladder neck that is reflected in the extracted image 12 of FIG. 5 as having a positive gradient.
- line L2 is obtained by applying linear regression to the multiple plots belonging to cluster C22.
- Line L2 corresponds to a line approximating the inner wall surface of the bladder neck that is reflected in the extracted image 12 of FIG. 5 as having a negative gradient.
- the angle ⁇ formed by lines L1 and L2 is identified as the angle of the bladder neck.
- the above clustering approach which focuses on the absolute value of the gradient as well as the positive and negative values of the gradient, is based on the finding that the bladder neck where funneling occurs has a shape that includes areas with relatively large and relatively small gradients.
- the straight line L1' illustrated in FIG. 11 is obtained by applying linear regression to all the plots belonging to cluster C1.
- the straight line L2' is obtained by applying linear regression to all the plots belonging to cluster C2.
- the above clustering can be achieved by applying a well-known method at least once.
- well-known methods include the k-means method and mixed Gaussian distribution. Note that it is not necessary for the clustering to be performed by focusing on both the gradient and the magnitude of the line. For example, clustering may be performed at least once by focusing only on the magnitude of the gradient.
- the result data is then output (STEP 4).
- the result data is configured to include at least data corresponding to the bladder neck angle calculated as described above.
- FIG. 14 shows an example of the output mode of the result data.
- the calculated bladder neck angle is displayed on the display device. That is, the result data is configured to cause the display device to display the value of the angle.
- an image 16 showing the basis for the calculation of the angle is also displayed on the display device. Image 16 in this example corresponds to straight line detection image 15 shown in FIG. 10 with the straight lines that did not contribute to the calculation of the bladder neck angle removed.
- the output format of the result data is not limited to display on a display device.
- the result data can be configured to correspond to the format of a report to be printed or transmitted.
- the processing steps up to calculating the angle of the subject's bladder neck can be automated.
- This makes it possible to provide an index value associated with the function of the subject's lower urinary tract, regardless of the subjectivity or experience of the person observing the ultrasound image.
- it is possible to provide an environment in which an index value associated with the function of the subject's lower urinary tract can be objectively evaluated.
- the angle of the bulbar urethra is another example of an index that can be used to evaluate the function of the lower urinary tract.
- the bulbar urethra 3a is a part of the urethra 3 that curves greatly near the bladder neck 4.
- the angle ⁇ of the bulbar urethra 3a is defined as the angle between two approximation curves that extend along both ends of the bulbar urethra 3a.
- FIG. 16 illustrates an ultrasound image 17 that shows the subject's urethra 3 corresponding to the image data acquired in STEP 1 of FIG. 3 (the position of the urethra 3 is highlighted with a dashed line). Because the urethra 3 is a very long and slender tubular organ, it is not easy to visually determine the position of the urethra 3 from the ultrasound image 17.
- FIG. 17 shows the ultrasound image 17 of FIG. 16 upside down. That is, the urethra is reflected above the bladder neck 4.
- the cavernous muscle 8 and soft tissue 9 are adjacent to the urethra and appear as low-brightness areas in the ultrasound image 17. Therefore, the boundary B between the low-brightness area and the adjacent high-brightness area can be regarded as the urethra 3.
- FIG. 18 illustrates an example of a state in which the contours of the regions of interest corresponding to the low and high brightness regions are extracted by applying image processing to image data corresponding to an ultrasound image 17 (STEP 2 in FIG. 3).
- YOLO is also used as the object detection algorithm.
- the contours of areas where YOLO determines that the probability that the area of interest is reflected exceeds a predetermined threshold are extracted.
- the contours are acquired as a set of point clouds.
- training data is used that has been annotated by experts to trace the contours using as a reference images of the areas of interest marked by experts.
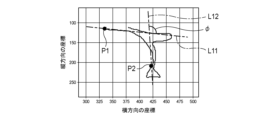
- the angle of the bulbar urethra is calculated as an index value (STEP 3 in FIG. 3). Specifically, a first end point P1 and a second end point P2 are identified in order to cut out the portion corresponding to the bulbar urethra 3a from the extracted contour.
- the first end point P1 can be identified, for example, as a point that takes an extreme value when the above-mentioned point group is regarded as a curve.
- the second end point P2 can be, for example, the coordinates of a point identified as the vertex of the bladder neck 4.
- a first approximate straight line L11 and a second approximate straight line L12 are set for the portion corresponding to the cut-out bulbar urethra 3a.
- the first approximate straight line L11 is set by applying linear regression to a group of points in an appropriate range including the first endpoint P1.
- the second approximate straight line L12 is set by applying linear regression to a group of points in an appropriate range including the second endpoint P2.
- the angle ⁇ between the first approximate straight line L11 and the second approximate straight line L12 is identified as the angle of the bulbar urethra.
- the result data in this example is configured to include at least data corresponding to the angle ⁇ calculated as described above.
- the result data can be output in the form of a report printed or data transmitted in addition to or instead of being displayed on the display device described with reference to FIG. 14.
- the processing steps up to calculating the angle of the subject's bulbar urethra can be automated.
- This makes it possible to provide an index value associated with the subject's lower urinary tract function without relying on the subjectivity or experience of the person observing the ultrasound image.
- it is possible to provide an environment in which the index value associated with the subject's lower urinary tract function can be objectively evaluated.
- the pelvic floor muscles 5 shown in Figure 20 are multiple muscles that make up the pelvic floor.
- the pelvic floor is a collective term for the muscles, fascia, and ligaments that support the pelvic organs (uterus, bladder, rectum, etc.). Training to strengthen the pelvic floor muscles 5 is performed for the purposes of preventing incontinence caused by decreased function of the pelvic floor that can occur after childbirth, and restoring lower urinary tract function that has decreased following the aforementioned radical prostatectomy. In the following explanation, this training will be referred to as "pelvic floor muscle training.”
- Pelvic floor muscle training is performed by having the subject consciously contract the pelvic floor muscles 5. Contracting the pelvic floor muscles 5 narrows the distance D between the inferior border of the pubic bone 6 and the anorectal angle 7. A medical professional visually checks the distance D in an ultrasound image capturing the subject's pelvic region to assess the subject's ability to appropriately contract the pelvic floor muscles 5. In other words, the distance D can be an index value for quantitatively assessing the function of the pelvic floor.
- the image evaluation method described with reference to FIG. 3 can also be used to calculate the index value. That is, the distance D between the pubic margin 6 and the anorectal angle 7 can be automatically calculated based on an ultrasound image that captures the subject's pelvic region.
- FIG. 21 illustrates an example of an ultrasound image 18 that includes the subject's pelvic region, which corresponds to the image data acquired in STEP 1 of FIG. 3.
- Image processing is applied to the image data (STEP 2 of FIG. 3), and an area including at least the pubic margin and an area including at least the anorectal angle are extracted as regions of interest.
- YOLO is also used as the object detection algorithm.
- An area in which YOLO determines that the probability that the pubic border is reflected exceeds a predetermined threshold is identified as area of interest A1.
- an area in which YOLO determines that the probability that the anorectal angle is reflected exceeds a predetermined threshold is identified as area of interest A2.
- training data is used in which annotations are added to ultrasound images that include the pelvic region, with the positions of the pubic border and the anorectal angle.
- distance D is calculated as an index value (STEP 3 in FIG. 3).
- the amount corresponding to the length of a straight line connecting the center point of region of interest A1 and the center point of region of interest A2 is specified as distance D.
- an appropriate representative point may be determined for each region of interest, and the amount corresponding to the length of a straight line connecting the representative points may be specified as distance D.
- the result data in this example is configured to include at least data corresponding to the distance D calculated as described above.
- the result data can be output in the form of a report printed or data transmitted in addition to or instead of being displayed on the display device described with reference to FIG. 14.
- the processing steps up to calculating the distance between the subject's pubic border and the anorectal angle can be automated.
- This makes it possible to provide an index value associated with the subject's pelvic floor function without relying on the subjectivity or experience of the person observing the ultrasound image.
- it is possible to provide an environment in which the index value associated with the subject's pelvic floor function can be objectively evaluated.
- the distance between the lower pubic border and the anorectal angle can be an example of an indicator associated with lower urinary tract function.
- the change in distance D over time can be automatically acquired by applying a process that tracks the positions of the pubic margin and the anorectal angle identified through image processing.
- processes include KCF (Kernelized Correction Filter), MIL (Multiple Instance Learning), TLD (Tracking Learning Detection), boosting, median flow, etc.
- index values such as the contraction speed, contraction acceleration, contraction frequency, duration of the contracted state, ability to repeat contractions, and delay time from the muscle contraction command (intention to start muscle contraction) of the pelvic floor muscles.
- the contraction and contraction state of the pelvic floor muscles can be visualized more clearly. This allows feedback to be given to the subject of pelvic floor muscle training, encouraging them to understand the success or failure of the exercise and any corrections required.
- the result data output in STEP 4 of FIG. 3 may include an estimate of the severity of the decline in at least one of the lower urinary tract function and the pelvic floor function based on the various index values calculated as described above.
- the greater the degree of funneling, the greater the bladder neck angle ⁇ , and therefore the greater the severity of the functional impairment of the lower urinary tract is estimated to be.
- Data showing the correspondence between index values and severity is stored in advance in a storage device in table format or as the result of machine learning.
- the data is referenced by a computing device that receives the index values as input, and the severity is automatically estimated.
- the output result data is configured to visualize the estimated severity results through at least one of text, color, and symbols.
- the result data output in STEP 4 of FIG. 3 may include the selection of a pelvic floor muscle training method based on at least one of the various index values calculated as described above and the severity estimated as described above.
- the policy for selecting a training method based on the evaluation results of the contraction ability of the pelvic floor muscles has become common. Therefore, by defining the correspondence between the evaluation results of the contraction ability of the pelvic floor muscles and at least one of the index value and severity estimation results obtained as described above, it is possible to automate the selection of a training method suitable for the subject.
- Data showing the correspondence is stored in advance in a storage device in table format or as the result of machine learning. The data is referenced by a calculation device that receives at least one of the index value and severity estimation results as input, and the selection of a training method is automatically performed.
- the output result data is configured to visualize the results of the training method selection through at least one of text, color, and symbol.
- the image evaluation method disclosed herein can be configured to allow comparison of index values calculated at multiple points in time.
- the comparison result may be presented in a form in which index values acquired at multiple points in time are listed, or a new index value obtained based on the multiple index values may be presented. Examples of the new index value include a difference value, an average value, etc.
- the image evaluation method illustrated in FIG. 3 may be executed by at least one computing device. Each processing step may be executed by a separate computing device, or multiple processing steps may be executed by a single computing device. When the image evaluation method is executed by multiple computing devices, the multiple computing devices may be installed in locations remote from each other. In this case, data is exchanged between the computing devices via a public or private communications network.
- the communications network may be realized by a wired connection, a wireless connection, or a combination thereof.
- FIG. 22 illustrates an example of the functional configuration of an image evaluation device 30 according to one embodiment.
- the image evaluation device 30 is an example of the above-mentioned arithmetic device.
- the image evaluation device 30 may be a device that is installed in a specific location, or may be a device that can be carried by a user.
- the image evaluation device 30 includes an input interface 31, a processor 32, and an output interface 33.
- the input interface 31 is configured as a hardware interface that accepts image data IM from the input device 40.
- the image data IM corresponds to an ultrasound image that captures the subject's pelvic region.
- the input device 40 may be an ultrasound probe that is placed against the subject's body, or a device that visualizes ultrasound images.
- the image data IM may be in the form of analog data or digital data, depending on the specifications of the input device 40.
- the input interface 31 is equipped with an appropriate conversion circuit including an A/D converter.
- the processor 32 is configured to execute each of the processes described with reference to FIG. 3 based on the image data IM received by the input interface 31.
- the processor 32 having such functions may be realized by a general-purpose microprocessor that operates in cooperation with a general-purpose memory.
- Examples of the general-purpose microprocessor include a CPU, an MPU, and a GPU.
- Examples of the general-purpose memory include a ROM and a RAM.
- a computer program for implementing the function may be stored in the ROM.
- the general-purpose microprocessor specifies at least a portion of the program stored in the ROM, expands it on the RAM, and executes the above-mentioned processes in cooperation with the RAM.
- the general-purpose memory is an example of a non-transitory computer-readable medium in which a computer program is stored.
- Processor 32 may be realized by a dedicated integrated circuit such as a microcontroller, ASIC, or FPGA that includes a storage element in which a computer program for implementing the function is pre-installed.
- the storage element is an example of a non-transitory computer-readable medium in which a computer program is stored.
- Processor 32 may be realized by a combination of a general-purpose microprocessor and a dedicated integrated circuit.
- the output interface 33 is configured as a hardware interface that outputs the result data RS generated by the processor 32 to the output device 50.
- Examples of the output device 50 include a display device, a speaker, a printer, and a data transmission device.
- the output device 50 may be a part of the image evaluation device 30, or may be a device independent of the image evaluation device 30.
- the result data RS may be in the form of analog data or digital data, depending on the specifications of the output device 50. When the result data RS is in the form of analog data, the output interface 33 is provided with an appropriate conversion circuit including a D/A converter.
- index values associated with at least one of the subject's lower urinary tract function and pelvic floor function are not limited to the angle of the bladder neck, the distance between the pubic margin and the anorectal angle, and the angle of the bulbar urethra.
- Other index values may also be calculated as long as they can be identified based on an ultrasound image that captures the organs contained in the subject's pelvic region and are associated with at least one of the lower urinary tract function and pelvic floor function.
- organs include the bladder, uterus, urethra, and vagina.
- index values include the distance traveled by the bladder neck and the contraction rate of the levator hiatus area.
Landscapes
- Engineering & Computer Science (AREA)
- Health & Medical Sciences (AREA)
- Life Sciences & Earth Sciences (AREA)
- Physics & Mathematics (AREA)
- General Health & Medical Sciences (AREA)
- Theoretical Computer Science (AREA)
- Nuclear Medicine, Radiotherapy & Molecular Imaging (AREA)
- Radiology & Medical Imaging (AREA)
- General Physics & Mathematics (AREA)
- Computer Vision & Pattern Recognition (AREA)
- Medical Informatics (AREA)
- Pathology (AREA)
- Surgery (AREA)
- Animal Behavior & Ethology (AREA)
- Molecular Biology (AREA)
- Public Health (AREA)
- Veterinary Medicine (AREA)
- Heart & Thoracic Surgery (AREA)
- Biomedical Technology (AREA)
- Biophysics (AREA)
- Quality & Reliability (AREA)
- Ultra Sonic Daignosis Equipment (AREA)
Abstract
Description
対象者の骨盤領域が映り込んだ超音波画像に対応する画像データを取得し、
前記画像データに画像処理を適用することにより、所定の部位に係る複数の特徴点を抽出し、
前記複数の特徴点に基づいて下部尿路機能と骨盤底機能の少なくとも一方に関連づけられた指標値を算出する。
対象者の骨盤領域が映り込んだ超音波画像に対応する画像データを受け付けるインタフェースと、
前記画像データに画像処理を適用することにより、所定の部位に係る複数の特徴点を抽出し、かつ前記複数の特徴点に基づいて下部尿路機能と骨盤底機能の少なくとも一方に関連づけられた指標値を算出するプロセッサと、
を備えている。
実行されることにより、前記画像評価装置は、
対象者の骨盤領域が映り込んだ超音波画像に対応する画像データを受け付け、
前記画像データに画像処理を適用することにより、所定の部位に係る複数の特徴点を抽出し、
前記複数の特徴点に基づいて下部尿路機能と骨盤底機能の少なくとも一方に関連づけられた指標値を算出する。
Claims (11)
- 少なくとも一つの演算装置により実行される画像評価方法であって、
対象者の骨盤領域が映り込んだ超音波画像に対応する画像データを取得し、
前記画像データに画像処理を適用することにより、所定の部位に係る複数の特徴点を抽出し、
前記複数の特徴点に基づいて下部尿路機能と骨盤底機能の少なくとも一方に関連づけられた指標値を算出する、
画像評価方法。 - 前記複数の特徴点の各々は、膀胱頸部の一部に対応しており、
前記指標値は、膀胱頸部の角度に対応している、
請求項1に記載の画像評価方法。 - 前記複数の特徴点の各々は、前記画像処理により抽出された直線の一部であり、当該直線の勾配に注目したクラスタリングが実行される、
請求項2に記載の画像評価方法。 - 前記複数の特徴点は、恥骨下縁と肛門直腸角に対応しており、
前記指標値は、前記恥骨下縁と前記肛門直腸角の距離と当該距離の経時変化の少なくとも一方に対応している、
請求項1に記載の画像評価方法。 - 前記指標値は、前記複数の特徴点に対して画像追跡技術を適用することにより算出される、
請求項4に記載の画像評価方法。 - 前記指標値に基づいて前記対象者の下部尿路機能と骨盤底機能の少なくとも一方の低下に係る重症度の推定を行ない、
前記推定の結果に対応するデータを出力する、
請求項1から5のいずれか一項に記載の画像評価方法。 - 前記指標値に基づいて前記対象者に適した骨盤底筋トレーニング方法の選択を行ない、
前記選択の結果に対応するデータを出力する、
請求項1から6のいずれか一項に記載の画像評価方法。 - 複数の時点における前記指標値の比較を行ない、
前記比較の結果に対応するデータを出力する、
請求項1から7のいずれか一項に記載の画像評価方法。 - 対象者の骨盤領域が映り込んだ超音波画像に対応する画像データを受け付けるインタフェースと、
前記画像データに画像処理を適用することにより、所定の部位に係る複数の特徴点を抽出し、かつ前記複数の特徴点に基づいて下部尿路機能と骨盤底機能の少なくとも一方に関連づけられた指標値を算出するプロセッサと、
を備えている、
画像評価装置。 - 画像評価装置に搭載されたプロセッサにより実行可能なコンピュータプログラムであって、
実行されることにより、前記画像評価装置は、
対象者の骨盤領域が映り込んだ超音波画像に対応する画像データを受け付け、
前記画像データに画像処理を適用することにより、所定の部位に係る複数の特徴点を抽出し、
前記複数の特徴点に基づいて下部尿路機能と骨盤底機能の少なくとも一方に関連づけられた指標値を算出する、
コンピュータプログラム。 - 請求項10に記載のコンピュータプログラムが記憶された非一時的なコンピュータ可読媒体。
Priority Applications (3)
| Application Number | Priority Date | Filing Date | Title |
|---|---|---|---|
| EP24815627.5A EP4721676A1 (en) | 2023-05-31 | 2024-05-31 | Image evaluation method, image evaluation device, computer program, and non-transitory computer-readable medium |
| CN202480023085.7A CN120957665A (zh) | 2023-05-31 | 2024-05-31 | 图像评价方法、图像评价装置、计算机程序以及非暂时性的计算机可读介质 |
| JP2025524919A JPWO2024248147A1 (ja) | 2023-05-31 | 2024-05-31 |
Applications Claiming Priority (2)
| Application Number | Priority Date | Filing Date | Title |
|---|---|---|---|
| JP2023-090404 | 2023-05-31 | ||
| JP2023090404 | 2023-05-31 |
Publications (1)
| Publication Number | Publication Date |
|---|---|
| WO2024248147A1 true WO2024248147A1 (ja) | 2024-12-05 |
Family
ID=93657623
Family Applications (1)
| Application Number | Title | Priority Date | Filing Date |
|---|---|---|---|
| PCT/JP2024/020089 Ceased WO2024248147A1 (ja) | 2023-05-31 | 2024-05-31 | 画像評価方法、画像評価装置、コンピュータプログラム、および非一時的なコンピュータ可読媒体 |
Country Status (4)
| Country | Link |
|---|---|
| EP (1) | EP4721676A1 (ja) |
| JP (1) | JPWO2024248147A1 (ja) |
| CN (1) | CN120957665A (ja) |
| WO (1) | WO2024248147A1 (ja) |
Citations (7)
| Publication number | Priority date | Publication date | Assignee | Title |
|---|---|---|---|---|
| JP2018504185A (ja) | 2014-12-25 | 2018-02-15 | プルセンモア リミテッド | 人または動物の内臓器官の監視装置およびシステム |
| US20180268259A1 (en) * | 2017-03-14 | 2018-09-20 | Clarius Mobile Health Corp. | Systems and methods for identifying an imaged needle in an ultrasound image |
| US20200383658A1 (en) * | 2017-01-16 | 2020-12-10 | Shenzhen Mindray Bio-Medical Electronics Co., Ltd. | Method for measuring parameters in ultrasonic image and ultrasonic imaging system |
| JP2022120842A (ja) * | 2021-02-05 | 2022-08-18 | Stork Visit株式会社 | エコー画像観察記録プログラム、エコー画像観察記録装置、及びエコー画像観察記録ネットワークシステム |
| CN115212529A (zh) * | 2022-07-27 | 2022-10-21 | 凉山彝族自治州第一人民医院(凉山州传染病医院) | 一种盆底肌群训练监控和评估方法及系统 |
| JP2023090404A (ja) | 2021-12-17 | 2023-06-29 | 東京応化工業株式会社 | ワニス組成物、ワニス組成物の製造方法、及びポリイミド樹脂の製造方法 |
| WO2024073550A2 (en) * | 2022-09-28 | 2024-04-04 | Altyx Surgical Inc. | Systems and methods for diagnosing rectal support defects |
Family Cites Families (1)
| Publication number | Priority date | Publication date | Assignee | Title |
|---|---|---|---|---|
| US12295732B2 (en) * | 2018-10-30 | 2025-05-13 | Axena Health, Inc. | Devices, systems, and methods for monitoring bladder function |
-
2024
- 2024-05-31 EP EP24815627.5A patent/EP4721676A1/en active Pending
- 2024-05-31 CN CN202480023085.7A patent/CN120957665A/zh active Pending
- 2024-05-31 JP JP2025524919A patent/JPWO2024248147A1/ja active Pending
- 2024-05-31 WO PCT/JP2024/020089 patent/WO2024248147A1/ja not_active Ceased
Patent Citations (7)
| Publication number | Priority date | Publication date | Assignee | Title |
|---|---|---|---|---|
| JP2018504185A (ja) | 2014-12-25 | 2018-02-15 | プルセンモア リミテッド | 人または動物の内臓器官の監視装置およびシステム |
| US20200383658A1 (en) * | 2017-01-16 | 2020-12-10 | Shenzhen Mindray Bio-Medical Electronics Co., Ltd. | Method for measuring parameters in ultrasonic image and ultrasonic imaging system |
| US20180268259A1 (en) * | 2017-03-14 | 2018-09-20 | Clarius Mobile Health Corp. | Systems and methods for identifying an imaged needle in an ultrasound image |
| JP2022120842A (ja) * | 2021-02-05 | 2022-08-18 | Stork Visit株式会社 | エコー画像観察記録プログラム、エコー画像観察記録装置、及びエコー画像観察記録ネットワークシステム |
| JP2023090404A (ja) | 2021-12-17 | 2023-06-29 | 東京応化工業株式会社 | ワニス組成物、ワニス組成物の製造方法、及びポリイミド樹脂の製造方法 |
| CN115212529A (zh) * | 2022-07-27 | 2022-10-21 | 凉山彝族自治州第一人民医院(凉山州传染病医院) | 一种盆底肌群训练监控和评估方法及系统 |
| WO2024073550A2 (en) * | 2022-09-28 | 2024-04-04 | Altyx Surgical Inc. | Systems and methods for diagnosing rectal support defects |
Non-Patent Citations (2)
| Title |
|---|
| SAITO HARUNA, KAHAER DANNIYAER, KENTA KUWANA, MATSUNAGA AKIKO, KAWAJIRI MAIKO, TAKEISHI YOKO, NAKAMURA YASUKA, TOYOKO YOSHIZAWA, Y: "Development of a method using transperineal ultrasound movies for automatic evaluation of the contraction of pelvic floor muscles in men after radical prostatectomy", JOURNAL OF NURSING SCIENCE AND ENGINEERING, vol. 9, 19 January 2022 (2022-01-19), pages 242 - 252, XP093244578, ISSN: 2188-4323, DOI: 10.24462/jnse.9.0_242 * |
| See also references of EP4721676A1 |
Also Published As
| Publication number | Publication date |
|---|---|
| EP4721676A1 (en) | 2026-04-08 |
| CN120957665A (zh) | 2025-11-14 |
| JPWO2024248147A1 (ja) | 2024-12-05 |
Similar Documents
| Publication | Publication Date | Title |
|---|---|---|
| JP5576782B2 (ja) | 画像処理装置、画像処理方法、及び画像処理プログラム | |
| CN112716446B (zh) | 高血压性视网膜病变的病变特征的测量方法及测量系统 | |
| CN102113897B (zh) | 一种在图像中提取及测量感兴趣目标的方法及其装置 | |
| CN105678746B (zh) | 一种医学图像中肝脏范围的定位方法及装置 | |
| JP6853419B2 (ja) | 情報処理装置、情報処理方法、コンピュータプログラム | |
| CN116503392B (zh) | 一种用于卵巢组织分析的卵泡区域分割方法 | |
| JP5851160B2 (ja) | 画像処理装置、画像処理装置の作動方法、及び画像処理プログラム | |
| CN107578413B (zh) | 视网膜图像分层的方法、装置、设备及可读存储介质 | |
| JP6578058B2 (ja) | 画像処理装置、画像処理装置の作動方法及び画像処理装置の作動プログラム | |
| CN106408566B (zh) | 一种胎儿超声图像质量控制方法及系统 | |
| CN114757953B (zh) | 医学超声图像识别方法、设备及存储介质 | |
| Sindhwani et al. | Semi‐automatic outlining of levator hiatus | |
| JP6734475B2 (ja) | 画像処理装置及びプログラム | |
| CN117422628B (zh) | 一种心脏血管超声检查数据优化增强方法 | |
| JP2008194239A (ja) | 画像処理装置及びその方法 | |
| WO2020001236A1 (zh) | 提取医学图像标注的方法及装置 | |
| CN111557692B (zh) | 目标器官组织的自动测量方法、超声测量装置及介质 | |
| CN111820948A (zh) | 胎儿生长参数测量方法、系统及超声设备 | |
| CN106446805B (zh) | 一种眼底照中视杯的分割方法及系统 | |
| JP4717585B2 (ja) | 医用画像判定装置、医用画像判定方法およびそのプログラム | |
| WO2024248147A1 (ja) | 画像評価方法、画像評価装置、コンピュータプログラム、および非一時的なコンピュータ可読媒体 | |
| CN103208114A (zh) | 基于交互式分割的胃部脂肪组织提取方法 | |
| CN116993764B (zh) | 一种胃部ct智能分割提取方法 | |
| CN119693280A (zh) | 一种神经内镜的图像去雾方法、装置及系统 | |
| CN119251192A (zh) | 一种超声影像的图像特征提取方法、装置、设备及介质 |
Legal Events
| Date | Code | Title | Description |
|---|---|---|---|
| 121 | Ep: the epo has been informed by wipo that ep was designated in this application |
Ref document number: 24815627 Country of ref document: EP Kind code of ref document: A1 |
|
| ENP | Entry into the national phase |
Ref document number: 2025524919 Country of ref document: JP Kind code of ref document: A |
|
| WWE | Wipo information: entry into national phase |
Ref document number: 2025524919 Country of ref document: JP |
|
| NENP | Non-entry into the national phase |
Ref country code: DE |
|
| WWE | Wipo information: entry into national phase |
Ref document number: 2024815627 Country of ref document: EP |
|
| ENP | Entry into the national phase |
Ref document number: 2024815627 Country of ref document: EP Effective date: 20260102 |
|
| ENP | Entry into the national phase |
Ref document number: 2024815627 Country of ref document: EP Effective date: 20260102 |
|
| ENP | Entry into the national phase |
Ref document number: 2024815627 Country of ref document: EP Effective date: 20260102 |
|
| ENP | Entry into the national phase |
Ref document number: 2024815627 Country of ref document: EP Effective date: 20260102 |
|
| ENP | Entry into the national phase |
Ref document number: 2024815627 Country of ref document: EP Effective date: 20260102 |
|
| ENP | Entry into the national phase |
Ref document number: 2024815627 Country of ref document: EP Effective date: 20260102 |
|
| WWP | Wipo information: published in national office |
Ref document number: 2024815627 Country of ref document: EP |