CN101915744B - Near infrared spectrum nondestructive testing method and device for material component content - Google Patents
Near infrared spectrum nondestructive testing method and device for material component content Download PDFInfo
- Publication number
- CN101915744B CN101915744B CN 201010218291 CN201010218291A CN101915744B CN 101915744 B CN101915744 B CN 101915744B CN 201010218291 CN201010218291 CN 201010218291 CN 201010218291 A CN201010218291 A CN 201010218291A CN 101915744 B CN101915744 B CN 101915744B
- Authority
- CN
- China
- Prior art keywords
- sample
- kernel function
- correction
- subunit
- spectrum
- Prior art date
- Legal status (The legal status is an assumption and is not a legal conclusion. Google has not performed a legal analysis and makes no representation as to the accuracy of the status listed.)
- Expired - Fee Related
Links
Images


Landscapes
- Investigating Or Analysing Materials By Optical Means (AREA)
Abstract
本发明公开一种物质成分含量的近红外光谱无损检测方法及装置,利用其装置,通过采用光谱仪采集校正集样本、对光谱进行预处理、通过样本优选选择最优的校正样本集、和利用最优的校正样本集建立非线性校正模型等步骤,然后利用光谱仪采集未知成分含量的光谱样本,经与校正集样本相同的光谱预处理,通过已建非线性校正模型检测该未知样本的成分含量。采用本发明提供的方法和装置,能够有效解决现有物质成分含量的近红外无损检测方法中校正模型复杂、训练速度慢、不易于硬件实现的问题,并能显著提高物质成分含量无损检测结果的精度及稳定性。
The invention discloses a near-infrared spectrum non-destructive detection method and device for the content of material components. Using the device, a spectrometer is used to collect a calibration set sample, preprocess the spectrum, select the optimal calibration sample set through sample optimization, and use the optimal calibration sample set. The optimal calibration sample set establishes a nonlinear calibration model and other steps, and then uses a spectrometer to collect a spectral sample with an unknown component content, undergoes the same spectral pretreatment as the calibration set sample, and detects the component content of the unknown sample through the established nonlinear calibration model. The method and device provided by the present invention can effectively solve the problems of complex calibration models, slow training speed, and difficulty in hardware implementation in the existing near-infrared nondestructive testing method for material component content, and can significantly improve the accuracy of material component content nondestructive test results. Accuracy and stability.
Description
技术领域 technical field
本发明涉及近红外光谱分析技术,尤其涉及一种物质成分含量的近红外光谱无损检测方法及装置。The invention relates to a near-infrared spectrum analysis technology, in particular to a near-infrared spectrum non-destructive detection method and device for the content of material components.
背景技术 Background technique
近红外光谱检测技术具有无损伤、无污染、实时快速测定物质成分浓度(或者性质参数)的特点,因此被广泛应用于农业、生物医学、化工等领域。虽然近红外光谱能携带丰富的物质分子结构信息,且容易获取和被处理,可用来分析绝大多数种类的化合物及其混合物的成份浓度(或者性质参数),但是,近红外光谱信息强度比中红外谱区低、谱峰宽,样品近红外光谱的有效信息率低。对复杂样品进行近红外光谱分析即是要从复杂、重叠、变动的光谱中提取微弱信息。而随着高性能光谱仪器及基础测试技术的不断完善,基于化学计量学的近红外光谱微弱信息提取方法研究,则成为了近红外光谱无损检测物质成分浓度(或者性质参数)的关键点之一,它决定着近红外光谱检测技术的最终应用与前景。Near-infrared spectroscopy detection technology has the characteristics of non-destructive, non-polluting, real-time and rapid determination of the concentration of substance components (or property parameters), so it is widely used in agriculture, biomedicine, chemical industry and other fields. Although near-infrared spectroscopy can carry a wealth of molecular structure information, and is easy to obtain and be processed, it can be used to analyze the component concentrations (or property parameters) of most types of compounds and their mixtures. The infrared spectrum area is low, the spectral peak is wide, and the effective information rate of the sample near infrared spectrum is low. The near-infrared spectroscopy analysis of complex samples is to extract weak information from complex, overlapping and changing spectra. With the continuous improvement of high-performance spectroscopic instruments and basic testing technologies, the research on the method of extracting weak information from near-infrared spectroscopy based on chemometrics has become one of the key points in the non-destructive detection of substance concentration (or property parameters) by near-infrared spectroscopy. , which determines the final application and prospect of near-infrared spectroscopy detection technology.
多元校正是一种重要的化学计量学方法,多元校正是近红外光谱检测技术中的一个关键步骤,用于建立在已知物质成分浓度(或性质参数)与光谱之间的关联关系,利用该关系,可用于后续预测未知样品的物质成分浓度(或性质参数),高精度多元校正模型的建立可使得物质成分含量的近红外光谱无损检测的结果更精确。Multivariate correction is an important chemometrics method. Multivariate correction is a key step in near-infrared spectroscopy detection technology. relationship, which can be used to subsequently predict the concentration (or property parameters) of unknown samples. The establishment of a high-precision multivariate calibration model can make the results of non-destructive testing of near-infrared spectroscopy more accurate.
多元校正方法可分为线性和非线性两大类。线性校正方法如多元线性回归、主成分回归、偏最小二乘回归等,其理论性质易于讨论,常常能比较好的解决问题。然而,随着人们对事物认识能力的提高,对于复杂样品,多组分混合物分析体系中各组分的相互作用、仪器的基线漂移等,致使吸收光谱偏离朗伯-比耳定律,呈现非线性的特质,为了建立预测准确性好和稳健性强的近红外光谱分析多元校正模型,非线性建模方法的研究越来越引起人们的关注。目前常见的非线性校正方法有非线性偏最小二乘法、人工神经网络等。基于样条变换、多项式拟合等的非线性偏最小二乘法,选择恰当的参数能很好的拟合非线性关系,但是仍然不能解决模型的复杂性问题;人工神经网络是一种智能的非线性多元校正方法,具有很强的非线性建模能力,但也存在一些局限性,如模型和参数选择复杂、训练速度慢、容易陷入极小点、过拟合等等。Multivariate correction methods can be divided into two categories: linear and nonlinear. Linear correction methods, such as multiple linear regression, principal component regression, partial least squares regression, etc., have theoretical properties that are easy to discuss and can often solve problems better. However, with the improvement of people's ability to understand things, for complex samples, the interaction of components in the multi-component mixture analysis system, the baseline drift of the instrument, etc., cause the absorption spectrum to deviate from the Lambert-Beer law and present a nonlinear In order to establish a multivariate correction model for near-infrared spectroscopy with good prediction accuracy and robustness, research on nonlinear modeling methods has attracted more and more attention. At present, the common nonlinear correction methods include nonlinear partial least squares method, artificial neural network and so on. Based on the nonlinear partial least squares method such as spline transformation and polynomial fitting, choosing appropriate parameters can fit the nonlinear relationship well, but it still cannot solve the complexity of the model; the artificial neural network is an intelligent non-linear The linear multivariate correction method has a strong nonlinear modeling ability, but it also has some limitations, such as complex model and parameter selection, slow training speed, easy to fall into the minimum point, overfitting and so on.
另外,校正集样本是建立多元校正模型的基础,多元校正即是根据已知的一定数量的校正集样本的光谱和标准方法测得的该校正集样本的物质成分浓度(或性质参数)建立关联关系。由于样本化学组成复杂,且样本信息包含在相似性很强的高维光谱中,校正集样本的合理筛选对提高模型预测精度至关重要。通常要求校正集样本应具有范围宽、分布均匀、精度高、典型性的特点,选择特征信息丰富、尽量少干扰的足够数量的校正集样本是模型准确的前提,决定了模型的适应性和可靠性。In addition, the calibration set sample is the basis for establishing a multivariate calibration model. Multivariate calibration is to establish a relationship based on the spectra of a certain number of calibration set samples known and the concentration of the material components (or property parameters) of the calibration set sample measured by the standard method. relation. Due to the complex chemical composition of samples, and the sample information is contained in high-dimensional spectra with strong similarities, reasonable screening of samples in the calibration set is crucial to improve the prediction accuracy of the model. It is usually required that the calibration set samples should have the characteristics of wide range, uniform distribution, high precision, and typicality. Selecting a sufficient number of calibration set samples with rich feature information and minimal interference is the premise of the accuracy of the model, which determines the adaptability and reliability of the model. sex.
目前常用的校正集样本优选方法有:随机法;基于同类就近选择样本的光谱欧氏距离算法;根据样本光谱之间距离差异进行样本挑选的算法,如Kennard-Stone法等。随机法选取样本完全是随意的,没有任何规律,或者仅遵循简单的规则,通过该方法每次组成校正集的样本可能差异很大,不能保证所选样本代表性及模型的外推能力。同类就近选择样本的建模方法只能降低非线性的校正误差,无法发现除去光谱特征异常样本干扰,往往不够可靠和精确。Kennard-Stone法的优点是能保证训练库中样本按照空间距离分布均匀,但是需要进行数据转换和计算样本两两空间距离,计算量大。At present, the commonly used calibration set sample selection methods include: random method; spectral Euclidean distance algorithm based on the selection of samples of the same kind; algorithm for sample selection based on the distance difference between sample spectra, such as the Kennard-Stone method, etc. The selection of samples by the random method is completely random, without any rules, or only follows simple rules. The samples that make up the calibration set through this method may vary greatly each time, and the representativeness of the selected samples and the extrapolation ability of the model cannot be guaranteed. The modeling method of selecting the nearest sample of the same kind can only reduce the nonlinear correction error, and cannot find and remove the interference of samples with abnormal spectral characteristics, which is often not reliable and accurate enough. The advantage of the Kennard-Stone method is that it can ensure that the samples in the training database are evenly distributed according to the spatial distance, but it needs to perform data conversion and calculate the pairwise spatial distance of the samples, which requires a large amount of calculation.
综上所述,利用常用的非线性多元校正方法和校正集样本优选方法的近红外光谱检测技术,均存在模型复杂、计算量大的问题,以及还存在物质成分含量近红外光谱无损检测中校正模型的训练速度慢、不易于硬件实现等缺陷;且采用现有非线性校正模型不适用于小样本建模、容易产生过拟合,影响了物质成分含量近红外光谱无损检测结果的精度。另外,因离线训练的校正模型复杂,通常的物质成分含量的近红外光谱无损检测装置硬件中写入的校正模型固定,这对于成分特别复杂的被测对象的物质成分含量的检测的适用性不佳。To sum up, the near-infrared spectroscopy detection technology using the commonly used nonlinear multivariate calibration method and the calibration set sample selection method has the problems of complex models, large amount of calculation, and the correction of material composition in the near-infrared spectroscopy non-destructive testing. The training speed of the model is slow, and it is not easy to realize the hardware; and the existing nonlinear correction model is not suitable for small sample modeling, and it is prone to overfitting, which affects the accuracy of the non-destructive testing results of near-infrared spectroscopy for material composition. In addition, due to the complexity of the correction model for off-line training, the correction model written in the hardware of the near-infrared spectroscopy non-destructive testing device for the usual material composition content is fixed, which is not suitable for the detection of the material composition content of the object with particularly complex components. good.
发明内容 Contents of the invention
有鉴于此,本发明的主要目的在于提供一种简单、快速、高效的物质成分含量的近红外光谱无损检测方法及装置,本发明提供的方法简洁,便于近红外光谱无损检测技术中的硬件实现,根据被测对象情况调节模型及其参数,能提高物质成分含量检测结果的精度和适用性。In view of this, the main purpose of the present invention is to provide a simple, fast and efficient near-infrared spectrum non-destructive detection method and device for the content of material components. The method provided by the present invention is simple and convenient for hardware implementation in the near-infrared spectrum non-destructive detection technology , adjusting the model and its parameters according to the measured object can improve the accuracy and applicability of the detection results of the substance composition content.
本发明的另一个目的在于提供一种校正集样本优选方法,通过基于自模型混合物分析的技术,消除含重复信息或无用信息的样本,从而解决样本间共线性的技术问题,从而选出少数的具有代表性样本,用于建立多元校正模型,可达到简化训练过程、提高建模速度、降低模型复杂性以便于近红外光谱无损检测过程中的硬件实现和提高物质成分含量近红外无损检测结果的精度的技术效果。Another object of the present invention is to provide a calibration set sample optimization method, which eliminates samples containing repeated information or useless information through the technology based on self-model mixture analysis, thereby solving the technical problem of collinearity between samples, thereby selecting a few Representative samples are used to establish a multivariate calibration model, which can simplify the training process, increase the modeling speed, reduce the complexity of the model, facilitate the hardware implementation in the process of non-destructive testing of near-infrared spectroscopy, and improve the results of near-infrared non-destructive testing of material composition The technical effect of precision.
为达到上述目的,本发明的技术方案是这样实现的:In order to achieve the above object, technical solution of the present invention is achieved in that way:
一种物质成分含量的近红外光谱无损检测方法,该检测方法包括:A near-infrared spectroscopy non-destructive detection method for the content of material components, the detection method comprising:
A、利用近红外光谱仪采集大量被测样品的近红外光谱数据,构成校正样本集;A. Use a near-infrared spectrometer to collect near-infrared spectral data of a large number of samples to be tested to form a calibration sample set;
B、采用标准分析方法测定校正样本集中样本待测组分的化学含量的真值;B. Using standard analytical methods to determine the true value of the chemical content of the components to be tested in the calibration sample set;
C、对所述近红外光谱数据进行预处理,以去除噪声、基线或其他干扰待测物质成分信息的无用信号;C. Preprocessing the near-infrared spectral data to remove noise, baseline or other useless signals that interfere with the composition information of the substance to be measured;
D、对上述经预处理后的校正集样本的光谱数据进行基于自模型混合物分析的校正集样本优选;D. Optimizing the calibration set samples based on the self-model mixture analysis for the spectral data of the above-mentioned preprocessed calibration set samples;
E、用优选出的校正样本集建立基于核函数变换的非线性偏最小二乘校正模型;E. Establish a nonlinear partial least squares correction model based on kernel function transformation with the optimized correction sample set;
F、用所构造的基于核函数变换的非线性偏最小二乘校正模型,检测未知样本的物质成分含量。F. Use the constructed nonlinear partial least squares correction model based on kernel function transformation to detect the content of the material components of the unknown sample.
其中,步骤C所述对所述近红外光谱数据进行预处理,进一步包括小波变换过程,包括:Wherein, the preprocessing of the near-infrared spectral data described in step C further includes a wavelet transform process, including:
C1、选择小波基和小波分解层数,将光谱矩阵X的每条信号进行小波分解;其中光谱矩阵X的每一行中各元素代表一个样本在各个波长下的吸光度值;C1, select the wavelet base and the number of wavelet decomposition layers, and perform wavelet decomposition on each signal of the spectral matrix X; wherein each element in each row of the spectral matrix X represents the absorbance value of a sample at each wavelength;
C2、对光谱信号在小波域内的低频段小波系数置零来实现基线校正,利用较高频段小波系数阈值处理来实现噪声去除;C2. Set the low-frequency wavelet coefficients of the spectral signal in the wavelet domain to zero to realize baseline correction, and use higher-frequency wavelet coefficient threshold processing to realize noise removal;
C3、用分解后去噪和基线校正后的第N层低频和高频系数进行信号重构,重构的各条光谱信号组成新的光谱矩阵Xnew。C3. Perform signal reconstruction by using the denoised and baseline-corrected low-frequency and high-frequency coefficients of the Nth layer, and each reconstructed spectral signal forms a new spectral matrix X new .
类似地,步骤C所述对所述近红外光谱数据进行预处理,进一步包括微分处理过程,具体为:选择微分窗口宽度g及微分阶次;并对所述光谱数据进行一阶微分去除与波长无关的漂移,或进一步进行二阶微分处理去除与波长相关的漂移。Similarly, the preprocessing of the near-infrared spectral data described in step C further includes a differential processing process, specifically: selecting the differential window width g and differential order; and performing first-order differential removal and wavelength on the spectral data irrelevant drift, or further second-order differential processing to remove wavelength-dependent drift.
其中,步骤D所述的基于自模型混合物分析的校正集样本优选方法,包括:Wherein, the calibration set sample optimization method based on self-model mixture analysis described in step D includes:
D1、将光谱矩阵Xnew进行转置得到X′new,则X′new矩阵每一列各元素代表一个样本在各个波长下的吸光度值;D1. Transpose the spectral matrix X new to obtain X'new , then each element in each column of the X'new matrix represents the absorbance value of a sample at each wavelength;
D2、计算光谱矩阵X′new中各列向量即样本i的纯度值pi,1,其计算公式为:D2. Calculating each column vector in the spectral matrix X' new , i.e. the purity value p i, 1 of the sample i, the calculation formula is:
pi,1=σi/(μi+α)p i,1 = σ i /(μ i +α)
其中,μi为均值、σi为标准差、α为补偿因子;Among them, μ i is the mean value, σ i is the standard deviation, and α is the compensation factor;
D3、根据步骤D2求得的各列向量i的pi,1值,判断pi,1值的大小,将具有最大pi,1值的第i个列向量作为选出的第一个样本;D3. According to the p i, 1 value of each column vector i obtained in step D2, judge the size of p i, 1 value, and use the ith column vector with the largest p i, 1 value as the selected first sample ;
D4、选择第k(k≥2)个样本,具体为:根据下列公式计算矩阵X′new中列向量i的长度li, D4. Select the kth (k≥2) sample, specifically: calculate the length l i of the column vector i in the matrix X'new according to the following formula,
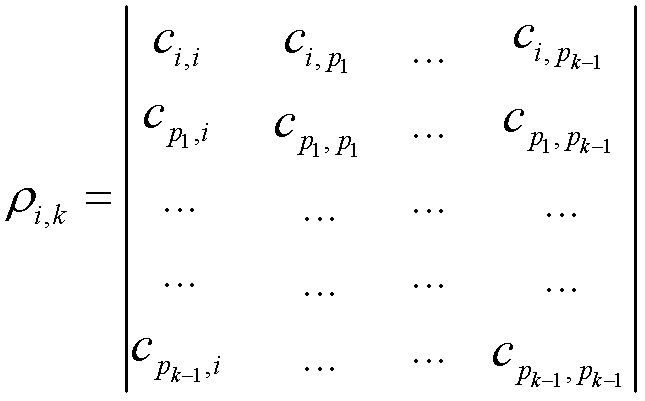
其中,di,j为光谱矩阵X′new中第i行第j列元素,由
其中,k表示待确定的第k个样本,pk-1表示目前已经选定了的第(k-1)个样本在C矩阵中所在列向量的标号,p1表示通过步骤D3已选择的第一个样本在C矩阵中所在列向量的标号;则纯度值pi,k为:Among them, k represents the kth sample to be determined, p k-1 represents the label of the column vector of the (k-1) sample that has been selected so far in the C matrix, and p1 represents the selected sample through step D3 The label of the column vector where the first sample is located in the C matrix; then the purity value p i,k is:
pi,k=ρi,k(σi/(μi+α));将具有最大pi,k值的第i个列向量作为选出的第k个样本;p i, k = ρ i, k (σ i /(μ i + α)); the i-th column vector with the largest p i, k value is used as the selected k-th sample;
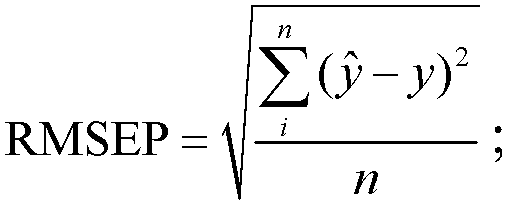
D5、重复上述步骤D4,并通过依次迭代选择的样本建立多元校正模型,交互验证评价模型的性能,将具有最小预测均方根误差(RMSEP,Root MeanSquare Error of Prediction)时选取的样本个数作为最优的样本个数,所述RMSEP计算公式为:D5. Repeat the above step D4, and establish a multivariate correction model by iteratively selecting samples in turn, and interactively verify and evaluate the performance of the model. The number of samples selected when having the minimum root mean square error (RMSEP, Root Mean Square Error of Prediction) is used as The optimal number of samples, the RMSEP calculation formula is:
其中,
D6、用优选出的一定个数的样本组成新的最优的校正样本集。D6. Using a certain number of optimized samples to form a new optimal calibration sample set.
步骤E所述建立基于核函数变换的非线性偏最小二乘校正模型,包括:Step E describes establishing a nonlinear partial least squares correction model based on kernel function transformation, including:
E1、确定初始参数,包括核函数及其参数、主成分个数;E1. Determine the initial parameters, including the kernel function and its parameters, and the number of principal components;
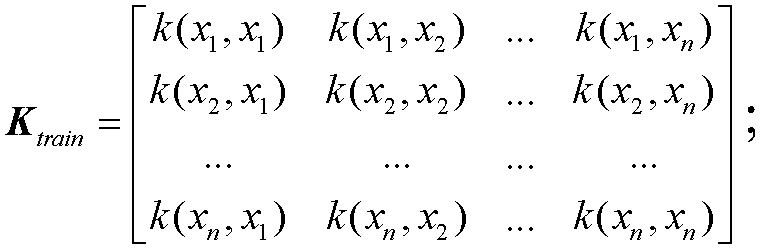
E2、对校正集的自变量进行核函数变换,然后进行中心化处理;其中,核函数变换公式为:
k(·,·)表示两个向量的内积;xi(i=1,...,n)表示校正集样本的光谱;核函数变换过程即是非线性处理过程,核函数变换之后的矩阵包含了非线性信息;中心化的公式为
E3、对经核函数变换后得到的矩阵


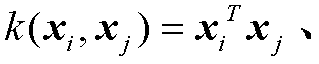
其中,所述核函数主要有协方差核、多项式核和高斯核;所述协方差核
其中,i、j分别表示第i、j个样本的光谱向量;p、q、σ分别为需根据实际情况确定的核参数。Among them, i and j represent the spectral vectors of the i and j samples respectively; p, q and σ are the kernel parameters that need to be determined according to the actual situation.
步骤F所述检测未知样本的物质成分含量的过程,包括:The process of detecting the substance content of the unknown sample described in step F includes:
F1、用光谱仪采集未知样本的光谱;F1. Collect the spectrum of the unknown sample with a spectrometer;
F2、对于未知样本的光谱,采用与校正集样本相同的预处理方法进行光谱处理,去除噪声、基线以及其他干扰物质成分信息的无用信息;F2. For the spectrum of the unknown sample, use the same preprocessing method as the calibration set sample for spectral processing to remove noise, baseline and other useless information that interferes with the composition information of the substance;
F3、对于经预处理后的未知样本的光谱进行核函数变换,然后进行中心化处理;未知样本的核函数变换公式为:F3. Carry out kernel function transformation for the spectrum of the unknown sample after preprocessing, and then perform centralized processing; the kernel function transformation formula of the unknown sample is:
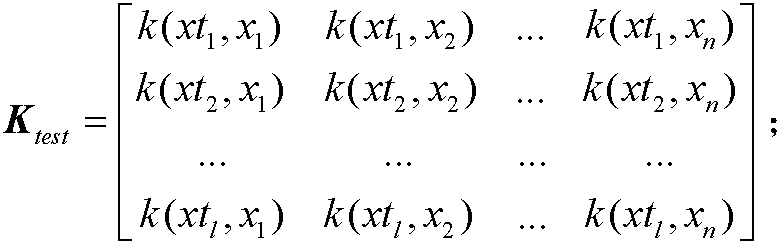
其中,xti(i=1,...,n)表示未知的样本的光谱;xi(i=1,...,n)表示校正集样本的光谱;中心化的公式为
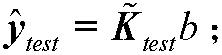
F4、通过已建好的模型获得未知样本的物质成分含量的预测值。计算公式为

一种实现权利要求1所述的物质成分含量的近红外光谱无损检测方法的物质成分含量的近红外光谱无损检测装置,该装置主要包括校正集样本优选单元100、模型建立单元200和预测值获取单元300:其中,A near-infrared spectrum non-destructive testing device for material component content of the near-infrared spectrum non-destructive testing method for material component content according to
校正集样本优选单元100,用于获取用于建立基于核函数变换的非线性偏最小二乘校正模型的最优的校正集样本;Correction set
模型建立单元200,用于建立基于核函数变换的非线性偏最小二乘校正模型;以及A
预测值获取单元300,用于得到所述的物质成分含量近红外光谱无损检测的结果。The predicted
其中,所述校正集样本优选单元100进一步包括:Wherein, the calibration set
校正集样本数据获取子单元110,用于获取大量已知样本的近红外连续光谱数据,以及与之相应的采用标准分析方法测得的校正样本集中样本待测组分的化学含量的真值,构成校正集样本;The calibration set sample data acquisition subunit 110 is used to acquire the near-infrared continuous spectrum data of a large number of known samples, and the corresponding true value of the chemical content of the sample to be measured in the calibration sample set measured by a standard analysis method, Constitute the calibration set samples;
校正集样本数据预处理子单元120,用于对所述校正集样本数据获取子单元110获取的所述校正集样本光谱数据进行预处理;以及A calibration set sample data preprocessing subunit 120, configured to preprocess the calibration set sample spectral data acquired by the calibration set sample data acquisition subunit 110; and
最优校正集样本获取子单元130,用于根据所述校正集样本数据预处理子单元120获取的预处理后的校正集样本光谱数据和所述校正集样本数据获取子单元110中获取的相应的真值,确定最优的一定数量的用于建立校正模型的样本并提供给所述模型建立单元200和预测值获取单元300。The optimal calibration set sample acquisition subunit 130 is configured to use the preprocessed calibration set sample spectral data acquired by the calibration set sample data preprocessing subunit 120 and the corresponding calibration set sample data acquired in the calibration set sample data acquisition subunit 110. The true value of , determine an optimal number of samples for establishing the calibration model and provide it to the
其中,所述模型建立单元200和预测值获取单元300进一步包括:Wherein, the
校正集样本核函数变换子单元210,用于对所述最优校正集样本获取子单元130得到的一定数量的最优校正集样本进行核函数变换,构成校正集样本的核函数变换后的矩阵;The calibration set sample kernel function transformation subunit 210 is used to perform kernel function transformation on a certain number of optimal calibration set samples obtained by the optimal calibration set sample acquisition subunit 130 to form a matrix after kernel function transformation of the calibration set samples ;
基于核函数变换的非线性偏最小二乘校正模型获取子单元220,用于对所述校正集样本核函数变换子单元210中得到的核函数变换后的矩阵建立非线性偏最小二乘校正模型,并将获得的回归系数提供给预测值获取单元300;以及The nonlinear partial least squares correction model acquisition subunit 220 based on kernel function transformation is used to establish a nonlinear partial least squares correction model for the matrix after kernel function transformation obtained in the correction set sample kernel function transformation subunit 210 , and provide the obtained regression coefficient to the predicted
所述预测值获取单元300进一步包括:The predicted
未知样本光谱数据获取子单元310,用于获取待测的未知成分含量的样本的近红外波段的连续光谱;The unknown sample spectral data acquisition subunit 310 is used to acquire the continuous spectrum in the near-infrared band of the sample with unknown component content to be tested;
未知样本光谱数据预处理子单元320,用于对所述未知样本光谱数据获取子单元310获取的未知样本数据进行预处理,所采用的预处理方法及其参数与所述校正集样本数据预处理子单元120所采用的相同;The unknown sample spectral data preprocessing subunit 320 is used to preprocess the unknown sample data acquired by the unknown sample spectral data acquisition subunit 310, the preprocessing method and its parameters adopted are the same as those of the calibration set sample data preprocessing The subunit 120 adopts the same;
未知样本核函数变换子单元330,利用所述最优校正集样本获取子单元130获得的最优的校正集样本,用于对所述未知样本光谱数据预处理子单元320获取的预处理后的未知样本光谱数据进行核函数变换,所采用的核函数及其参数与所述校正集样本核函数变换子单元210所采用的相同,构成未知样本的核函数变换后的矩阵;The unknown sample kernel function transformation subunit 330 uses the optimal calibration set sample obtained by the optimal calibration set sample acquisition subunit 130 to use the preprocessed spectral data acquired by the unknown sample spectral data preprocessing subunit 320 Carrying out kernel function transformation on the unknown sample spectral data, the adopted kernel function and its parameters are the same as those adopted by the correction set sample kernel function transformation subunit 210, forming a matrix after the kernel function transformation of the unknown sample;
预测值计算子单元340,用于根据所述基于核函数变换的非线性偏最小二乘校正模型获取子单元220得到的回归系数和所述未知样本核函数变换子单元330得到的未知样本的核变换后的矩阵,通过计算得到所述未知样本的被测物质成分含量的检测值。The predicted value calculation subunit 340 is used to obtain the regression coefficient obtained by the subunit 220 and the kernel of the unknown sample obtained by the unknown sample kernel function transformation subunit 330 according to the nonlinear partial least squares correction model based on kernel function transformation. The transformed matrix is calculated to obtain the detection value of the component content of the tested substance in the unknown sample.
本发明所提供的物质成分含量的近红外光谱无损检测方法及装置,具有以下优点:The near-infrared spectroscopy non-destructive detection method and device for the content of material components provided by the present invention have the following advantages:
本发明通过利用基于自模型混合物分析技术的校正集样本优选方法,仅选出少量的样本用于建立多元校正模型,可快速建立校正模型,达到提高近红外光谱无损检测技术中多元校正模型的建模效率的效果,同时由于样本优选使得模型的复杂性降低,从而还可达到便于近红外光谱无损检测过程中的硬件实现的技术效果;另外,若对于采集到的大量的校正集样本,由于本发明提出的样本优选方法可消除样本间的共线性问题,从而能选出少而精的、具有代表性的样本用于建立校正模型,能够用于提高物质成分含量近红外光谱无损检测结果的精度和可靠性。本发明方法采用基于核函数变换的方式建立的非线性校正模型,仅通过向量的内积完成非线性映射过程,其变换过程简单易实现,从而进一步简化了多元校正模型,降低了物质成分含量近红外光谱无损检测过程硬件实现的困难;仅通过核函数及其参数的选择,可应用于不同的待测量对象,因而本发明提供的方法具有广泛的适应性;另外,本发明所述的非线性校正模型具有适应于小样本、具有较好的泛化能力的特点,尤其适用于经校正集样本优选后的少量样本建模情况,能达到显著提高物质成分含量近红外光谱无损检测结果的精度的效果。The present invention uses the calibration set sample optimization method based on the self-model mixture analysis technology, only selects a small number of samples to establish a multivariate calibration model, and can quickly establish a calibration model to improve the establishment of a multivariate calibration model in the near-infrared spectrum non-destructive testing technology. At the same time, due to the optimization of samples, the complexity of the model is reduced, which can also achieve the technical effect of facilitating hardware implementation in the process of non-destructive testing of near-infrared spectroscopy; in addition, if a large number of calibration samples collected, due to the The sample optimization method proposed by the invention can eliminate the collinearity problem between samples, so that few but fine and representative samples can be selected for the establishment of calibration models, which can be used to improve the accuracy of non-destructive testing results of near-infrared spectroscopy for material composition content and reliability. The method of the present invention adopts a nonlinear correction model established based on kernel function transformation, and only completes the nonlinear mapping process through the inner product of vectors. The transformation process is simple and easy to implement, thereby further simplifying the multivariate correction model and reducing the content of material components Difficulties in the hardware implementation of the infrared spectrum non-destructive testing process; only through the selection of the kernel function and its parameters, it can be applied to different objects to be measured, so the method provided by the invention has wide adaptability; in addition, the nonlinear The calibration model has the characteristics of adapting to small samples and having good generalization ability. It is especially suitable for the modeling of a small number of samples after the calibration set samples are optimized, and can significantly improve the accuracy of the non-destructive testing results of near-infrared spectroscopy for material composition content. Effect.
附图说明 Description of drawings
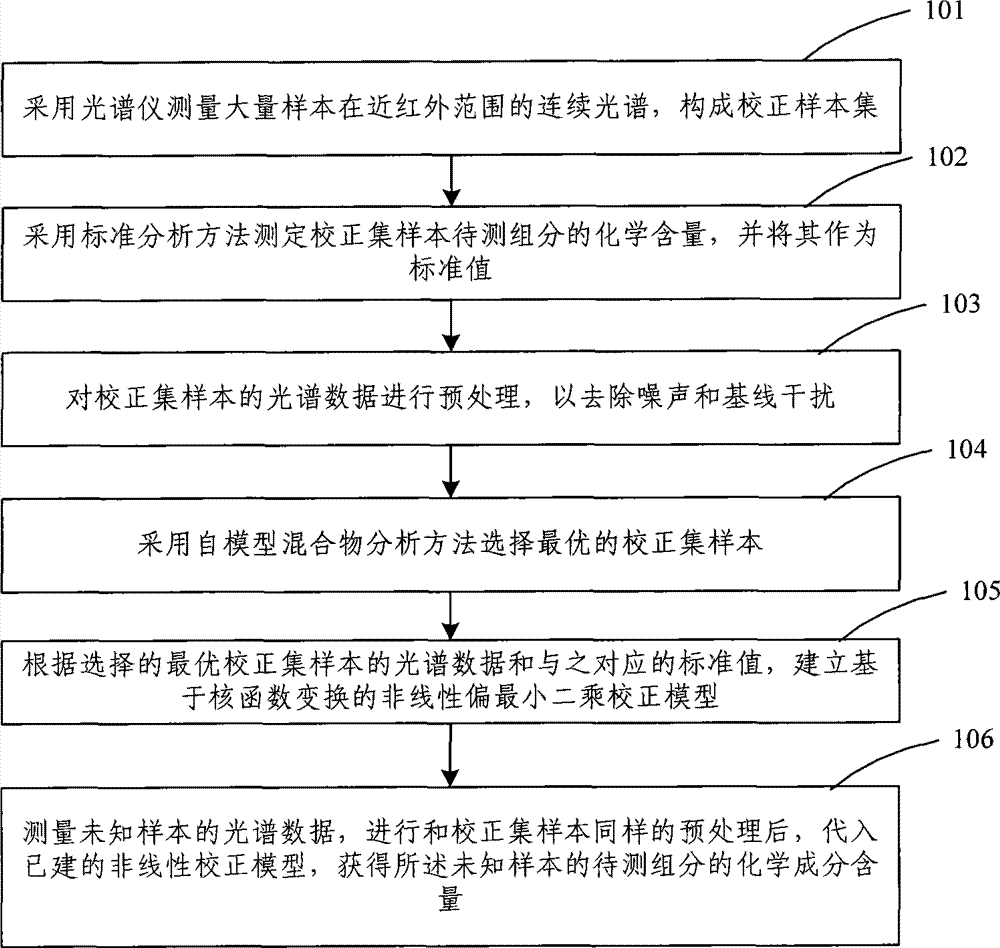
图1为本发明物质成分含量的近红外光谱无损检测方法流程图;Fig. 1 is the flow chart of the near-infrared spectrum non-destructive detection method of material component content of the present invention;
图2为采用本发明方法获取的原始近红外光谱示意图;Fig. 2 is the original near-infrared spectrum schematic diagram that adopts the method of the present invention to obtain;
图3为经微分预处理后得到的近红外光谱示意图;Figure 3 is a schematic diagram of the near-infrared spectrum obtained after differential pretreatment;
图4为基于自模型混合物分析的校正集样本优选方法通过最大纯度值选择第一个样本的示意图;Fig. 4 is a schematic diagram of selecting the first sample by the maximum purity value based on the calibration set sample optimization method of self-model mixture analysis;
图5为基于自模型混合物分析的校正集样本优选方法通过交互验证得到的预测均方根误差(RMSEP)确定最佳的校正集样本个数图;Fig. 5 is based on the calibration set sample optimization method of self-model mixture analysis and determines the optimal calibration set sample number figure by the prediction root mean square error (RMSEP) that cross-validation obtains;
图6为本发明校正集样本经核函数变换后的曲线图;Fig. 6 is a graph of the correction set samples of the present invention transformed by a kernel function;
图7为本发明采用优选出的校正集样本建立基于核函数变换的非线性偏最小二乘校正模型的回归系数曲线图;Fig. 7 is the regression coefficient graph of the nonlinear partial least squares correction model based on kernel function transformation established by the present invention using the optimized correction set samples;
图8为本发明所述的未知样本经核函数变换后的曲线图;Fig. 8 is the graph of the unknown sample of the present invention transformed by kernel function;
图9为采用本发明物质成分含量的近红外光谱无损检测方法用于预测未知样本得到的预测结果与参考值的相关性图;Fig. 9 is a correlation diagram between prediction results and reference values obtained by predicting unknown samples using the near-infrared spectroscopy non-destructive detection method of the substance composition content of the present invention;
图10为本发明物质成分含量的近红外光谱无损检测装置组成结构示意图。Fig. 10 is a schematic diagram of the composition and structure of the near-infrared spectroscopy non-destructive testing device for the content of the material components of the present invention.
具体实施方式 Detailed ways
下面结合附图及本发明的实施例对本发明的方法及装置作进一步详细的说明。The method and device of the present invention will be further described in detail below in conjunction with the accompanying drawings and embodiments of the present invention.
本发明的核心思想是:利用近红外光谱仪采集大量样品的光谱样本,构成校正样本集,通过预处理方法对校正样本集光谱进行预处理,以去除噪声和基线等无用信息,以改善光谱质量,提高光谱与被测物质成分含量之间的相关性;通过自模型混合物分析技术,从校正样本集中选取有代表性的少量样本的子集,构成最优的校正样本集,用于后续的非线性多元校正模型的建立,以提高建模效率、降低模型复杂性以及便于物质成分含量近红外光谱无损检测装置的硬件实现;采用优选出的校正样本集,建立基于核函数变换的非线性偏最小二乘校正模型,利用采集到的大量的校正集样本,通过选择最优的校正集样本,并根据实际被测对象情况选择预处理和校正模型及其参数,从而达到提高物质成分含量近红外无损检测结果的精度和适用性的目的。The core idea of the present invention is to use a near-infrared spectrometer to collect a large number of spectral samples of samples to form a calibration sample set, and to preprocess the spectrum of the calibration sample set by a preprocessing method to remove useless information such as noise and baseline, so as to improve the spectral quality. Improve the correlation between the spectrum and the content of the measured substance; through the self-model mixture analysis technology, select a representative subset of a small number of samples from the calibration sample set to form the optimal calibration sample set for subsequent nonlinear The establishment of a multivariate calibration model to improve modeling efficiency, reduce model complexity, and facilitate the hardware implementation of near-infrared spectroscopy nondestructive testing devices for material composition content; use the optimized calibration sample set to establish a nonlinear partial least squares model based on kernel function transformation Multiplying the calibration model, using a large number of calibration set samples collected, by selecting the optimal calibration set sample, and selecting the preprocessing and calibration model and its parameters according to the actual situation of the measured object, so as to improve the content of the material composition. Near-infrared non-destructive testing The precision and suitability of the results for purposes.
图1为本发明物质成分含量的近红外光谱无损检测方法流程图,如图1所示,该方法包括:Fig. 1 is the flow chart of the near-infrared spectrum non-destructive detection method of material component content of the present invention, as shown in Fig. 1, the method comprises:
步骤101、利用近红外光谱仪采集大量的被测样品的近红外光谱数据,构成校正样本集。
这里,本发明以谷物蛋白质含量的近红外光谱无损检测过程为例,对被测谷物进行近红外光谱采集,所述光谱采集范围为1100~2498nm,波长变量个数为700个,光谱矩阵中每一行各元素代表一个样本在各个波长下的吸光度值。校正集样本总个数为60个,其原始光谱的光谱矩阵X的图形如图2所示。Here, the present invention takes the near-infrared spectrum non-destructive detection process of grain protein content as an example, and performs near-infrared spectrum collection on the measured grains. The range of spectrum collection is 1100-2498nm, and the number of wavelength variables is 700. Each element in a row represents the absorbance value of a sample at each wavelength. The total number of samples in the calibration set is 60, and the graph of the spectral matrix X of the original spectrum is shown in Figure 2.
步骤102、采用标准分析方法测定校正样本集中样本待测组分的化学含量的真值。
这里,采用标准分析方法测定上述60个校正集样本的蛋白质含量真值范围为7.6540~9.7110%,呈随机分布,其浓度标准差为0.4986%。Here, the true value range of the protein content of the above 60 calibration set samples measured by the standard analysis method is 7.6540-9.7110%, which is randomly distributed, and the standard deviation of the concentration is 0.4986%.
步骤103、对所述近红外光谱数据进行预处理,去除噪声、基线或其他干扰待测物质成分信息等的无用信息。Step 103: Perform preprocessing on the near-infrared spectrum data to remove noise, baseline or other useless information that interferes with the composition information of the substance to be measured.
这里,所述预处理,主要是用来去除上述样本光谱测量数据中由于仪器噪声、基线漂移和物质中的能导致干扰的物质成分等的无用信息,从而提高光谱质量。所述预处理方式包括小波变换、微分等所有能够去除噪声、基线和其他干扰待测物质成分信息的无用信号的方式,但并不限于小波变换、微分等处理过程;其中,Here, the preprocessing is mainly used to remove useless information in the above-mentioned sample spectral measurement data due to instrument noise, baseline drift, and material components that can cause interference in the material, thereby improving spectral quality. The preprocessing methods include wavelet transform, differential and other methods that can remove noise, baseline and other useless signals that interfere with the information of the substance composition to be measured, but are not limited to wavelet transform, differential and other processing processes; wherein,
所述小波变换过程,包括如下步骤:Described wavelet transform process, comprises the steps:
步骤1031:选择小波基和小波分解层数,将所述光谱矩阵X的每条信号进行小波分解;其中光谱矩阵X的每一行中各元素代表一个样本在各个波长下的吸光度值;Step 1031: select the wavelet basis and the number of wavelet decomposition layers, and perform wavelet decomposition on each signal of the spectral matrix X; wherein each element in each row of the spectral matrix X represents the absorbance value of a sample at each wavelength;
步骤1032:对光谱信号在小波域内的低频段小波系数置零来实现基线校正,利用较高频段小波系数阈值处理来实现噪声去除;Step 1032: zeroing the low-frequency wavelet coefficients of the spectral signal in the wavelet domain to implement baseline correction, and using higher-frequency wavelet coefficient threshold processing to implement noise removal;
步骤1033:用分解后去噪和基线校正后的第N层低频和高频系数进行信号重构,重构的各条光谱信号组成新的光谱矩阵Xnew。Step 1033: Perform signal reconstruction using the denoised and baseline-corrected low-frequency and high-frequency coefficients of the Nth layer, and each reconstructed spectral signal forms a new spectral matrix X new .
所述的光谱微分处理过程,包括如下步骤:The described spectral differential processing process includes the following steps:
步骤1031′:选择微分窗口宽度g及微分阶次;Step 1031': Select the differential window width g and differential order;
步骤1032′:光谱的一阶微分算法如公式(1)所示,一阶微分可去除与波长无关的漂移;Step 1032': the first-order differential algorithm of the spectrum is shown in formula (1), the first-order differential can remove the drift independent of wavelength;
Xnew(i,j)=[x(i,j+g)-x(i,j)]/g (1)X new (i, j) = [x (i, j + g) - x (i, j)] / g (1)
光谱的二阶微分算法如公式(2)所示,二阶微分可去除与波长相关的漂移。The second-order differential algorithm of the spectrum is shown in formula (2), and the second-order differential can remove the drift related to the wavelength.
Xnew(i,j)=[x(i,j+g)-2x(i,j)+x(i,j-g)]/g2 (2)X new (i,j)=[x(i,j+g)-2x(i,j)+x(i,jg)]/g 2 (2)
本发明实施例采用微分预处理方式对原始近红外光谱进行处理时,选择微分窗口宽度g=17,微分阶次为2阶,经微分预处理后得到的新的光谱Xnew如图3所示,预处理后得到的光谱Xnew的波长变量个数为666个,即Xnew的矩阵维数为60×666。In the embodiment of the present invention, when the differential preprocessing method is used to process the original near-infrared spectrum, the differential window width g=17 is selected, and the differential order is 2nd order. The new spectrum X new obtained after the differential preprocessing is shown in Figure 3 , the number of wavelength variables of the spectrum X new obtained after preprocessing is 666, that is, the matrix dimension of X new is 60×666.
需要指出的是,本发明中,对近红外光谱进行预处理的方式并不限于上述方法,其他任何去噪和基线校正等无用信息消除的预处理手段,也均适用。It should be pointed out that in the present invention, the method of preprocessing the near-infrared spectrum is not limited to the above method, and any other preprocessing means for eliminating useless information such as denoising and baseline correction are also applicable.
步骤104、对经预处理后的校正集样本的光谱数据进行基于自模型混合物分析技术的校正集样本优选。
这里,所述基于自模型混合物分析技术的校正集样本优选方法,是指对经过预处理后的校正集样本的光谱Xnew进行样本优选。Here, the calibration set sample optimization method based on the self-model mixture analysis technique refers to performing sample optimization on the spectrum X new of the calibration set sample after preprocessing.
进一步地,所述基于自模型混合物分析技术的样本优选方法,包括以下步骤:Further, the sample optimization method based on self-model mixture analysis technology includes the following steps:
步骤1041、将光谱矩阵Xnew进行转置得到X′new,则X′new矩阵每一列各元素代表一个样本在各个波长下的吸光度值。这样,能够为样本优选自动实现的计算机程序设计带来方便。Step 1041, transpose the spectral matrix X new to obtain X' new , then each element in each column of the X' new matrix represents the absorbance value of a sample at each wavelength. In this way, it can bring convenience to the design of the computer program for preferably automatic realization of the sample.
步骤1042、计算光谱矩阵X′new中各列向量i的纯度值pi,1。Step 1042. Calculate the purity value p i,1 of each column vector i in the spectral matrix X'new .
如图4所示,是在选第1个样本时,求得的各样本的纯度值。这里,光谱矩阵X′new中各列向量i即样本i的纯度值pi,1的计算如公式(3)所示,纯度值用以表征各样本含被测物质成分含量信息量的大小,也就是说对校正模型的贡献。As shown in Figure 4, it is the purity value of each sample obtained when the first sample is selected. Here, the calculation of each column vector i in the spectral matrix X' new , that is, the purity value p i, 1 of the sample i, is shown in formula (3), and the purity value is used to represent the amount of information about the content of the measured substance contained in each sample. That is to say the contribution to the corrected model.
pi,1=σi/(μi+α) (3)p i,1 = σ i /(μ i +α) (3)
其中,μi为均值、σi为标准差、α为补偿因子(一般取均值的1~5%)。Among them, μ i is the mean value, σ i is the standard deviation, and α is the compensation factor (generally 1-5% of the mean value).
步骤1043、选择第一个样本。Step 1043, select the first sample.
根据所述步骤1042求得的各列向量i即样本i的pi,1值,判断pi,1值的大小,具有最大pi,1值的第i个样本即为选出的第一个样本。从图4可知,具有最大纯度值(p5,1=797.12)的校正集中的第5个样本作为优选出的第1个样本,用于后续的校正模型的建立。According to each column vector i obtained in the step 1042, i.e., the value of pi , 1 of the sample i, the value of pi , 1 is judged, and the i-th sample with the largest value of pi , 1 is the selected first sample. samples. It can be seen from FIG. 4 that the fifth sample in the calibration set with the maximum purity value (p 5,1 =797.12) is used as the preferred first sample for subsequent establishment of the calibration model.
步骤1044、选择第k(k≥2)个样本。Step 1044, select the kth (k≥2) sample.
计算矩阵X′new中列向量i的长度li如公式(4)所示Calculate the length l i of the column vector i in the matrix X'new as shown in formula (4)

其中,di,j为光谱矩阵X′new中第i行第j列元素,有
其中,k表示待确定的第k个样本,pk-1表示目前已经选定了的第(k-1)个样本在C矩阵中所在列向量的标号,p1表示已选择的第一个样本在C矩阵中所在列向量的标号,则纯度值pi,k为:Among them, k represents the kth sample to be determined, p k-1 represents the label of the column vector of the (k-1)th sample that has been selected so far in the C matrix, and p 1 represents the selected first The label of the column vector where the sample is located in the C matrix, then the purity value p i,k is:
pi,k=ρi,k(σi/(μi+α))(6)p i,k = ρ i,k (σ i /(μ i +α))(6)
具有最大pi,k值的第i个样本为选出的第k个样本。The i-th sample with the largest p i,k value is the selected k-th sample.
根据公式(4)、公式(5)、公式(6)可求得与已优选出的前k-1个样本具有最小共线性的样本,作为选出的第i个样本,本实施例中,预先选出30个样本,为后面确定样本个数,以确定最优的校正样本集做准备。According to formula (4), formula (5) and formula (6), the sample having the least collinearity with the optimized first k-1 samples can be obtained, as the i-th sample selected, in this embodiment,
步骤1045、最优样本个数判定。重复上述步骤1044,并通过依次迭代选择的样本建立多元校正模型,交互验证评价模型的预测性能,具有最小预测均方根误差(RMSEP)时选取的样本个数即为最优的样本个数。所述RMSEP计算公式为:Step 1045, determining the optimal number of samples. Repeat the above step 1044, and establish a multivariate calibration model by successively iteratively selecting samples, and cross-validate and evaluate the predictive performance of the model. The number of samples selected with the minimum predicted root mean square error (RMSEP) is the optimal number of samples. The RMSEP calculation formula is:
其中,为预测值,y为标准方法测得的参考值,n为样本个数。in, is the predicted value, y is the reference value measured by the standard method, and n is the number of samples.
本实施例中,通过依次迭代选择的30个样本建立偏最小二乘多元校正模型,采用交互验证评价模型的性能,实验显示,当选取前26个样本建立多元校正模型时,其交互验证得到的RMSEP(RMSEP=0.12%)为最小,如图5所示,判定最优样本个数为26。In this embodiment, the partial least squares multivariate correction model is established by sequentially iteratively selecting 30 samples, and the performance of the model is evaluated by interactive verification. The experiment shows that when the first 26 samples are selected to establish the multivariate correction model, the cross-verification obtained RMSEP (RMSEP=0.12%) is the minimum, as shown in Figure 5, and it is determined that the optimal number of samples is 26.
步骤1046、组成最优的校正样本集。用优选出的一定个数的样本组成新的最优的校正样本集,其光谱矩阵为Xopt,为了符合一般的习惯,仍然将光谱矩阵Xopt每一行元素表示为一个样本在各个波长下的吸光度值。Step 1046, forming an optimal calibration sample set. Use a certain number of selected samples to form a new optimal calibration sample set, and its spectral matrix is X opt . In order to conform to the general practice, each row element of the spectral matrix X opt is still expressed as a sample at each wavelength Absorbance values.
本实施例中,将选取的前26个样本组合为最优的校正样本集用于建立最终的多元校正模型,此时得到的光谱矩阵Xopt的维数变为了26×666。In this embodiment, the selected first 26 samples are combined into an optimal calibration sample set to establish a final multivariate calibration model, and the dimension of the spectral matrix X opt obtained at this time becomes 26×666.
步骤105、用优选出的校正样本集样本的光谱数据和与之对应的标准值,建立基于核函数变换的非线性偏最小二乘校正模型。
这里,所述的基于核函数变换的非线性偏最小二乘校正模型的建立,是指将经过光谱预处理和样本优选后得到的优化的校正样本集的光谱矩阵Xopt,与步骤102中采用的标准分析方法测定的校正样本集中样本待测组分的化学含量的真值建立关联关系,以用于预测未知样本的待测成分含量。Here, the establishment of the nonlinear partial least squares correction model based on kernel function transformation refers to the spectral matrix X opt of the optimized correction sample set obtained after spectral preprocessing and sample optimization, which is the same as that used in
所述的基于核函数变换的非线性偏最小二乘校正模型的建立,包括以下步骤:The establishment of the nonlinear partial least squares correction model based on kernel function transformation comprises the following steps:
步骤1051、确定初始参数,包括核函数及其参数、主成分个数。常用的核函数有协方差核、多项式核和高斯核等,其表达式分别如公式(8)、公式(9)、公式(10)所示:Step 1051. Determine the initial parameters, including the kernel function and its parameters, and the number of principal components. Commonly used kernel functions include covariance kernel, polynomial kernel, and Gaussian kernel, etc., and their expressions are shown in formula (8), formula (9), and formula (10):
k(xi,xj)=exp(-||xi-xj||2/(2×σ2))(10)k(x i , x j )=exp(-||x i -x j || 2 /(2×σ 2 ))(10)
以上三式中的i、j分别表示第i、j个光谱向量;p、q、σ分别为需根据实际情况确定的核参数。i and j in the above three formulas represent the i and j spectral vectors respectively; p, q and σ are the kernel parameters that need to be determined according to the actual situation.
本实施例中,确定初始参数,选用高斯核,核函数σ=1、最大主成分个数为20。In this embodiment, the initial parameters are determined, a Gaussian kernel is selected, the kernel function σ=1, and the maximum number of principal components is 20.
步骤1052、对校正集的自变量进行核函数变换,其变换矩阵如公式(11)所示,然后进行中心化处理,其表达式如公式(12)所示。Step 1052: Carry out kernel function transformation on the independent variables of the correction set, the transformation matrix of which is shown in formula (11), and then perform centering processing, and its expression is shown in formula (12).
以上二式中的n表示校正集样本的个数。k(·,·)表示两个向量的内积;xi(i=1,...,n)表示校正集样本的光谱;I表示单位矩阵,1n表示各元素都为1的n维向量。The n in the above two formulas represents the number of samples in the calibration set. k(·,·) represents the inner product of two vectors; x i (i=1,...,n) represents the spectrum of the calibration set sample; I represents the identity matrix, and 1 n represents the n dimension where each element is 1 vector.
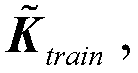
在实施例中,经核函数变换处理后的矩阵如图6所示,经核函数变换后得到的最终用来建立校正模型的光谱矩阵的维数降为了26×26,与最初的原始光谱X的维数60×700相比,明显有简化光谱模型,降低模型复杂性,有助于提高模型训练速度和降低谷物中蛋白质含量近红外光谱无损检测的硬件实现难度。同时由于采用了高斯核变换,该模型也包含了非线性信息。In the embodiment, the matrix transformed by the kernel function is shown in Figure 6, and the dimension of the spectral matrix obtained after the kernel function transformation and finally used to establish the calibration model is reduced to 26×26, which is different from the original original spectrum X Compared with the dimension of 60×700, it obviously simplifies the spectral model and reduces the complexity of the model, which helps to improve the speed of model training and reduce the difficulty of hardware implementation for non-destructive detection of protein content in grains by near-infrared spectroscopy. At the same time, due to the use of Gaussian kernel transformation, the model also contains nonlinear information.
步骤1053、对经核函数变换后得到的矩阵
其中,b为

步骤106、用所构造的基于核函数变换的非线性偏最小二乘校正模型,来检测未知样本的物质成分含量。
这里,所述的检测未知样本的物质成分含量,是指采用光谱仪采集未知样本的光谱,将该光谱进行和校正集样本相同的预处理,通过已建立的校正模型,得到该未知样本的待测成分含量的预测值。Here, the detection of the material composition content of the unknown sample refers to the use of a spectrometer to collect the spectrum of the unknown sample, the same pretreatment as the calibration set sample, and the established calibration model to obtain the unknown sample. Predicted value of ingredient content.
进一步地,所述未知样本的物质成分含量的预测,包括如下步骤:Further, the prediction of the substance composition content of the unknown sample includes the following steps:
步骤1061、用光谱仪采集未知样本的光谱。Step 1061, collect the spectrum of the unknown sample with a spectrometer.
本实施例中,采集20个未知的样本光谱。In this embodiment, 20 unknown sample spectra are collected.
步骤1062、对于未知样本的光谱,采用与校正集样本相同的预处理方法进行光谱处理,去除无用信息。Step 1062, for the spectrum of the unknown sample, use the same preprocessing method as the calibration set sample for spectral processing to remove useless information.
本实施例中,采用微分预处理方法对未知样本的原始近红外光谱进行处理,选择微分窗口宽度g=17,微分阶次为2阶。In this embodiment, the differential preprocessing method is used to process the original near-infrared spectrum of the unknown sample, and the differential window width g=17 is selected, and the differential order is 2nd order.
步骤1063、对于经预处理后的未知样本的光谱进行核函数变换,核函数及其参数的选择与步骤105中所选的一致,其变换矩阵如公式(14)所示,然后进行中心化处理,其表达式如公式(15)所示。Step 1063, perform kernel function transformation on the spectrum of the unknown sample after preprocessing, the selection of the kernel function and its parameters is consistent with the one selected in
其中,xti(i=1,...,n)表示未知的样本的光谱;xi(i=1,...,n)表示校正集样本的光谱。Wherein, xt i (i=1, . . . , n) represents the spectrum of an unknown sample; x i (i=1, . . . , n) represents the spectrum of a calibration set sample.
本实施例中,对于经预处理后的未知样本的光谱进行核函数变换,核函数及其参数的选择与步骤1053中确定的一致,即选择核函数为高斯核、核参数σ=1,则其核变换后的矩阵如图8所示。In this embodiment, the kernel function transformation is performed on the spectrum of the unknown sample after preprocessing, and the selection of the kernel function and its parameters is consistent with that determined in step 1053, that is, the kernel function is selected as the Gaussian kernel and the kernel parameter σ=1, then The matrix after kernel transformation is shown in Figure 8.
步骤1064、获得未知样本的物质成分含量的检测值,其计算的表达式如公式(16)所示:Step 1064, obtain the detection value of the substance composition content of the unknown sample, and its calculation expression is as shown in formula (16):
本实施例中,获得未知样本的物质成分含量的检测值,按公式(16)求得该20个未知样本的蛋白质含量,采用本发明的物质成分含量近红外光谱无损检测方法,得到的检测值与采用标准方法测得的参考值的相关性如图9所示。In the present embodiment, the detection value of the material component content of the unknown sample is obtained, and the protein content of the 20 unknown samples is obtained according to the formula (16), and the detection value obtained is obtained by using the material component content of the present invention near-infrared spectroscopy non-destructive detection method The correlation with reference values measured using standard methods is shown in Figure 9.
另外,为与一般的近红外光谱无损检测方法进行比较,表一给出了不同方法建立的模型对未知样本进行预测的参数,结果表明,本发明提出的物质成分含量近红外光谱无损检测方法的检测精度明显优于一般方法,且本发明提出的物质成分含量近红外光谱无损检测方法简单、快速,校正集样本优选和核函数变换过程均能降低模型的复杂性,便于硬件的实现,且通过选择适当的预处理方法及其参数、核函数及其参数,该物质成分含量的近红外光谱无损检测方法还可适用于人体生化参数如血糖、植物生化参数如叶片水分、苹果糖度等的以及其他生物物质成分含量的无损检测,并可显著提高检测结果的精度。In addition, in order to compare with the general non-destructive detection method of near-infrared spectroscopy, Table 1 provides the parameters for predicting unknown samples by models established by different methods. The detection accuracy is obviously better than that of general methods, and the non-destructive detection method of near-infrared spectroscopy for material composition proposed by the present invention is simple and fast. By selecting the appropriate pretreatment method and its parameters, kernel function and its parameters, the near-infrared spectroscopy non-destructive detection method of the content of the substance can also be applied to human biochemical parameters such as blood sugar, plant biochemical parameters such as leaf moisture, apple sugar content, etc., and other Non-destructive testing of biological substance content, and can significantly improve the accuracy of testing results.
表一:选用不同光谱分析方法的预测参数Table 1: Prediction parameters for different spectral analysis methods
本发明还提供了所述的物质成分含量的近红外无损检测装置,如图10所示。因现有近红外光谱无损检测装置采用的预测模型通常是离线训练的校正模型,模型复杂,且通过硬件中写入的校正模型通常是固定不可调的,这对于成分特别复杂的被测对象的物质成分含量的检测的适用性不佳。而采用本发明提供的装置,可自动的实现校正样本优选和非线性校正模型的训练过程,参数设置不复杂、模型简单,具有较高的无损检测速度和准确度。且本发明提供的装置还可根据实际被测对象情况调整预处理方法及其参数、以及调节校正模型及其参数,能提高物质成分含量检测结果的精度和适用性。The present invention also provides the near-infrared non-destructive testing device for the content of the material components, as shown in FIG. 10 . Because the prediction model adopted by the existing near-infrared spectrum non-destructive testing device is usually a correction model trained offline, the model is complex, and the correction model written in the hardware is usually fixed and non-adjustable. The applicability of the detection of substance composition content is not good. However, the device provided by the present invention can automatically realize the optimization of correction samples and the training process of nonlinear correction model, the parameter setting is not complicated, the model is simple, and it has high non-destructive detection speed and accuracy. Moreover, the device provided by the present invention can also adjust the preprocessing method and its parameters, as well as adjust the correction model and its parameters according to the actual situation of the measured object, so as to improve the accuracy and applicability of the detection results of the substance composition content.
该装置主要包括光源、近红外光谱仪、微处理器和检测结果显示屏四个模块,由光源发出的近红外光照射在被测物体上,由近红外光谱仪获取光源经被测物体后反射或者透射后的吸光度数据,通过微处理器处理获取的该光谱吸光度数据、建立并保存校正模型、计算未知样本的被测物质成分含量的检测值,并由检测结果显示屏显示该检测值。其中微处理器模块包括:校正集样本优选单元100、模型建立单元200和预测值获取单元300。其中,The device mainly includes four modules: a light source, a near-infrared spectrometer, a microprocessor, and a test result display screen. The near-infrared light emitted by the light source is irradiated on the measured object, and the near-infrared spectrometer obtains the reflection or transmission of the light source after passing through the measured object. After the absorbance data, the acquired spectral absorbance data is processed by the microprocessor, the calibration model is established and saved, and the detected value of the measured substance content of the unknown sample is calculated, and the detected value is displayed on the test result display screen. The microprocessor module includes: a calibration set
校正集样本优选单元100,用于获取一定数量的用于建立基于核函数变换的非线性偏最小二乘校正模型的最优的校正集样本。所述校正集样本优选单元100进一步包括:校正集样本数据获取子单元110、校正集样本数据预处理子单元120和最优校正集样本获取子单元130。The calibration set
所述校正集样本数据获取子单元110,用于获取大量样本的近红外连续光谱数据,以及与之相应的采用标准分析方法测得的校正样本集中样本待测组分的化学含量的真值,构成校正集样本并提供给校正集样本数据预处理子单元120;校正集样本数据预处理子单元120,连接校正集样本数据获取子单元110,用于对校正集样本数据获取子单元110获取的校正集样本数据进行预处理,包括预处理方法及其参数的选择,将预处理后得到的光谱数据提供给最优校正集样本获取子单元130,同时还将选择的预处理方法及其参数提供给未知样本光谱数据预处理子单元320;最优校正集样本获取子单元130,连接校正集样本数据预处理子单元120,用于根据校正集样本数据预处理子单元120获取的预处理后的校正集样本数据和校正集样本数据获取子单元110中获取的相应的真值,确定一定数量的最优校正集样本并提供给模型建立单元200和预测值单元300。The calibration set sample data acquisition subunit 110 is used to acquire the near-infrared continuous spectrum data of a large number of samples, and the corresponding true value of the chemical content of the sample components to be measured in the calibration sample set measured by standard analysis methods, Constitute the calibration set sample and provide it to the calibration set sample data preprocessing subunit 120; The calibration set sample data is preprocessed, including the selection of the preprocessing method and its parameters, and the spectral data obtained after preprocessing is provided to the optimal calibration set sample acquisition subunit 130, and the selected preprocessing method and its parameters are also provided Give the unknown sample spectral data preprocessing subunit 320; the optimal calibration set sample acquisition subunit 130 is connected to the calibration set sample data preprocessing subunit 120 for obtaining the preprocessed sample data according to the calibration set sample data preprocessing subunit 120 The calibration set sample data and the corresponding true values acquired in the calibration set sample data acquisition subunit 110 determine a certain number of optimal calibration set samples and provide them to the
模型建立单元200,连接校正集样本优选单元100,用于利用校正集样本优选单元100获得的最优的校正集样本建立基于核函数变换的非线性偏最小二乘校正模型,并将该模型提供给预测值获取单元300。所述模型建立单元200进一步包括:校正集样本核函数变换子单元210和基于核函数变换的非线性偏最小二乘校正模型获取子单元220。其中,The
所述校正集样本核函数变换子单元210,用于对最优校正集样本获取子单元130获得的最优校正集样本进行核函数变换,包括核函数及其参数的选择,将获得的校正集样本的核函数变换后的矩阵提供给基于核函数变换的非线性偏最小二乘校正模型获取子单元220,同时将选择的核函数及其参数提供给未知样本核函数变换子单元330。The calibration set sample kernel function transformation subunit 210 is used to perform kernel function transformation on the optimal calibration set sample obtained by the optimal calibration set sample acquisition subunit 130, including the selection of the kernel function and its parameters, and the obtained calibration set The transformed matrix of the sample kernel function is provided to the nonlinear partial least squares correction model acquisition subunit 220 based on kernel function transformation, and the selected kernel function and its parameters are provided to the unknown sample kernel function transformation subunit 330 .
所述基于核函数变换的非线性偏最小二乘校正模型获取子单元220,连接校正集样本核函数变换子单元210,用于根据校正集样本核函数变换子单元210获取的核函数变换后得到的矩阵,建立非线性偏最小二乘校正模型,并将获得的回归系数提供给预测值获取单元300。The nonlinear partial least squares correction model acquisition subunit 220 based on kernel function transformation is connected to the correction set sample kernel function transformation subunit 210, which is used to obtain after the kernel function transformation obtained by the correction set sample kernel function transformation subunit 210 matrix, establish a nonlinear partial least squares correction model, and provide the obtained regression coefficients to the predicted
预测值获取单元300,连接校正集样本优选单元100和模型建立单元200,利用校正集样本优选单元100得到的最优的校正集样本和模型建立单元200得到的模型参数,获取未知样本的物质成分含量近红外光谱无损检测的结果。所述预测值获取单元300进一步包括:未知样本光谱数据获取子单元310、未知样本光谱数据预处理子单元320、未知样本核函数变换子单元330和预测值计算子单元340。其中,The predicted
所述未知样本光谱数据获取子单元310,用于获取待测的未知成分含量的样本的近红外波段范围的连续光谱,并将该光谱数据提供给未知样本光谱数据预处理子单元320。The unknown sample spectral data acquisition subunit 310 is used to acquire the continuous spectrum in the near-infrared range of the sample with unknown component content to be tested, and provide the spectral data to the unknown sample spectral data preprocessing subunit 320 .
所述未知样本光谱数据预处理子单元320,连接校正集样本数据预处理子单元120和未知样本光谱数据获取子单元310,用于根据校正集样本数据预处理子单元120提供的所选择的预处理方法及其参数,对未知样本光谱数据获取子单元310获取的未知样本光谱数据进行预处理。The unknown sample spectral data preprocessing subunit 320 is connected to the calibration set sample data preprocessing subunit 120 and the unknown sample spectral data acquisition subunit 310, and is used for the selected preprocessing provided by the calibration set sample data preprocessing subunit 120. The processing method and its parameters preprocess the unknown sample spectral data acquired by the unknown sample spectral data acquisition subunit 310 .
所述未知样本核函数变换子单元330,连接校正集样本核函数变换子单元210、最优校正集样本获取子单元130和未知样本光谱数据预处理子单元320,用于根据校正集样本核函数变换子单元210提供的所选的核函数及其参数,并利用最优校正集样本获取子单元130提供的最优校正集样本,对未知样本光谱数据预处理子单元320提供的预处理后的未知样本光谱数据进行核函数变换,将获得的核函数变换后的矩阵提供给预测值计算子单元340。The unknown sample kernel function conversion subunit 330 is connected to the calibration set sample kernel function conversion subunit 210, the optimal calibration set sample acquisition subunit 130 and the unknown sample spectral data preprocessing subunit 320, for according to the calibration set sample kernel function Transform the selected kernel function and its parameters provided by the subunit 210, and use the optimal calibration set sample provided by the optimal calibration set sample acquisition subunit 130 to preprocess the unknown sample spectral data provided by the preprocessing subunit 320 The spectral data of the unknown sample is transformed by the kernel function, and the obtained matrix transformed by the kernel function is provided to the predicted value calculation subunit 340 .
所述预测值计算子单元340,连接未知样本核函数变换子单元330和基于核函数变换的非线性偏最小二乘校正模型获取子单元220,用于利用基于核函数变换的非线性偏最小二乘校正模型获取子单元220获得的回归系数和未知样本核函数变换子单元330获得的待测的未知样本核函数变换后的矩阵,计算得到未知样本的待测成分含量的检测值。The predicted value calculation subunit 340 is connected to the unknown sample kernel function transformation subunit 330 and the nonlinear partial least squares correction model acquisition subunit 220 based on the kernel function transformation, for utilizing the nonlinear partial least squares correction model based on the kernel function transformation Multiply the regression coefficient obtained by the correction model acquisition subunit 220 and the transformed matrix of the unknown sample kernel function obtained by the unknown sample kernel function transformation subunit 330 to calculate the detection value of the component content of the unknown sample.
以上所述,仅为本发明的较佳实施例而已,并非用于限定本发明的保护范围。The above descriptions are only preferred embodiments of the present invention, and are not intended to limit the protection scope of the present invention.
Claims (7)



Priority Applications (1)
| Application Number | Priority Date | Filing Date | Title |
|---|---|---|---|
| CN 201010218291 CN101915744B (en) | 2010-07-05 | 2010-07-05 | Near infrared spectrum nondestructive testing method and device for material component content |
Applications Claiming Priority (1)
| Application Number | Priority Date | Filing Date | Title |
|---|---|---|---|
| CN 201010218291 CN101915744B (en) | 2010-07-05 | 2010-07-05 | Near infrared spectrum nondestructive testing method and device for material component content |
Publications (2)
| Publication Number | Publication Date |
|---|---|
| CN101915744A CN101915744A (en) | 2010-12-15 |
| CN101915744B true CN101915744B (en) | 2012-11-07 |
Family
ID=43323305
Family Applications (1)
| Application Number | Title | Priority Date | Filing Date |
|---|---|---|---|
| CN 201010218291 Expired - Fee Related CN101915744B (en) | 2010-07-05 | 2010-07-05 | Near infrared spectrum nondestructive testing method and device for material component content |
Country Status (1)
| Country | Link |
|---|---|
| CN (1) | CN101915744B (en) |
Cited By (1)
| Publication number | Priority date | Publication date | Assignee | Title |
|---|---|---|---|---|
| CN108152235A (en) * | 2018-03-21 | 2018-06-12 | 中南大学 | The content of beary metal inversion method of external spectrum in a kind of joint soil chamber |
Families Citing this family (64)
| Publication number | Priority date | Publication date | Assignee | Title |
|---|---|---|---|---|
| US7868296B2 (en) * | 2009-03-30 | 2011-01-11 | Honeywell Asca Inc. | Spectroscopy having correction for broadband distortion for analyzing multi-component samples |
| CN102135496A (en) * | 2010-12-23 | 2011-07-27 | 华东交通大学 | Infrared spectrum quantitative analysis method and infrared spectrum quantitative analysis device based on multi-scale regression |
| CN102072767A (en) * | 2010-12-23 | 2011-05-25 | 华东交通大学 | Wavelength similarity consensus regression-based infrared spectrum quantitative analysis method and device |
| CN102445428B (en) * | 2011-09-19 | 2013-10-30 | 中国原子能科学研究院 | Analytical method of tetravalent uranium |
| US20130325400A1 (en) * | 2012-05-31 | 2013-12-05 | Richard Jackson | System and method for determining the presence of spectral components in the spectra of mixture |
| CN103425091B (en) * | 2012-07-20 | 2015-11-18 | 华中农业大学 | The online lossless detection method of near infrared spectrum of simple grain rapeseed quality and device |
| CN102998278A (en) * | 2012-11-27 | 2013-03-27 | 马应龙药业集团股份有限公司 | Method capable of determining dried alum and/or chlorogenic acid content in Jinxuan washing powder online |
| CN103115879B (en) * | 2013-01-18 | 2015-05-06 | 北京林业大学 | Method for measuring content of chlorophyll a, chlorophyll b and carotenoid in plant live leaf by utilizing absorption spectrum |
| CN103105369B (en) * | 2013-01-30 | 2015-10-28 | 华中科技大学 | Fluent meterial spectrum baseline corrects quantitative analysis method |
| CN105026902A (en) * | 2013-03-07 | 2015-11-04 | 西门子公司 | Systems and methods for boosting coal quality measurement statement of related cases |
| CN103149208B (en) * | 2013-03-09 | 2015-03-04 | 福州大学 | Method for rapidly detecting multiple components of fat-soluble azo dyes |
| CN103364369A (en) * | 2013-07-22 | 2013-10-23 | 天津长芦海晶集团有限公司 | Quantitative test method for components of additives in PA6 producing process |
| CN103592255A (en) * | 2013-11-22 | 2014-02-19 | 山东东阿阿胶股份有限公司 | Soft method for measuring total protein content of donkey-hide gelatin skin solution on basis of near infrared spectrum technology |
| CN103760130B (en) * | 2014-01-03 | 2016-04-20 | 广州中大南沙科技创新产业园有限公司 | The method of Tween-80 content near infrared ray compound Moschus injection |
| CN103776789B (en) * | 2014-02-26 | 2015-12-09 | 张显超 | A kind of types of unknown pollutants method for early warning based on uv-vis spectra |
| CN103854305B (en) * | 2014-03-19 | 2016-08-17 | 天津大学 | A kind of Model Transfer method based on multi-scale Modeling |
| CN104048940B (en) * | 2014-06-05 | 2017-07-04 | 中国肉类食品综合研究中心 | The near-infrared method for quick of live pig Blood cortisol content |
| CN104048939A (en) * | 2014-06-05 | 2014-09-17 | 中国肉类食品综合研究中心 | Near infrared rapid detection method for blood sugar content in live pig blood |
| CN104237158B (en) * | 2014-09-04 | 2016-07-27 | 浙江科技学院 | A kind of Qualitative Analysis of Near Infrared Spectroscopy method with universality |
| CN104237159A (en) * | 2014-09-15 | 2014-12-24 | 甘肃银光化学工业集团有限公司 | Method for analyzing content of dibutyl phthalate in mixed material through near infrared spectrum |
| CN105631176A (en) * | 2014-10-28 | 2016-06-01 | 河北伊诺光学科技有限公司 | Model transferring method based on dual-tree complex wavelet and piecewise direct standardization |
| CN104634745B (en) * | 2015-01-29 | 2017-02-22 | 上海理工大学 | spectral reconstruction method |
| CN104897607B (en) * | 2015-06-18 | 2017-08-25 | 北京工商大学 | Portable near infrared spectrum food modeling and quick detection integral method and system |
| CN105044050A (en) * | 2015-07-07 | 2015-11-11 | 中国农业大学 | Rapid quantitative analysis method for metallic elements in crop straw |
| CN105092519B (en) * | 2015-07-10 | 2017-11-14 | 东北大学 | Sample component assay method based on increment PLS |
| CN105466878B (en) * | 2015-10-15 | 2019-01-18 | 秭归帝元食品罐头有限责任公司 | A method of utilizing lycopene in infrared spectrum measurement catsup |
| CN105738311A (en) * | 2015-12-01 | 2016-07-06 | 昆明睿意铂科技股份有限公司 | Apple sweetness non-damage quick detection method based on near-infrared spectrum technology |
| CN105699319A (en) * | 2016-01-28 | 2016-06-22 | 山西汾西矿业(集团)有限责任公司 | Near infrared spectrum quick detection method for total moisture of coal based on gaussian process |
| CN105486661A (en) * | 2016-01-28 | 2016-04-13 | 山西汾西矿业(集团)有限责任公司 | Near-infrared spectrum coal ash content rapid detection method based on Gaussian process |
| CN105606563A (en) * | 2016-01-28 | 2016-05-25 | 山西汾西矿业(集团)有限责任公司 | Method for quickly detecting near infrared spectrum coal volatile components based on Gaussian process |
| CN105699320A (en) * | 2016-01-28 | 2016-06-22 | 山西汾西矿业(集团)有限责任公司 | Near infrared spectrum quick detection method for coal sulfur based on Gauss process |
| CN107179292B (en) * | 2016-03-10 | 2020-03-27 | 中国农业机械化科学研究院 | Different near infrared spectrum variable optimization result fusion method and application |
| CN105842183B (en) * | 2016-03-17 | 2018-10-02 | 东北大学 | A kind of infrared spectrum modeling method based on common recognition selection technique |
| CN105823751B (en) * | 2016-03-22 | 2018-10-02 | 东北大学 | Multivariate Correction Regression Modeling Method for Infrared Spectrum Based on λ-SPXY Algorithm |
| CN105891141A (en) * | 2016-03-30 | 2016-08-24 | 南京富岛信息工程有限公司 | Method for rapidly measuring gasoline property data |
| CN105784672A (en) * | 2016-04-12 | 2016-07-20 | 河北伊诺光学科技股份有限公司 | Drug detector standardization method based on dual-tree complex wavelet algorithm |
| CN106338526B (en) * | 2016-08-15 | 2019-04-02 | 上海创和亿电子科技发展有限公司 | A kind of correction model and detection method based on microwave moisture instrument |
| CN106092962A (en) * | 2016-08-17 | 2016-11-09 | 山西省农业科学院农作物品种资源研究所 | A kind of near infrared spectroscopy quickly detects the method for millet crude protein content |
| CN106769970A (en) * | 2016-12-07 | 2017-05-31 | 甘肃萃英大农科技有限公司 | A kind of method of the kind, pol and acidity of Fast nondestructive evaluation apple |
| CN106596450B (en) * | 2017-01-06 | 2019-04-05 | 东北大学秦皇岛分校 | Incremental method for analyzing substance content based on infrared spectroscopy |
| CN106951600A (en) * | 2017-02-27 | 2017-07-14 | 山东省科学院海洋仪器仪表研究所 | A kind of Model transfer method for Spectral unmixing |
| CN107153046A (en) * | 2017-05-18 | 2017-09-12 | 温州大学 | Near infrared spectrum based on concentration residual information detects the method and system of fruit quality |
| CN108937955A (en) * | 2017-05-23 | 2018-12-07 | 广州贝塔铁克医疗生物科技有限公司 | The adaptive wearable blood glucose bearing calibration of personalization and its means for correcting based on artificial intelligence |
| CN108937954A (en) * | 2017-05-23 | 2018-12-07 | 中山大学 | Artificial intelligence deep learning method corrects the monitoring method for continuing blood glucose |
| CN107255657B (en) * | 2017-06-07 | 2020-01-10 | 苏州大学 | Chaos coding and decoding method for blood sugar nondestructive test |
| CN108064341B (en) | 2017-06-12 | 2020-05-12 | 深圳前海达闼云端智能科技有限公司 | Substance component detection method, substance component detection device and detection equipment |
| CN107389601B (en) * | 2017-08-25 | 2020-02-14 | 天津商业大学 | Hyperspectrum-based method for predicting titratable acid content of mango after impact damage |
| CN107367467B (en) * | 2017-09-22 | 2020-07-28 | 武汉轻工大学 | A kind of quantitative analysis method of substance content |
| CN109580413B (en) * | 2017-09-28 | 2021-04-23 | 宁海德宝立新材料有限公司 | Infrared spectroscopic analysis method of binary mixture and application thereof |
| CN109508440B (en) * | 2018-11-28 | 2023-01-03 | 武汉轻工大学 | Method, device and equipment for constructing spectral analysis model and storage medium |
| CN110006844A (en) * | 2019-05-22 | 2019-07-12 | 安徽大学 | Method and system for feature extraction of near-infrared spectrum based on functional principal component analysis |
| CN110503141A (en) * | 2019-08-13 | 2019-11-26 | Oppo(重庆)智能科技有限公司 | Drink identification method, apparatus and computer readable storage medium |
| CN111965137A (en) * | 2020-08-18 | 2020-11-20 | 山东金璋隆祥智能科技有限责任公司 | Method for measuring content and moisture of components in cold heat clearing granules |
| CN114199814B (en) * | 2020-08-28 | 2024-04-26 | 贵州中烟工业有限责任公司 | A near-infrared quantitative analysis model updating method based on regression coefficient |
| CN115389440B (en) * | 2021-05-24 | 2025-02-11 | 佛山市海天(高明)调味食品有限公司 | A method and device for predicting the content of components in a sample |
| CN113406058A (en) * | 2021-05-28 | 2021-09-17 | 中国科学院沈阳自动化研究所 | LIBS iron ore pulp quantitative analysis method for screening PLS based on mutual information characteristics |
| CN114065871B (en) * | 2021-11-25 | 2025-08-19 | 四川启睿克科技有限公司 | Near infrared spectrum online modeling method based on partial least square method |
| CN114112978A (en) * | 2021-12-13 | 2022-03-01 | 大连理工大学 | A Wavelet Function Calibration Modeling Method for In-situ Infrared Spectroscopy to Detect Solution Concentration in Crystallization Process |
| CN114329333B (en) * | 2022-03-03 | 2022-06-03 | 核工业航测遥感中心 | NASDV (network-independent data decomposition) denoising effective singular value number determining method for aviation gamma energy spectrum data |
| CN114778484B (en) * | 2022-05-10 | 2022-12-20 | 广东省农业科学院茶叶研究所 | Tea quality grade classification method and device, equipment and storage medium |
| CN115326749A (en) * | 2022-08-22 | 2022-11-11 | 华东理工大学 | Method and apparatus for measuring contaminants |
| CN115541807A (en) * | 2022-10-30 | 2022-12-30 | 云南中烟工业有限责任公司 | On-line analysis method of cigarette mainstream smoke based on multi-feature fusion |
| CN119354896B (en) * | 2024-12-23 | 2025-03-11 | 北京德开医药科技有限公司 | Method and system for detecting components of finished products in pharmaceutical production based on sample spectrum data |
| CN119985393B (en) * | 2025-04-17 | 2025-08-01 | 中检易兴元科技(北京)有限公司 | Method for detecting aniline additives in motor gasoline based on near infrared spectrum |
Family Cites Families (3)
| Publication number | Priority date | Publication date | Assignee | Title |
|---|---|---|---|---|
| US6405065B1 (en) * | 1999-01-22 | 2002-06-11 | Instrumentation Metrics, Inc. | Non-invasive in vivo tissue classification using near-infrared measurements |
| CN101101260A (en) * | 2007-05-25 | 2008-01-09 | 吉林大学 | Non-destructive analysis of anti-tuberculosis drugs by near-infrared spectroscopy |
| CN101650306A (en) * | 2009-08-11 | 2010-02-17 | 哈尔滨工业大学 | Method for quickly testing and analyzing quality of sericite |
-
2010
- 2010-07-05 CN CN 201010218291 patent/CN101915744B/en not_active Expired - Fee Related
Non-Patent Citations (5)
| Title |
|---|
| Roman Rosipal.Kernel Partial Least Squares for Nonlinear Regression and Discrimination.《Neural Network World》.2003,第13卷(第3期),291-300. * |
| Roman Rosipal.Kernel Partial Least Squares Regression in Reproducing Kernel Hilbert Space.《Journal of Machine Learning Research》.2001,(第2期),97-123. * |
| 崔广.基于近红外光谱分析的纺织品中羊毛含量检测技术研究.《中国优秀硕士学位论文全文数据库》.2007,(第5期),37-52. * |
| 李丽娜等.基于交互式自模型混合物分析的近红外光谱波长变量优选方法.《分析化学》.2009,第37卷(第6期),823-827. * |
| 李响等.一种血糖红外无创检测的改进小波预处理方法.《光学学报》.2010,第30卷(第2期),579-584. * |
Cited By (2)
| Publication number | Priority date | Publication date | Assignee | Title |
|---|---|---|---|---|
| CN108152235A (en) * | 2018-03-21 | 2018-06-12 | 中南大学 | The content of beary metal inversion method of external spectrum in a kind of joint soil chamber |
| CN108152235B (en) * | 2018-03-21 | 2020-09-22 | 中南大学 | Heavy metal content inversion method combining soil indoor and outdoor spectra |
Also Published As
| Publication number | Publication date |
|---|---|
| CN101915744A (en) | 2010-12-15 |
Similar Documents
| Publication | Publication Date | Title |
|---|---|---|
| CN101915744A (en) | Near-infrared spectroscopy non-destructive testing method and device for substance composition content | |
| CN101430276B (en) | Wavelength variable optimization method in spectrum analysis | |
| CN102879353B (en) | The method of content of protein components near infrared detection peanut | |
| CN104020127B (en) | A kind of near infrared spectrum is utilized quickly to measure the method for inorganic elements in Nicotiana tabacum L. | |
| CN101520412A (en) | Near infrared spectrum analyzing method based on isolated component analysis and genetic neural network | |
| CN107247033B (en) | The method of identifying the maturity of Huanghua pear based on the fast decay elimination algorithm and PLSDA | |
| CN101413885A (en) | Near-infrared spectrum method for rapidly quantifying honey quality | |
| CN105158200B (en) | A kind of modeling method for improving the Qualitative Analysis of Near Infrared Spectroscopy degree of accuracy | |
| CN116559110B (en) | An Adaptive Near-Infrared Spectral Transformation Method Based on Correlation and Gaussian Curve Fitting | |
| CN103234922A (en) | Rapid soil organic matter detection method based on large sample soil visible-near infrared spectrum classification | |
| CN101738383A (en) | Mid-infrared spectrum-based method for quickly detecting contents of heavy metal elements in soil | |
| Xiao et al. | Rapid detection of maize seed germination rate based on Gaussian process regression with selection kernel function | |
| CN106841083A (en) | Sesame oil quality detecting method based on near-infrared spectrum technique | |
| CN105486655A (en) | Rapid detection method for organic matters in soil based on infrared spectroscopic intelligent identification model | |
| CN104062259A (en) | Method for rapid determination of total saponin content in compound ass-hide glue pulp by near infrared spectroscopy | |
| CN115420708B (en) | Near-infrared nondestructive detection method for capsaicin substances in dry peppers | |
| CN105784672A (en) | Drug detector standardization method based on dual-tree complex wavelet algorithm | |
| CN116578851A (en) | A Hyperspectral Soil Available Boron Content Prediction Method | |
| CN110398472A (en) | A method for identification and classification of vegetable oil based on two-dimensional correlation spectrum quantification | |
| CN105758819A (en) | Method for detecting organic components of soil by utilizing near infrared spectrum | |
| Chang et al. | Detection of sugar content in food based on the electrochemical method with the assistance of partial least square method and deep learning | |
| CN104596979A (en) | Method for measuring cellulose of reconstituted tobacco by virtue of near infrared reflectance spectroscopy technique | |
| CN120468040A (en) | A method for corn quality selection using hyperspectral imaging technology | |
| CN104778349A (en) | Grade estimation method for rice surface soil nitrogen fertilizer application | |
| Ning et al. | Study on apple damage detecting method based on relaxation single-wavelength laser and convolutional neural network |
Legal Events
| Date | Code | Title | Description |
|---|---|---|---|
| C06 | Publication | ||
| PB01 | Publication | ||
| C10 | Entry into substantive examination | ||
| SE01 | Entry into force of request for substantive examination | ||
| C14 | Grant of patent or utility model | ||
| GR01 | Patent grant | ||
| C17 | Cessation of patent right | ||
| CF01 | Termination of patent right due to non-payment of annual fee |
Granted publication date: 20121107 Termination date: 20130705 |