[ summary of the invention ]
The invention aims to provide a marker gene for DPC cell identification and classification, a screening method and application thereof, which are used for identifying and classifying DPC cell products for clinical treatment and controlling the quality of DPC cell products for clinical application.
In view of the above, the technical solution adopted to achieve the above object of the present invention is:
the application of marker genes in the identification and classification of DPC cells, wherein the marker genes are one or more of CRH, FST, GLI1, POSTN, PYCR1, RELN, SLC16A9, SLC7A2, ST8SIA3, SLC7A5, STK32B and FGF 17.
Further, in the above-mentioned application, the DPC cells are identified and classified using the RNA, encoded protein or biological precursor expressed by the marker gene.
Another object of the present invention is to provide a screening method for identifying a Classification marker gene in DPC cells, comprising the steps of:
1. respectively extracting total RNA of iPSC cells, NSC cells and DPC cells, and detecting;
2. preparing a chain specificity cDNA library and performing library inspection;
3. sequencing and analyzing data to obtain genes with different RNA expression amounts;
4. and analyzing the functions of the genes according to the measured differential expression gene groups, and screening out the genes related to the regulation of the functions of the nerve cells or the development and differentiation of nerves.
Furthermore, the marker gene obtained by the screening method is one or more of CRH, FST, GLI1, POSTN, PYCR1, RELN, SLC16A9, SLC7A2, ST8SIA3, SLC7A5, STK32B and FGF 17.
Further, the method for preparing the strand-specific cDNA library in step 2 comprises:
A. enriching eukaryotic mRNA, breaking mRNA into short segments, using mRNA as a template, synthesizing single-strand cDNA by using a random primer, synthesizing double-strand cDNA, and purifying double strands;
B. adding A tail through end repair and connecting a sequencing joint, and then selecting the size of a fragment;
C. degrading the second strand of the cDNA containing U;
and D, PCR amplification and product purification to obtain a chain specificity cDNA library.
Further, the step 3 is: comparing Clean reads with a reference genome sequence, counting the number of reads contained in each gene, namely expression quantity, according to the annotation file of the genome and the position where the reads are compared to the genome, then carrying out statistical test to obtain differential expression genes, and finally carrying out functional annotation and GO and KEGG enrichment test on the differential expression genes to obtain GO and KEGG sets enriched by the differential expression genes.
Further, the step 4 is: the expression level is increased by 2.4 times and used as a threshold value to screen the marker gene combination specific to the DPC cells, the functions of the screened genes are analyzed, and genes related to the development and differentiation of nerve cells or the functions of the nerve cells are screened.
Still another object of the present invention is to provide a detection kit, comprising primers designed according to marker genes or biological precursors of marker genes, wherein the marker genes are one or more of CRH, FST, GLI1, POSTN, PYCR1, RELN, SLC16a9, SLC7a2, ST8SIA3, SLC7a5, STK32B, FGF 17.
It is still another object of the present invention to provide the use of the kit for detecting DPC to identify the gene of the classified cell marker, and the kit can also be used for preparing a diagnostic preparation for Parkinson's disease.
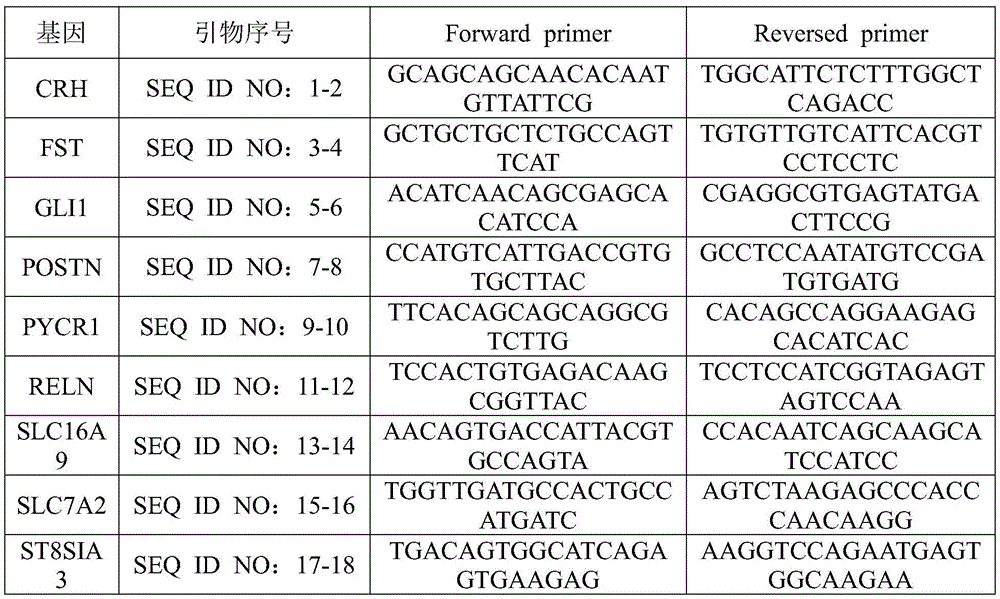
Further, the kit comprises a nucleotide sequence of SEQ ID No: 1-2, SEQ ID No: 3-4, SEQ ID No: 5-6, SEQ ID No: 7-8, SEQ ID No: 9-10, SEQ ID No: 11-12, SEQ ID No: 13-14, SEQ ID No: 15-16, SEQ ID No: 17-18, SEQ ID No: 19-20, SEQ ID No: 21-22 or SEQ ID No: 23-24.
Further, in the above application, the kit is used for detecting the expression of the corresponding marker gene, preferably, the detection method is one of a fluorescent quantitative PCR method, a digital PCR method, a gene chip method, an in situ hybridization method or a flow cytometry method. Wherein the gene chip method further comprises a probe for hybridization of a nucleic acid sequence designed based on the marker gene or a biological precursor of the marker gene.
Compared with the prior art, the invention has the beneficial effects that:
1. the marker gene provided by the invention can be used as a marker for identifying and classifying DPC cells, can also be used as a detection standard for quality control in clinical DPC cell preparation, and has important application value.
2. The marker gene provided by the invention can be used for preparing a diagnostic preparation of Parkinson, and the detection method comprises the steps of detecting the expression quantity of the coding gene and the biological precursor thereof by a fluorescence quantitative PCR method, a digital PCR method, a gene chip method, an in situ hybridization method or a flow cytometry method; the applicability is wide.
[ detailed description ] embodiments
The invention aims to screen a batch of DPC cell identification and classification gene markers with potential application value for quality control application of clinical DPC cell products. To achieve the above object, the present invention first collects samples of induced stem cells (ipscs, cells that are the primary source of neural stem cells), NSC cells (precursor cells of DPC) and DPC cells (dopamine neuron induced differentiation culture for 24 hours). Extracting total RNA in cells by using a molecular biology method, and screening a candidate gene group by combining high-throughput RNA sequencing with a bioinformatics method. Subsequently, a group of related genes for regulating the nerve cell function and nerve differentiation is further screened by a bioinformatics method, differential expression of the group of genes is verified in different cell samples by real-time quantitative PCR, and 12 related genes such as CRH, FST, GLI1, POSTN, PYCR1, RELN, SLC16A9, SLC7A2, ST8SIA3, SLC7A5, STK32B and FGF17 are finally determined. The group of genes can be used as markers for identifying and classifying DPC cells, can also be used as a detection standard for quality control in clinical DPC cell preparation, and has important application value.
The invention provides the application of one or more genes, coding genes or biological precursors thereof in the identification and classification of DPC cell products in CRH, FST, GLI1, POSTN, PYCR1, RELN, SLC16A9, SLC7A2, ST8SIA3, SLC7A5, STK32B and FGF 17.
The invention provides a diagnostic preparation of tipkinson, which comprises a fluorescent quantitative PCR method, a digital PCR method, a gene chip method, an in-situ hybridization method or a flow cytometry method for detecting the expression quantity of a marker gene, a coding gene thereof and a biological precursor in a cell by the gene chip method, the in-situ hybridization method or the flow cytometry method; the marker gene is one or more of CRH, FST, GLI1, POSTN, PYCR1, RELN, SLC16A9, SLC7A2, ST8SIA3, SLC7A5, STK32B and FGF 17.
The fluorescence quantitative PCR method is characterized in that a PCR product is marked through a fluorescent dye or a fluorescence-marked specific probe so as to realize the real-time online tracking of the generation process of the product in the PCR reaction, and the fluorescence value of the product is analyzed through corresponding software so as to deduce the initial concentration of a sample to be detected. By the fluorescent quantitative PCR technology, the generation process of products in the traditional PCR can be monitored in real time, the result accuracy reduction caused by the PCR reaction reaching a platform stage is avoided, meanwhile, the absolute quantification is truly realized, and the template copy number in a sample can be measured. At present, a fluorescent quantitative PCR detection system is mature, and compared with the traditional PCR reaction, the fluorescent quantitative PCR detection system has the advantages of quick reaction, good repeatability, high sensitivity, strong specificity, clear result and the like.
Digital PCR is a new method for nucleic acid detection and quantitative analysis, and can realize absolute quantification and detection of low-abundance genes. The working principle of digital PCR is to divide a DNA or cDNA sample into many separate, parallel PCR reactions, and a single molecule can be amplified by a million fold or more. Digital PCR has the unique advantage of being useful for generating absolute counts of target molecules in a sample without the need for standards or internal controls.
Gene chips (Gene chips), also known as DNA microarrays (DNA microarrays), generally fall into three main categories: 1) the nucleic acid probe or cDNA fragment is immobilized on the surface of a polymer such as a nylon membrane or nitrocellulose membrane by physical action, and then detected by an autoradiography technique by hybridizing an isotope-labeled target gene thereto. 2) A nucleic acid probe or cDNA fragment array is fixed on a glass material by a spotting method, and then hybridized with a target gene labeled with fluorescence, and detected by the intensity of a fluorescence signal. 3) Oligonucleotide probe arrays are directly synthesized on a hard surface of a glass material or the like, and then hybridized with a target gene labeled with fluorescence to detect a fluorescent signal. In recent years, gene chips have been widely used for clinical disease diagnosis as a large-scale, high-throughput detection technique.
In situ hybridization is a process of performing a precise quantitative mapping of a specific nucleic acid sequence by using a specifically labeled DNA or RNA nucleic acid of known sequence as a probe to perform a complementary hybridization on the sequence with a nucleic acid in a cell or tissue section. The in situ hybridization technique can detect and observe nucleic acid at the original position of cells or tissues, but the detection sensitivity and specificity are not high.
The products expressed by genes such as CRH, FST, GLI1, POSTN, PYCR1, RELN, SLC16A9, SLC7A2, ST8SIA3, SLC7A5, STK32B and FGF17 in the DPC cell products are detected by a fluorescent quantitative PCR method, and the products contain a pair of primers for specifically amplifying the genes; the gene chip comprises a probe hybridized with the gene transcription product, the coding gene thereof, the biological precursor and other nucleic acid sequences.
The invention aims to provide a fluorescent real-time quantitative PCR kit for detecting and identifying DPC cell products, which is characterized in that the kit detects CRH, FST, GLI1, POSTN, PYCR1, RELN, SLC16A9, SLC7A2, ST8SIA3, SLC7A5, STK32B, FGF17 and other genes and biological precursors thereof, specific upstream and downstream primers are adopted, and specific primer sequences are shown in Table 1 (the primer sequence number is singular for Forward primer and double for Reversed primer).
Table 1:
the PCR kit adopts SYBR Green fluorescent dye, is suitable for all types of fluorescent quantitative gene amplification instruments in the market at present, has the characteristics of high sensitivity, rapid and accurate quantification, stable performance and the like, and has good market prospect.
The SYBR Green fluorescent quantitative PCR kit comprises the following components: specific primers, internal reference primers, fluorescent quantitative PCR reaction mixtures (SYBR Green, etc.). The specific primers comprise an upstream primer and a downstream primer, and the internal reference primers are beta-actin and GAPDH internal reference primers.
The invention also provides a gene chip of the DPC cell product, which comprises a probe hybridized with the nucleic acid sequences of CRH, FST, GLI1, POSTN, PYCR1, RELN, SLC16A9, SLC7A2, ST8SIA3, SLC7A5, STK32B, FGF17 and other gene transcripts and encoding genes, biological precursors and the like.
The present invention is further illustrated below with reference to specific examples, which are intended to be illustrative only and are not to be construed as limiting the invention. It will be appreciated by those skilled in the art that various changes, modifications, substitutions and alterations can be made in these embodiments without departing from the principles and spirit of the invention, the scope of which is defined in the claims and their equivalents.
The following examples are examples of experimental methods not indicating specific conditions, and the detection is usually carried out according to conventional conditions or according to the conditions recommended by the manufacturers.
Example 1 sample preparation for RNA extraction in induced Stem cells, NSC cells and DPC cells and high throughput sequencing of RNA
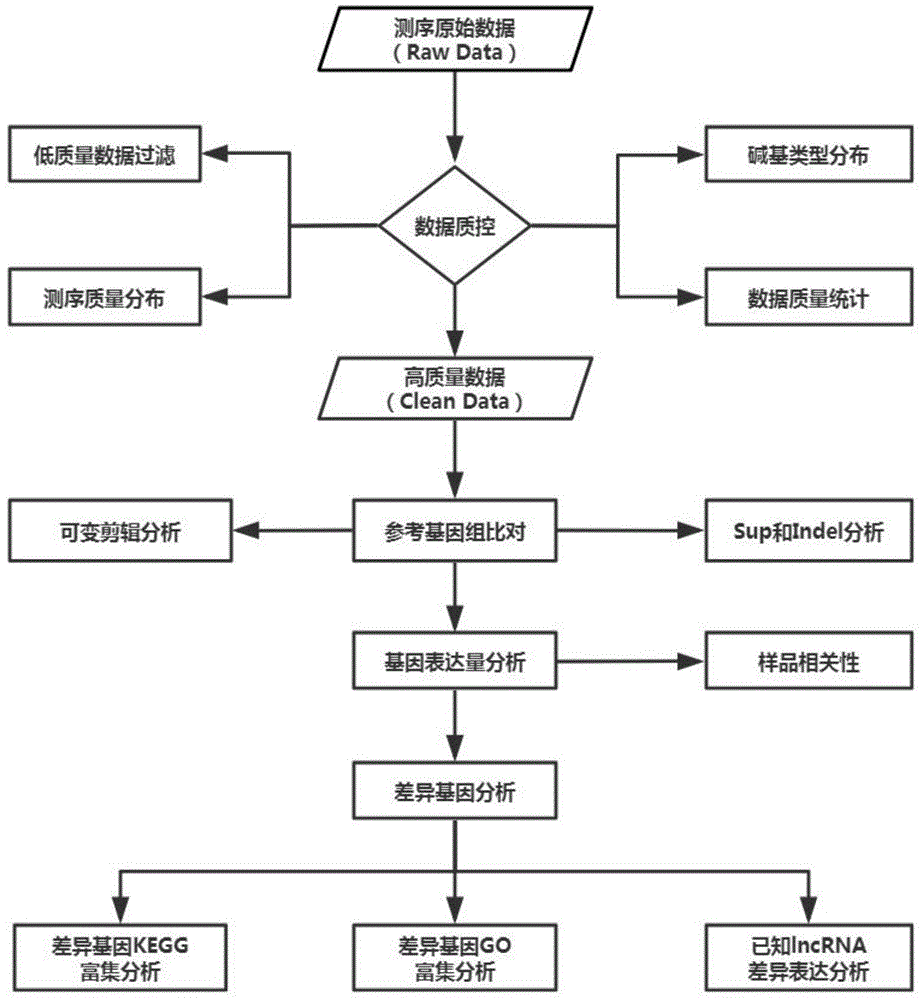
The specific experimental scheme for high-throughput sequencing RNA sample preparation is shown in figure 1. Total RNA was extracted from induced stem cells (iPSC, cells derived from neural stem cells initially), NSC cells (DPC precursor cells) and DPC cells (dopamine neuron induced differentiation culture for 24 hours) as required using the RNeasy MinElute clear Kit (Cat number/ID: 74204) Kit from Qiagen.
After the total RNA of the sample is extracted, the quality detection of the extracted total RNA sample mainly comprises 3 methods:
1) analyzing the degradation degree of RNA and whether pollution exists by agarose gel electrophoresis;
2) the purity of the Nanodrop detection RNA (OD260/280 ratio);
3) labchip accurately detected the integrity of the RNA (results are shown in FIG. 2).
After the RNA sample is qualified, eukaryotic mRNA is enriched by magnetic beads with oligo (dT) (if prokaryotic, mRNA is enriched by removing rRNA with a kit). Fragmentation buffer was then added to break the mRNA into short fragments, single-stranded cDNA was synthesized using a hexabasic random primer (random hexamers) using the mRNA as a template, and double-stranded cDNA was then synthesized by adding buffer, dNTPs, DNA polymerase I and RNaseH, followed by purification of the double-stranded cDNA using AMPure XP beads. The purified double-stranded cDNA is firstly subjected to end repair, A tail and sequencing joint connection, and then AMPure XPbeads are used for fragment size selection. The second strand of the U-containing cDNA was then degraded with USER enzyme so that the final sequencing information was derived from the first strand cDNA, thereby preserving the strand directionality of the mRNA. And finally, carrying out PCR amplification, and purifying the PCR product by using AMPure XP beads to obtain a chain specificity cDNA library.
After the library is constructed, firstly using the qubit3.0 to carry out preliminary quantification, diluting the library to 1ng/uL, then using the Qsep100 to detect the insert size of the library, and after the insert size meets the expectation, using a Q-PCR method to accurately quantify the effective concentration of the library (the effective concentration of the library is more than 2nM) so as to ensure the quality of the library. And after the library is qualified, carrying out Illumina HiSeq sequencing on different libraries according to the effective concentration and the requirement of the target offline data volume.
Example 2 analysis of data obtained after high throughput sequencing of RNA
Filtering off-line data to obtain Clean reads, comparing the Clean reads with a reference genome sequence, counting the reads contained in each gene according to the position of a genome compared by an annotation file and the reads of the genome, obtaining a differential expression gene by statistical test, and finally performing functional annotation and GO and KEGG enrichment test on the differential expression gene to obtain a GO and KEGG set enriched by the differential expression gene, wherein the overall flow is shown in figure 2. In the specific analysis, RJ-1 (iPSC-induced stem cell) as the standard maternal cell was compared with the gene expression in RJ-2(NSC cell) and RJ-3(DPC cell), and the differentially expressed genes obtained by the analysis are shown in volcanic images 3A and 3B in FIG. 3. Each point in the differential expression volcano graph represents a gene, and the abscissa represents a logarithmic value of the expression quantity difference multiple of a certain gene in two samples; the ordinate represents the negative logarithm of the statistical significance of the change in gene expression level. The larger the absolute value of the abscissa is, the larger the expression quantity fold difference between the two samples is; the larger the ordinate value is, the more significant the differential expression is, and the more reliable the differential expression gene obtained by screening is. For clarity, the adjacent boundaries are demarcated in FIGS. 3A and 3B by dashed lines running through the coordinate system, wherein the left-hand points of the two dashed lines represent Down-Regulated Genes (Down-Regulated Genes), the right-hand points of the two dashed lines represent Up-Regulated differentially expressed Genes (Up-Regulated Genes), and non-DEGs are between the two dashed lines.
Example 3 analytical screening of 12 Up-regulated expression genes in DPC cells
The differentially expressed genes selected in example 2 were further analyzed to screen for marker gene combinations specific to DPC cells. First, from the analysis results in example 2, we screened DPC cells for genes whose expression is up-regulated relative to NSC cells, and the range of these genes was screened using a threshold value of 2.4-fold increase in expression level. Then, we analyzed the functions of the genes selected above using the Pubmed literature database of the NCBI website, and selected genes related to the development and differentiation of nerve cells or the functions of nerve cells, and the results are shown in table 2. From the above analysis, a total of 12 genes were identified as candidate genes for cell-specific expression of DPC, including CRH, FST, GLI1, POSTN, PYCR1, RELN, SLC16A9, SLC7A2, ST8SIA3, SLC7A5, STK32B and FGF 17.
Table 2:
example 4 detection and confirmation of the expression level of the highly expressed genes in 12 DPC cells in iPSC cells, NSC cells and DPC cells.
In order to further verify the accuracy of DPC specific expression genes screened by RNA high-throughput sequencing, different cell samples of iPSC cells (female parent), NSC cells (iPSC induced differentiated cells) and DPC cells (NSC cells are induced and differentiated for 24 hours by dopamine neurons) are respectively prepared, total RNA is extracted, and the expression amounts of the 12 genes in the cells are detected and compared by a fluorescent quantitative PCR method. The results of analyzing and comparing the expression levels of the above genes in iPSC cells and NSC cells, and NSC cells and DPC cells are shown in fig. 4A and 4B, respectively.
4.1 materials
iPSC cells, NSC cells and DPC cell samples, each cell approximately 5X 10⁶And (4) respectively.
4.2 step and method
4.2.1 extraction of Total RNA from cells
Total RNA extraction was performed using the RNeasy MinElute clear Kit (Cat number/ID: 74204) from Qiagen, according to the product instructions. RNA quality determination criteria: the OD260/OD280 of the RNA sample was between 1.7 and 2.2.
4.2.2 reverse transcription Synthesis of cDNA
The standard reverse transcription method was used, briefly as follows:
using a special reverse transcription kit, about 1000ng of total RNA was reverse transcribed to synthesize cDNA. The reverse transcription primer adopts a special primer provided by a kit.
4.2.3 primer design
On-line primer design software is adopted, and the primer is synthesized by Beijing Optimalaceae Biotechnology Co. Specific primer sequences are shown in the primer sequences in table 1.
4.2.3 fluorescent quantitative PCR
Amplification was performed with a Power Green PCR Master Mix (Invitrogen, cat # 4367659) and the specific experimental procedures were performed according to the product instructions. The amplification procedure was: 95 degrees 10min, (95 degrees 15sec, 60 degrees 60sec) × 45 cycle. Taking 2-5 mul of cDNA of a sample to be detected as a template, and respectively carrying out PCR amplification by using a target gene specific primer and a universal primer provided by the kit. The prepared samples were subjected to relative quantitative analysis of data using a Quantagene q325 fluorescent quantitative PCR instrument using the 2- Δ CT method.
4.3 results of the experiment
The expression quantities of the 12 genes in different cells are relatively quantified and comparatively analyzed by a fluorescent quantitative PCR method, so that the expression quantities of the 12 genes in the iPSC cells and the NSC cells can be determined to completely accord with the expression quantity change trend in RNA high-throughput sequencing. As can be seen from fig. 4A, comparing the expression levels of the genes in iPSC and NSC, the expression levels of ST8SIA3, CRH, FGF17, SLC16a9, and RELN genes in NSC cells were increased relative to iPSC cells, while the expression levels of SLC7a5, FST, GLI1, STK32B, POSTN, SLC7a2, and PYCR1 were decreased relative to iPSC cells, and these results completely coincided with the trend of the results of RNA high-throughput sequencing. Furthermore, as can be seen from fig. 4A, comparing the gene expression levels in NSC cells and DPC cells, the expression trends of FST, CRH, GLI1, STK32B, POSTN, SLC16a9, RELN were consistent with those in RNA high throughput sequencing, and showed increased expression relative to NSC cells, whereas SLC7a5, ST8SIA3, FGF17, SLC7a2, and PYCR1 showed no significant difference or small decrease relative to NSC cells. Therefore, the result of gene expression quantitative PCR basically verifies the accuracy of high-flux RNA.
It should be noted that the above-mentioned embodiments are only preferred embodiments of the present invention, and do not limit the present invention in any way, and all technical solutions obtained by replacing or changing the technical solutions according to the present invention are covered in the protection scope of the present invention.
Reference documents:
1.Tian YY,Tang CJ,Wu J,Zhou JS.Parkinson's disease in China.Neurol Sci.2011Feb;32(1):23-30.
2.Malek N.Deep Brain Stimulation in Parkinson's Disease.Neurol India.2019Jul-Aug;67(4):968-978.
sequence listing
<110> Wuhan Rui Jian medicine science and technology Limited
<120> DPC cell identification and classification marker gene, screening method and application
<141> 2020-12-24
<160> 24
<170> SIPOSequenceListing 1.0
<210> 1
<211> 24
<212> DNA
<213> Artificial Sequence
<400> 1
gcagcagcaa cacaatgtta ttcg 24
<210> 2
<211> 23
<212> DNA
<213> Artificial Sequence
<400> 2
tggcattctc tttggctcag acc 23
<210> 3
<211> 21
<212> DNA
<213> Artificial Sequence
<400> 3
gctgctgctc tgccagttca t 21
<210> 4
<211> 24
<212> DNA
<213> Artificial Sequence
<400> 4
tgtgttgtca ttcacgtcct cctc 24
<210> 5
<211> 22
<212> DNA
<213> Artificial Sequence
<400> 5
acatcaacag cgagcacatc ca 22
<210> 6
<211> 22
<212> DNA
<213> Artificial Sequence
<400> 6
cgaggcgtga gtatgacttc cg 22
<210> 7
<211> 24
<212> DNA
<213> Artificial Sequence
<400> 7
ccatgtcatt gaccgtgtgc ttac 24
<210> 8
<211> 24
<212> DNA
<213> Artificial Sequence
<400> 8
gcctccaata tgtccgatgt gatg 24
<210> 9
<211> 21
<212> DNA
<213> Artificial Sequence
<400> 9
ttcacagcag caggcgtctt g 21
<210> 10
<211> 23
<212> DNA
<213> Artificial Sequence
<400> 10
cacagccagg aagagcacat cac 23
<210> 11
<211> 23
<212> DNA
<213> Artificial Sequence
<400> 11
tccactgtga gacaagcggt tac 23
<210> 12
<211> 24
<212> DNA
<213> Artificial Sequence
<400> 12
tcctccatcg gtagagtagt ccaa 24
<210> 13
<211> 24
<212> DNA
<213> Artificial Sequence
<400> 13
aacagtgacc attacgtgcc agta 24
<210> 14
<211> 23
<212> DNA
<213> Artificial Sequence
<400> 14
ccacaatcag caagcatcca tcc 23
<210> 15
<211> 23
<212> DNA
<213> Artificial Sequence
<400> 15
tggttgatgc cactgccatg atc 23
<210> 16
<211> 24
<212> DNA
<213> Artificial Sequence
<400> 16
agtctaagag cccacccaac aagg 24
<210> 17
<211> 24
<212> DNA
<213> Artificial Sequence
<400> 17
tgacagtggc atcagagtga agag 24
<210> 18
<211> 24
<212> DNA
<213> Artificial Sequence
<400> 18
aaggtccaga atgagtggca agaa 24
<210> 19
<211> 22
<212> DNA
<213> Artificial Sequence
<400> 19
aggaggcagt ggacatcgta gg 22
<210> 20
<211> 24
<212> DNA
<213> Artificial Sequence
<400> 20
cagagcagga ggttggaaca gaac 24
<210> 21
<211> 24
<212> DNA
<213> Artificial Sequence
<400> 21
tcctggtcaa tctgtggtac tcct 24
<210> 22
<211> 24
<212> DNA
<213> Artificial Sequence
<400> 22
ctggcttgat gtctctgtgg atga 24
<210> 23
<211> 24
<212> DNA
<213> Artificial Sequence
<400> 23
cctggagagg aactgagtgt cacc 24
<210> 24
<211> 24
<212> DNA
<213> Artificial Sequence
<400> 24
gcagactgag ggagatccga gaag 24