Disclosure of Invention
In view of the above, the present invention provides a simplified calculation method based on coronary multimode image crack formation and propagation and an evaluation system for plaque rupture risk quantification.
The technical scheme of the invention is as follows:
a simplified calculation method based on coronary artery multimode image crack formation and propagation and an evaluation system for plaque rupture risk quantification comprise the following steps:
step 1: calculating mechanical functional indexes of the superficial wall of the blood vessel on the coronary angiography time sequence image;
step 2: determining a relatively high risk position along the longitudinal direction of the blood vessel according to the distribution result of the mechanical functional indexes of the superficial wall of the diseased blood vessel in the cardiac cycle, and calculating a fatigue risk coefficient formed by local cracks of the superficial wall;
and step 3: at the relatively high risk position, acquiring a risk coefficient of virtual crack expansion to plaque failure by utilizing a virtual crack expansion rate of an Optical Coherence Tomography (OCT) plaque cross section and combining anatomical information such as plaque components;
and 4, step 4: based on a bilinear risk accumulation theory, weight proportionality constants of the two parts are set, and the sum of risk coefficients of virtual crack formation and expansion in the plaque rupture process is calculated to serve as a quantitative index for measuring the individualized plaque rupture risk of a patient.
Preferably, the step 1 further comprises:
step 101: reading a contrast time sequence image of the right coronary artery main branch by an image receiving module, and determining the starting position and the ending position of the interested blood vessel by the bifurcation anatomical landmark points;
step 102: selecting a plurality of characteristic moments of the contrast images in a complete period, and performing two-dimensional segmentation and three-dimensional reconstruction on the blood vessels of interest in the contrast images at the moments;
step 103: establishing a one-to-one correspondence relationship of point clouds on a vessel wall for the interested vessels of different forms at adjacent moments according to a point-by-point registration principle;
step 104: selecting a moment as an initial moment according to the one-to-one correspondence of the blood vessel point clouds, and calculating the mechanical functional indexes of the superficial wall of the lesion blood vessel in the whole cardiac cycle; the above indexes include: for two-dimensional blood vessel contour, diameter change rate and form change ratio parameters are adopted, and for three-dimensional blood vessel, local stress strain extreme value index is adopted.
Preferably, the
step 2 further comprises: calculating the index by combining the failure threshold values of the corresponding indexes
And a threshold value
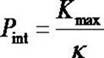
Is used as the fatigue risk coefficient of the formation of the virtual crack of the superficial wall of the coronary artery
:
。
Preferably, the step 3 further comprises:
step 301: obtaining a distribution result of mechanical functional indexes of the superficial wall of a diseased blood vessel based on the coronary angiography time sequence image, and reading an optical coherence tomography image from an image receiving module according to an OCT image at a position with a relatively high risk in the longitudinal direction of the blood vessel;
step 302: according to the imaging characteristics of different plaque components in an OCT image, carrying out region segmentation on the component outline of the OCT image, wherein the component outline comprises calcification, fiber, lipid, mixed components, macrophage and cholesterol crystal;
step 303: on the basis of the partition of the transverse section patch organization components, the grid discretization of each organization is further realized, and the calculation of stress strain is realized by using a finite element method;
step 304: forming a virtual crack at the maximum value of the stress strain of the cross section, and calculating the expansion rate and the expansion path of the virtual crack based on the damage fracture mechanics theory;
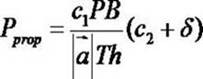
step 305: calculating the risk coefficient of virtual crack propagation according to the virtual crack advancing direction and length and combining the cross-section plaque component information and whether the crack penetrates through the fiber cap and reaches the plaque necrosis core
:
Wherein
Taking a value of 0 or 1, and determining whether the virtual crack reaches the plaque necrosis core;
is plaque burden;
is the virtual crack length;
is the thickness of the fiber cap;
,
is a constant number of times, and is,
determined by plaque anatomical information and rupture mechanism, can be determined through standard specimen experiments or large specimen data statistics;
the value range is 0-1, and is related to the inflammation degree of the fibrous cap.
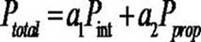
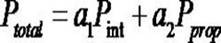
Preferably, the step 4 further comprises: based on a bilinear risk accumulation theory, considering the weight proportionality constants of two parts, calculating the risk coefficient sum of the virtual crack formation and expansion of the plaque as a quantitative index for measuring the individual plaque rupture risk of a patient:
wherein
,
The weight proportionality constants of the virtual crack formation part and the virtual crack propagation part are respectively.
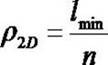
Preferably, in step 103, the point cloud density of the two-dimensional lumen contour is determined by the shorter sides at two sides:
(ii) a And for the point cloud density of the structured grid of the three-dimensional pipe wall, the ratio of the circumferential distance to the longitudinal distance between two points is kept between 0.8 and 1.1.
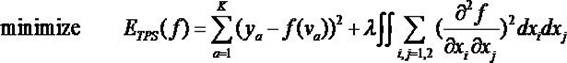
Preferably, in the step 103, a thin-plate spline robust point matching algorithm can be applied to realize the non-rigid registration of the two-dimensional lumen contour points by minimizing the thin-plate spline energy function:
wherein
Is a function of the mapping of the data to the image,
is a set of points to be registered,
is a set of corresponding points, is
Two coordinate directions.
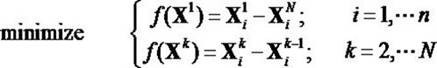
Preferably, in step 103, a four-dimensional superficial wall dynamics method is used for point registration, and the registration of the three-dimensional vessel wall points is realized by minimizing the sum of distances of nodes of the isomorphic grid:
where X is a row vector composed of the global Cartesian coordinate components of all nodes in each configuration
;
Is the node id number, and n is the maximum node number;
n is the maximum number of configurations in a cardiac cycle that are discrete in time.
Preferably, in step 302, the imaging of the three-layer membranous structure is not complete due to the weak OCT penetration ability, and the size of the current layer outer-middle intima diameter can be obtained by interpolation according to the size of the outer-middle intima diameter of the proximal and distal normal segments of the blood vessel and the number of layers of the current cross section, so as to construct a complete plaque cross section model.
Compared with the prior art, the invention has the beneficial effects that: the risk quantitative evaluation consisting of crack formation and crack propagation is realized by utilizing the computational mechanics theory to truly carry out the whole process that the coronary plaque is cracked and the crack penetrates through the fiber cap by the superficial wall tearing. The method makes up the defect of plaque risk assessment based on the single-mode image, and quantitatively assesses the plaque rupture risk more comprehensively.
Detailed Description
Embodiments of the present invention will be described in detail below with reference to the accompanying drawings. It will be appreciated by those of skill in the art that the following specific examples or embodiments are illustrative of a series of preferred arrangements of the invention to further explain the principles of the invention, and that such arrangements may be used in conjunction or association with one another, unless it is specifically stated that some or all of the specific examples or embodiments are not in association or association with other examples or embodiments. Meanwhile, based on the embodiments of the present invention, all other embodiments obtained by a person of ordinary skill in the art without any creative effort belong to the protection scope of the present invention.
Example 1:
the invention provides a simplified calculation method of risk quantification indexes of crack formation and crack propagation in a patient individualized plaque rupture process based on coronary artery multimode images, and the calculation method is explained in detail below by taking coronary angiography and optical coherence tomography as sources of the coronary artery multimode images respectively according to a specific example. It should be understood by those skilled in the art that the coronary image of a lesion blood vessel with a specific stenosis degree and the OCT image data of a specific plaque component are used as an example only in the present embodiment, and this specific lesion coronary and plaque type or corresponding image modality should not be understood as a limitation to the scope of the present invention.
In one embodiment of the invention, the method is described as follows:
step 1, calculating mechanical functional indexes of a superficial wall of a blood vessel on a coronary angiography time sequence image;
step 2, according to the distribution result of the mechanical functional indexes of the superficial wall of the lesion blood vessel in the cardiac cycle, determining a relatively high risk position along the longitudinal direction of the blood vessel (wherein the relatively high risk position refers to the distribution situation of the calculation result of the mechanical functional indexes by the whole blood vessel, and the position in the blood vessel with the result larger than the threshold is determined to be the relatively high risk position by adopting a median or an upper quantile threshold), and calculating the fatigue risk coefficient formed by the local cracks of the superficial wall;
step 3, obtaining a risk coefficient from virtual crack expansion to plaque failure by utilizing the virtual crack expansion rate of the OCT plaque cross section and combining anatomical information such as plaque components and the like at the relatively high risk position;
and 4, calculating the sum of risk coefficients of virtual crack formation and expansion in the plaque rupture process based on a weight proportion constant of two parts (the two parts comprise a first part and a second part, the first part is a mechanical functional index based on the contrast dynamic tube wall and is used for evaluating the rupture risk on the superficial blood vessel surface, and the second part is the rupture risk of crack expansion from the plaque internal lipid core to the blood vessel surface wall based on intravascular optical coherence tomography) based on a bilinear risk accumulation theory, and the sum is used as a quantitative index for measuring the individualized plaque rupture risk of a patient.
In a specific embodiment, the step 1 further comprises:
step 101, an image receiving module reads a contrast timing image of a right coronary artery main branch, and determines the start and stop positions of the interested blood vessel by using the bifurcation anatomical landmark point. Preferably, a coronary angiogram containing a complete cardiac cycle and an angular difference between two body positions greater than 25 ° is referenced to 17-segment landmarks defined by the american heart association;
step 102, selecting a plurality of characteristic moments in a complete cycle, (wherein the characteristic moments are determined according to a cardiac cycle, a motion characteristic of a blood vessel or an electrocardiogram, such as an end-diastole cardiac phase, an end-systole cardiac phase or a middle-diastole cardiac phase), and performing two-dimensional segmentation, three-dimensional reconstruction and the like on a blood vessel of interest in the imaging at the moments. Preferably, characteristic moments such as end diastole, rapid ejection frame, end systole, end rapid inflow and end rest of the cardiac cycle.
103, establishing a one-to-one correspondence relationship of point clouds on the vessel wall for the interested vessels in different forms at adjacent moments according to a point-to-point registration principle. Preferably, aiming at a two-dimensional blood vessel contour, a thin plate spline robust point matching algorithm is adopted for carrying out point non-rigid registration, and aiming at a three-dimensional blood vessel wall, a four-dimensional superficial wall dynamics method is adopted for carrying out point registration;
104, according to the one-to-one correspondence relationship of the blood vessel point clouds, selecting a moment as an initial moment, and calculating the mechanical functional indexes of the superficial walls of the diseased blood vessels in the whole cardiac cycle; these indicators include: for example, for a two-dimensional blood vessel contour, parameters such as a diameter change rate and a form change ratio (fig. 2) are adopted, and for a three-dimensional blood vessel, indexes such as a local stress strain extreme value are adopted; preferably, the initial moment is selected to be at the end of rest or at the end of contraction, etc.
Fig. 2 is a schematic diagram depicting a result of a kinetic index calculation of a two-dimensional coronary superficial wall of a coronary contrast-based cardiac cycle, according to an example embodiment. Determining a plurality of key moment images in a cardiac cycle according to two-dimensional coronary angiography, carrying out contour segmentation, carrying out non-rigid registration on contour points at different moments by using a thin plate spline robust point matching algorithm, and then calculating the diameter change rate between adjacent moments (steps 102-104) for evaluating the calculation of the risk coefficient of crack formation of the coronary artery superficial. For example, the small yellow horizontal line in the three contrast images represents the length change of the diameter at different time points, and the diameter size is determined when the yellow vertical line (the diameter) in the lower panel image intersects with three curves (the diameter length sequence of three cardiac phases).
In a specific embodiment, the step 2 further comprises:
step 201, calculating the index by combining the failure threshold value of the corresponding index (the corresponding index is a mechanical functional index, such as stress and strain of the superficial wall of the blood vessel)
And a threshold value
Is used as the fatigue risk coefficient of the formation of the virtual crack of the superficial wall of the coronary artery
:
Here, the corresponding threshold value
The index value may be obtained from a cutoff value when data failure occurs with a large sample or from a standard sample when data failure occurs.
In a specific embodiment, the step 3 further comprises:
301, obtaining a distribution result of mechanical functional indexes of superficial walls of a diseased blood vessel based on the coronary angiography time sequence image, and reading an optical coherence tomography image from an image receiving module in an OCT image at a position with a relatively high risk in the longitudinal direction of the blood vessel; preferably, the OCT image lumen is flushed with clean blood and has no fault on the contour;
step 302, according to the imaging characteristics of different plaque components in the OCT image, performing region segmentation on the component profiles (i.e. different plaque components, such as lipid, fiber, calcification and the like) of the different plaque components, wherein the component profiles include calcifications, fibers, lipids, mixed components, macrophages, cholesterol crystals and the like; preferably, the automatic segmentation can identify each component in the OCT image through large sample deep learning;
303, further realizing mesh discretization of each tissue and calculating stress strain by using a finite element method on the basis of the partition of the cross-section patch tissue components; preferably, based on the principle that the shape of the lumen is changed after being pressed, a layer of fat pad structure with the same thickness is added on the plaque adventitia, boundary conditions such as strength constraint and the like are applied, and the stress-strain distribution of the lumen surface of the cross section is consistent with the distribution result of the superficial wall at the position as a convergence criterion, so that the stress-strain of the cross section is calculated;
step 304, forming a virtual crack at the maximum value of the cross section stress strain, and calculating the expansion rate and the expansion path of the virtual crack based on the mechanical theory of damage and fracture (figure 3); preferably, virtual crack advancing is carried out by adopting an expansion finite element method, and the damage criterion can be a maximum principal stress criterion or a maximum principal strain criterion;
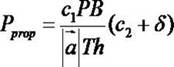
step 305, calculating a risk coefficient of virtual crack propagation according to the virtual crack advancing direction and length, the cross-section plaque component information, and key factors such as whether the crack penetrates through the fiber cap and reaches the plaque necrosis core
:
Here, the first and second liquid crystal display panels are,
taking a value of 0 or 1, and determining whether the virtual crack reaches the plaque necrosis core;
is plaque burden;
is the virtual crack length;
is the thickness of the fiber cap;
,
is a constant number of times, and is,
the plaque rupture mechanism is determined by plaque anatomical information and can be determined through standard specimen experiments or large sample data statistics;
the value range is 0-1, and is related to the inflammation degree of the fibrous cap.
FIG. 3 is a schematic diagram illustrating cross-sectional plaque crack propagation failure results based on optical coherence tomography, according to an example embodiment. The virtual crack propagation result is calculated by optical coherence tomography at a certain high-risk position determined after a calculation result is formed based on the two-dimensional contrast coronary artery superficial wall crack, and then by means of plaque component segmentation, grid generation, finite element model construction, boundary condition application and the like (steps 301-304), and is used for evaluating the calculation of the crack propagation risk coefficient inside the plaque. For example, the example crack propagates from a superficial to a necrotic core, then
A value of 1 represents a high risk level.
In a specific embodiment, the step 4 further comprises:
step 401, based on bilinear risk accumulation theory, considering the weight proportionality constants of the two parts, calculating the sum of risk coefficients of plaque virtual crack formation and propagation (fig. 4), as a quantitative index for measuring the individual plaque rupture risk of a patient:
here, the first and second liquid crystal display panels are,
,
the weight proportionality constants of the virtual crack formation part and the virtual crack propagation part are respectively.
Fig. 4 is a graph illustrating an example result of a quantified curve of mechanical indicators of a diseased coronary plaque based on a multimodal image and a risk of virtual crack formation and propagation according to an example embodiment. For example, four double-fold lines represent four different coronary plaques, and the abscissa is a plaque risk quantification index, and the plaque A with the risk degree<B<C<D. The first broken line point is on a broken line and represents a risk coefficient of the formation of the coronary artery superficial wall cracks; and the second fold line point, which falls on the upper solid line, represents the risk factor after the coronary plaque has been formed by the crack and has failed to propagate. For example, the first inflection point of plaque B is

Is the risk factor for the formation of cracks in the superficial wall of the coronary artery, the value of which is less than the plaque a; however, as the crack propagates, the risk factor for plaque B increases dramatically, making the overall plaque risk factor rather greater than plaque a.
In one specific embodiment, in step 103, the point cloud density of the two-dimensional lumen contour is determined by two shorter sides (where the two shorter sides refer to two side boundaries of the blood vessel in the contrast image, and the total length of the inner contour of the curved blood vessel is smaller than the total length of the outer contour):
(ii) a And for the point cloud density of the structured grid of the three-dimensional pipe wall, the ratio of the circumferential distance to the longitudinal distance between two points is kept between 0.8 and 1.1;
in a specific embodiment, in step 103, a thin-plate spline robust point matching algorithm (an authoritative and practical "thin-plate spline robust point matching algorithm" in the registration algorithm is applied to implement "point-by-point registration to establish a one-to-one correspondence relationship of point clouds on the tube wall" in step 103, and a matching problem between an upper point of a blood vessel at a previous time and an upper point at a next time at different cardiac moments) is established, and non-rigid registration of the two-dimensional lumen contour points is implemented by minimizing a thin-plate spline energy function:
here, the
Is a function of the mapping of the data to the image,
is a set of points to be registered,
is a set of corresponding points, is
Two coordinate directions;
in a specific embodiment, in step 103, a four-dimensional superficial wall dynamics method is used for point registration, and the registration of the three-dimensional vessel wall points is realized by minimizing the sum of distances of nodes of the isomorphic mesh:
where X is a row vector of global Cartesian coordinate components of all nodes in each configuration
;
Is the node id number, and n is the maximum node number;
n is the maximum number of configurations in a cardiac cycle that are discrete in time.
In a specific embodiment, in step 302, the imaging of the three-layer membranous structure is not complete due to the weak OCT penetration ability, and the size of the current outer-middle intima diameter can be obtained by interpolation according to the sizes of the outer-middle intima diameters of the proximal and distal normal segments of the blood vessel and the number of layers of the current cross section, so as to construct a complete plaque cross section model.
Example 2:
in this embodiment, the present invention further provides a simplified calculation method based on coronary multimode image crack formation and propagation and an evaluation system for plaque rupture risk quantification (as shown in fig. 1), the system comprising:
the image input module is mainly used for inputting coronary artery multimode images, including coronary angiography and coronary artery intracavity images (optical coherence tomography, intravascular ultrasound imaging and the like);
the image processing module is mainly used for performing key frame image screening, image enhancement, contour segmentation, plaque component identification, grid generation, spatial position corresponding relation among multimode images and the like on the interested blood vessels;
the lesion coronary plaque quantification module is mainly used for describing anatomical indexes including a diameter stenosis rate based on radiography, a minimum lumen diameter area and the like; and plaque load, lipid, calcification score, inflammation degree and other indexes based on the intracavity image;
the risk indicator calculation module comprises two sub-modules: namely a virtual crack formation risk indicator and a virtual crack propagation risk indicator. The former is calculated based on coronary angiography, while the latter is calculated based on the cross-sectional profile of the image plaque within the vessel lumen. The specific calculation methods of the two risk indicators are as described in embodiment 1; further weighting the virtual crack formation risk index and the virtual crack propagation risk index to obtain a total risk index of the lesion vascular plaque rupture;
and the report generation module is mainly used for visually displaying the quantitative indexes of the lesion coronary plaque and the risk quantitative indexes of the plaque potential rupture. The latter draws two linear graphs according to the risk indexes of the virtual crack formation and propagation of the plaque to indicate the risk degree of plaque rupture.
Preferably, the image processing module comprises a semi-automatic or full-automatic screening of interested images, such as semi-automatic or full-automatic elimination of defect images like contour fault, contrast frame skipping and the like, or a screening of key images like rapid ejection frames and the like; semi-automatically or fully automatically screening (positioning) plaque cross section images at relatively high risk positions while calculating risk indexes formed on the basis of contrast coronary superficial cracks;
preferably, the system comprises a traditional algorithm or a deep learning algorithm for image segmentation and registration, a spatial position corresponding relation between multimode images is generated according to anatomical landmark points and central line coordinates, and the system also comprises rapid segmentation and plaque component identification presenting semi-automatic or full-automatic blood vessel contours, and rapid calculation of lesion coronary plaque quantification indexes;
preferably, the system calculates virtual crack formation and propagation and overall risk factor indicators, while giving corresponding reference indicators for comparing the risk level of potential plaque rupture.
When the system runs, the image input module simultaneously acquires coronary angiography and intracavity image data, firstly, the coronary angiography image is used for carrying out segmentation and other processing on the interested blood vessel to obtain an anatomical quantitative index of the lumen of a diseased blood vessel, then, the registration algorithm is used for realizing the mechanical functional index calculation of the superficial wall of the blood vessel and generating a virtual crack formation coefficient; then, determining a relatively high risk position in the longitudinal direction of the blood vessel, quantitatively describing plaque components through image segmentation or pattern recognition, and then calculating the damage fracture mechanics of the plaque cross section to obtain a virtual crack propagation path and a risk coefficient; then, summarizing quantitative anatomical indexes of diseased coronary plaque and virtual crack formation, expansion and total risk indexes; and finally, generating a comprehensive plaque rupture risk assessment report based on coronary multimode image anatomy and mechanical function. The risk quantification method combines the coronary angiography and the multimode image of the intracavity imaging as the basis of the plaque crack formation and expansion, so that the risk assessment of the coronary plaque is more comprehensive and complete.
It will be understood by those skilled in the art that all or part of the processes of the methods of the embodiments described above can be implemented by a computer program, which can be stored in a computer-readable storage medium, and when executed, can include the processes of the embodiments of the methods described above. The storage medium may be a magnetic disk, an optical disk, a Read-Only Memory (ROM), a Random Access Memory (RAM), or the like.
The above description is only for the specific embodiment of the present invention, but the scope of the present invention is not limited thereto, and any changes or substitutions that can be easily conceived by those skilled in the art within the technical scope of the present invention are included in the scope of the present invention. Therefore, the protection scope of the present invention shall be subject to the protection scope of the claims.