CN115995262B - Method for analyzing corn genetic mechanism based on random forest and LASSO regression - Google Patents
Method for analyzing corn genetic mechanism based on random forest and LASSO regression Download PDFInfo
- Publication number
- CN115995262B CN115995262B CN202310278072.1A CN202310278072A CN115995262B CN 115995262 B CN115995262 B CN 115995262B CN 202310278072 A CN202310278072 A CN 202310278072A CN 115995262 B CN115995262 B CN 115995262B
- Authority
- CN
- China
- Prior art keywords
- data
- genotype
- model
- corn
- feature subset
- Prior art date
- Legal status (The legal status is an assumption and is not a legal conclusion. Google has not performed a legal analysis and makes no representation as to the accuracy of the status listed.)
- Active
Links
- 238000000034 method Methods 0.000 title claims abstract description 36
- 238000007637 random forest analysis Methods 0.000 title claims abstract description 25
- 240000008042 Zea mays Species 0.000 title claims abstract description 21
- 235000002017 Zea mays subsp mays Nutrition 0.000 title claims abstract description 21
- 235000005824 Zea mays ssp. parviglumis Nutrition 0.000 title claims abstract description 17
- 235000005822 corn Nutrition 0.000 title claims abstract description 17
- 230000008303 genetic mechanism Effects 0.000 title claims abstract description 13
- 239000002207 metabolite Substances 0.000 claims abstract description 21
- 150000002632 lipids Chemical class 0.000 claims abstract description 20
- 238000004458 analytical method Methods 0.000 claims abstract description 18
- 238000002790 cross-validation Methods 0.000 claims description 11
- 239000000463 material Substances 0.000 claims description 9
- 238000003066 decision tree Methods 0.000 claims description 8
- 238000004422 calculation algorithm Methods 0.000 claims description 6
- 238000005070 sampling Methods 0.000 claims description 6
- 238000012360 testing method Methods 0.000 claims description 5
- 238000007781 pre-processing Methods 0.000 claims description 3
- 238000012549 training Methods 0.000 claims description 3
- 239000000126 substance Substances 0.000 claims 2
- 238000012163 sequencing technique Methods 0.000 claims 1
- 125000003473 lipid group Chemical group 0.000 abstract description 4
- 230000002068 genetic effect Effects 0.000 abstract description 3
- 238000012216 screening Methods 0.000 abstract description 2
- 108090000623 proteins and genes Proteins 0.000 description 10
- 108700028369 Alleles Proteins 0.000 description 6
- 239000011159 matrix material Substances 0.000 description 6
- 238000004364 calculation method Methods 0.000 description 5
- 241000196324 Embryophyta Species 0.000 description 4
- 235000016383 Zea mays subsp huehuetenangensis Nutrition 0.000 description 4
- 238000012097 association analysis method Methods 0.000 description 4
- 230000006870 function Effects 0.000 description 4
- 235000009973 maize Nutrition 0.000 description 4
- 230000000875 corresponding effect Effects 0.000 description 3
- 230000007614 genetic variation Effects 0.000 description 3
- 230000003993 interaction Effects 0.000 description 3
- 238000010801 machine learning Methods 0.000 description 3
- 230000004044 response Effects 0.000 description 3
- 238000009395 breeding Methods 0.000 description 2
- 230000001488 breeding effect Effects 0.000 description 2
- 238000005516 engineering process Methods 0.000 description 2
- 230000007613 environmental effect Effects 0.000 description 2
- 239000002773 nucleotide Substances 0.000 description 2
- 125000003729 nucleotide group Chemical group 0.000 description 2
- 238000012545 processing Methods 0.000 description 2
- 238000011160 research Methods 0.000 description 2
- 101001121408 Homo sapiens L-amino-acid oxidase Proteins 0.000 description 1
- 102100026388 L-amino-acid oxidase Human genes 0.000 description 1
- 108091028043 Nucleic acid sequence Proteins 0.000 description 1
- 108091023040 Transcription factor Proteins 0.000 description 1
- 102000040945 Transcription factor Human genes 0.000 description 1
- 238000012098 association analyses Methods 0.000 description 1
- 230000009286 beneficial effect Effects 0.000 description 1
- 238000012512 characterization method Methods 0.000 description 1
- 210000000349 chromosome Anatomy 0.000 description 1
- 238000010276 construction Methods 0.000 description 1
- 230000002596 correlated effect Effects 0.000 description 1
- 238000013135 deep learning Methods 0.000 description 1
- 238000012217 deletion Methods 0.000 description 1
- 230000037430 deletion Effects 0.000 description 1
- 201000010099 disease Diseases 0.000 description 1
- 208000037265 diseases, disorders, signs and symptoms Diseases 0.000 description 1
- 238000002224 dissection Methods 0.000 description 1
- 238000001914 filtration Methods 0.000 description 1
- 238000003780 insertion Methods 0.000 description 1
- 230000037431 insertion Effects 0.000 description 1
- 230000002503 metabolic effect Effects 0.000 description 1
- 238000010606 normalization Methods 0.000 description 1
- 102000004169 proteins and genes Human genes 0.000 description 1
- 230000009467 reduction Effects 0.000 description 1
- 238000000611 regression analysis Methods 0.000 description 1
- 150000003839 salts Chemical class 0.000 description 1
- 210000001519 tissue Anatomy 0.000 description 1
Images
Landscapes
- Measuring Or Testing Involving Enzymes Or Micro-Organisms (AREA)
Abstract
Description
技术领域Technical Field
本发明属于系统生物学\遗传学领域,具体涉及基于随机森林及LASSO回归解析玉米遗传机理的方法。The present invention belongs to the field of systems biology\genetics, and specifically relates to a method for analyzing the genetic mechanism of corn based on random forest and LASSO regression.
背景技术Background Art
全基因组关联分析(GWAS)是剖析复杂数量性状遗传变异的一种有效方法,建立基因型与人类疾病和植物数量性状之间的直接关联已成功鉴定了数千个相关的基因座。在自然界中,植物受到发育阶段、组织和环境刺激的影响共同产生大量的代谢产物,大约在10万到100万种不等,因此经常将代谢组作为基因型和植物表型之间的“桥梁”。代谢表型是数量性状,表型数据差异大,使用代谢组数据作为中间表型。与基因型数据进行关联分析,可以定位到更多的基因,也有可能定位到罕见SNP位点。然而从 GWAS 中鉴定出的变异只能解释总遗传变异的一部分,表型的预测能力有限。Genome-wide association study (GWAS) is an effective method to analyze the genetic variation of complex quantitative traits. Thousands of related loci have been successfully identified by establishing direct associations between genotypes and human diseases and plant quantitative traits. In nature, plants are affected by developmental stages, tissues and environmental stimuli to jointly produce a large number of metabolites, ranging from about 100,000 to 1 million, so the metabolome is often used as a "bridge" between genotypes and plant phenotypes. Metabolic phenotypes are quantitative traits, and phenotypic data vary greatly. Metabolome data are used as intermediate phenotypes. Association analysis with genotype data can locate more genes and may also locate rare SNP sites. However, the variants identified from GWAS can only explain part of the total genetic variation, and the predictive ability of phenotypes is limited.
机器学习和深度学习方法在处理生物学数据方面表现出了巨大的潜力。在生物学中机器学习算法主要应用于两个方面,一个是在缺乏实验数据的地方做出准确预测,并利用这些预测来指导未来的研究工作;二是使用机器学习算法解释潜在基因型的表型并从中获得新的见解,从而加深我们对生物学的理解。单核苷酸多态性(SNP)是指在全基因组水平上由于单个核苷酸(A、T、C、G)的插入或缺失等变化而引起DNA序列的多态性,是群体中最广泛的遗传变异。每个SNP能解释表型变异的很小一部分,但是大量的 SNP 共同作用可能占据更大的比例。使用高维基因组数据时,过度拟合的风险很高。特征选择技术用于识别与复杂性状相关的SNP,使研究人员研究的重点放在最有影响力的SNP上。Machine learning and deep learning methods have shown great potential in processing biological data. In biology, machine learning algorithms are mainly used in two aspects: one is to make accurate predictions where experimental data is lacking, and use these predictions to guide future research work; the other is to use machine learning algorithms to explain the phenotype of potential genotypes and gain new insights from them, thereby deepening our understanding of biology. Single nucleotide polymorphism (SNP) refers to the polymorphism of DNA sequence caused by changes such as insertion or deletion of a single nucleotide (A, T, C, G) at the whole genome level, and is the most widespread genetic variation in the population. Each SNP can explain a small part of the phenotypic variation, but a large number of SNPs together may account for a larger proportion. When using high-dimensional genomic data, the risk of overfitting is high. Feature selection techniques are used to identify SNPs associated with complex traits, allowing researchers to focus their research on the most influential SNPs.
发明内容Summary of the invention
针对传统关联分析方法只能解释一部分的遗传力且不能识别微效SNP的问题,本发明提供了一种基于随机森林和LASSO回归的多组学分析方法解析玉米脂质组的遗传机理,该方法通过随机森林过滤法评估特征的重要性,并筛选有影响力的特征子集,使用特征子集进一步建立两层LASSO回归模型,对表型进行预测,根据随机森林算法得到的特征子集和第一次LASSO回归分析得到的特征子集和表型组数据进行分析,解析玉米脂质组的遗传机理,为培育高产和耐受性的玉米提供思路和方法。In view of the problem that traditional association analysis methods can only explain part of the heritability and cannot identify micro-effect SNPs, the present invention provides a multi-omics analysis method based on random forest and LASSO regression to analyze the genetic mechanism of corn lipidome. The method evaluates the importance of features through random forest filtering method, screens influential feature subsets, and further establishes a two-layer LASSO regression model using the feature subsets to predict the phenotype. The feature subsets obtained by the random forest algorithm and the feature subsets and phenotype group data obtained by the first LASSO regression analysis are analyzed to analyze the genetic mechanism of corn lipidome, thereby providing ideas and methods for breeding high-yield and tolerant corn.
为实现上述发明目的,本发明所采用的具体的技术方案为:In order to achieve the above-mentioned object of the invention, the specific technical solution adopted by the present invention is:
一种基于随机森林及LASSO回归模型,采用以下步骤:A random forest and LASSO regression model is based on the following steps:
(1)对玉米的多组学(基因组、脂质组、表型组)数据进行预处理,如去除异常值、填补缺失值、数据标准化等;(1) Preprocessing of corn multi-omics (genomics, lipidome, phenotype) data, such as removing outliers, filling missing values, and data standardization;
(2)对预处理后的基因型数据进行连锁不平衡分析,使用plink技术计算SNP之间的连锁不平衡程度,使用标准化指标r2来表示,删除r2(连锁不平衡参数)值大于0.2的SNP位点后,剩余位点构成新的特征子集;(2) Linkage disequilibrium analysis was performed on the preprocessed genotype data. The degree of linkage disequilibrium between SNPs was calculated using the plink technology and represented by the standardized index r2 . After deleting SNP sites with r2 (linkage disequilibrium parameter) values greater than 0.2, the remaining sites constituted a new feature subset.
(3)通过新的特征子集建立随机森林模型对变量的重要性进行排序,确定重要影响因子,这些影响因子构成新的特征子集;(3) A random forest model is established through the new feature subset to rank the importance of variables and determine the important influencing factors. These influencing factors constitute a new feature subset.
(4)通过上述特征子集建立LASSO分析模型,对每一种脂质代谢物表型进行预测;(4) Establishing the LASSO analysis model based on the above feature subsets to predict the phenotype of each lipid metabolite;
(5)使用预测得到的脂质代谢物数据值建立LASSO分析模型,对表型数据进行预测,使用决定系数R2评估模型。(5) The predicted lipid metabolite data values were used to establish the LASSO analysis model, predict the phenotypic data, and evaluate the model using the coefficient of determination R2 .
进一步地,所述基因型数据的的获得方法为:基因型文件是hapmap格式的文件,每一行代表一个材料,每一列代表一个SNP位点,原始值是SNP的基因型,在进行后续分析之前,需要对数据进行重新编码,将基因型转换成数值型,采用0-1-2的编码方式。Furthermore, the method for obtaining the genotype data is as follows: the genotype file is a file in hapmap format, each row represents a material, each column represents a SNP site, and the original value is the genotype of the SNP. Before subsequent analysis, the data needs to be re-encoded to convert the genotype into a numerical type using a 0-1-2 encoding method.
具体地,本发明提供了一种基于随机森林和LASSO分析的多组学分析方法,具体的操作步骤为:Specifically, the present invention provides a multi-omics analysis method based on random forest and LASSO analysis, and the specific operation steps are:
(1)基因型文件是hapmap格式的文件,每一行代表一个材料,每一列代表一个SNP位点,原始值是SNP的基因型,在进行后续分析之前,需要对数据进行重新编码,将基因型转换成数值型,采用0-1-2的编码方式;(1) The genotype file is a hapmap format file. Each row represents a material, each column represents a SNP site, and the original value is the SNP genotype. Before subsequent analysis, the data needs to be recoded to convert the genotype into a numerical type using a 0-1-2 encoding method.
(2)查看基因型数据、脂质组数据和表型组数据是否有缺失值,若有,则对基因型数据使用KNN算法插补,脂质组数据和表型组数据使用均值填补;(2) Check whether there are missing values in the genotype data, lipid group data, and phenotype group data. If so, use the KNN algorithm to interpolate the genotype data and use the mean to fill in the lipid group data and phenotype group data;
(3)考虑到SNP之间的连锁不平衡的问题(LD),使用plink技术删除了连锁不平衡参数r2大于0.2的特征,用剩余的特征构建特征子集;(3) Considering the linkage disequilibrium (LD) problem between SNPs, the features with linkage disequilibrium parameter r2 greater than 0.2 were deleted using plink technology, and the remaining features were used to construct feature subsets;
(4)将上一步的特征子集输入到随机森林模型中,采用10重交叉验证法评估准确性,将结果输出,保存成一个新的子集;(4) Input the feature subset from the previous step into the random forest model, use the 10-fold cross-validation method to evaluate the accuracy, output the results, and save them as a new subset;
(5)将上一步得到的特征子集用于构建LASSO回归模型,采用5倍交叉验证法估计参数,对每一种脂质代谢物进行预测;(5) The feature subset obtained in the previous step was used to construct a LASSO regression model, and the parameters were estimated using the 5-fold cross-validation method to predict each lipid metabolite;
(6)使用上一步脂质代谢物的预测值对表型进行预测,使用决定系数r2评估模型;整合第四步和第六步的结果,解析玉米脂质组的遗传机理。(6) Use the predicted values of lipid metabolites in the previous step to predict the phenotype and use the coefficient of determination r2 to evaluate the model; integrate the results of steps 4 and 6 to analyze the genetic mechanism of the corn lipidome.
进一步地,上述具体操作中步骤(4)中随机森林模型评估变量的步骤为:Furthermore, the steps of evaluating variables in the random forest model in step (4) of the above specific operation are:
第一步:采用有放回的抽样方法(bootstrap)从样本中选取n个样本作为训练集;Step 1: Use the bootstrap sampling method to select n samples from the sample as the training set;
第二步:用样本集生成一棵决策树和每一个节点;重复有放回的对样本和变量进行抽样,重复k次,生成k个决策树;Step 2: Generate a decision tree and each node using the sample set; repeat the sampling of samples and variables with replacement, repeat k times, and generate k decision trees;
第三步:使用得到的随机森林对测试样本进行预测,并用投票法决定预测结果,若k个决策树中的众数所在的类别即为预测的结果;Step 3: Use the obtained random forest to predict the test sample, and use the voting method to determine the prediction result. The category where the majority of k decision trees belongs is the prediction result.
第四步:使用随机森林和10折交叉验证法筛选重要特征。Step 4: Use random forest and 10-fold cross validation to screen important features.
目前,传统的关联分析方法已经发现了与表型相关的数千个SNP位点,对绝大多数复杂数量性状而言,这些单个SNP位点可以导致表型变异的能力较小,只有少部分人可以利用这些位点解释表型变异。研究人员认为数量性状表型变异是由基因与基因、基因与环境的相互作用引起的,而关联分析方法只能探测单个SNP位点与表型之间的相关性,缺乏探测多个基因交互作用的能力。At present, traditional association analysis methods have discovered thousands of SNP sites associated with phenotypes. For most complex quantitative traits, these single SNP sites have little ability to cause phenotypic variation, and only a small number of people can use these sites to explain phenotypic variation. Researchers believe that quantitative phenotypic variation is caused by the interaction between genes and genes, and genes and the environment, while association analysis methods can only detect the correlation between a single SNP site and the phenotype, and lack the ability to detect the interaction of multiple genes.
本发明相对于现有技术的有益效果为:本发明可以处理多个基因和环境因素的复杂交互作用,并且不需要假设数据符合特定的分布或模型;还可以发现新的关联性和规律,提高预测精度和解释性;并且能够自动进行特征选择和降维等操作,减少了繁琐的手工操作。另外,与传统关联分析方法相比,本发明鉴定的SNP位点可以解释更多的表型变异。The beneficial effects of the present invention compared with the prior art are: the present invention can handle the complex interactions of multiple genes and environmental factors, and does not need to assume that the data conforms to a specific distribution or model; it can also discover new associations and laws, improve prediction accuracy and interpretability; and can automatically perform operations such as feature selection and dimensionality reduction, reducing tedious manual operations. In addition, compared with traditional association analysis methods, the SNP sites identified by the present invention can explain more phenotypic variations.
附图说明BRIEF DESCRIPTION OF THE DRAWINGS
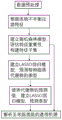
图1为基于随机森林及LASSO回归模型解析玉米遗传机理的流程图。Figure 1 is a flow chart for analyzing the genetic mechanism of corn based on random forest and LASSO regression models.
具体实施方式DETAILED DESCRIPTION
为了使本发明的目的、技术方案及优点更加清楚明白,以下结合实施例,对本发明进行进一步详细说明。应当理解,此处描述的具体实施例仅仅用以解释本申请,并不用于限定本申请。In order to make the purpose, technical solution and advantages of the present invention more clearly understood, the present invention is further described in detail below in conjunction with the embodiments. It should be understood that the specific embodiments described herein are only used to explain the present application and are not used to limit the present application.
实施例1 本文数据使用的遗传材料包括含有513份自交系的玉米关联群体(YangX, Gao S, Xu S, et al. Characterization of a global germplasm collection andits potential utilization for analysis of complex quantitative traits inmaize[J]. Molecular Breeding, 2011, 28: 511-526.)和含有197个自交系的RIL(B73/By804)群体,这些自交系来源于正常系B73和高油系By804(Xiao Y, Tong H, Yang X, etal. Genome-wide dissection of the maize ear genetic architecture usingmultiple populations[J]. New Phytologist, 2016, 210(3): 1095-1106.)。材料种植在武汉华中农业大学田间试验区。Example 1 The genetic materials used in the data of this article include a maize association population containing 513 inbred lines (YangX, Gao S, Xu S, et al. Characterization of a global germplasm collection and its potential utilization for analysis of complex quantitative traits inmaize [J]. Molecular Breeding, 2011, 28: 511-526.) and a RIL (B73/By804) population containing 197 inbred lines, which are derived from the normal line B73 and the high-oil line By804 (Xiao Y, Tong H, Yang X, et al. Genome-wide dissection of the maize ear genetic architecture using multiple populations [J]. New Phytologist, 2016, 210 (3): 1095-1106.). The materials were planted in the field test area of Huazhong Agricultural University, Wuhan.
在该实施例中提供了一种基于基因组和脂质组预测植物表型的方法,图1为基于随机森林及LASSO回归模型解析玉米遗传机理的流程图,包括以下步骤:In this embodiment, a method for predicting plant phenotype based on genome and lipidome is provided. FIG1 is a flow chart of analyzing the genetic mechanism of corn based on random forest and LASSO regression model, comprising the following steps:
(1)、数据预处理(1) Data preprocessing
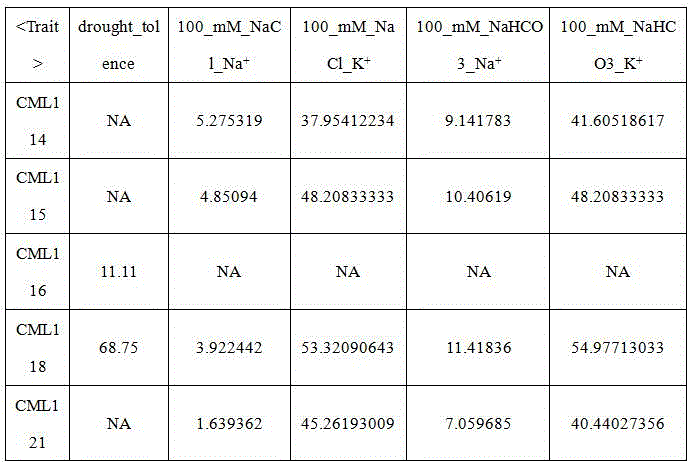
基因型文件为541*1145174非数值矩阵(如表1所示),包含缺失值,行是SNP,列是样本,矩阵中的每个值代表SNP在材料中的等位基因,有四种形式,A、T、C、G;脂质组文件为479*154数值矩阵(如表2所示),包含缺失值,行为材料,列为脂质代谢物;表型数据为541*6的数值矩阵(如表3所示),包含缺失值,行为材料,列为性状。The genotype file is a 541*1145174 non-numerical matrix (as shown in Table 1), containing missing values, with rows being SNPs and columns being samples. Each value in the matrix represents the allele of the SNP in the material, which has four forms: A, T, C, and G. The lipidome file is a 479*154 numerical matrix (as shown in Table 2), containing missing values, with rows being materials and columns being lipid metabolites. The phenotypic data is a 541*6 numerical matrix (as shown in Table 3), containing missing values, with rows being materials and columns being traits.
表1 基因型原始数据Table 1 Genotype raw data
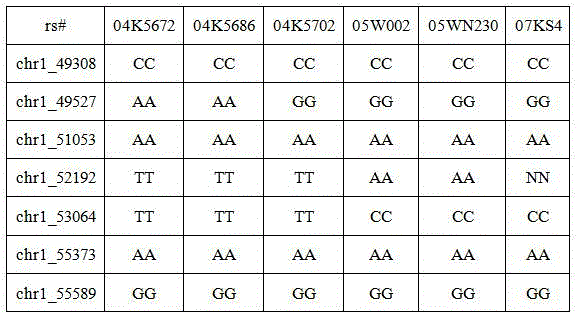
表2 脂质组原始数据Table 2 Lipidome raw data

表3 原始表型数据Table 3 Raw phenotypic data
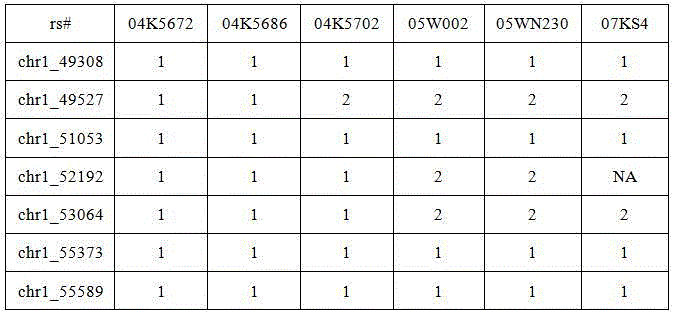
首先将基因型文件重新编码,转换成数值文件,以便用于后续计算。在Linux系统上使用tassel软件将hmp格式的文件转换为vcf格式的文件,将转换好的vcf文件使用vcftools软件转换为plink(.ped,.map)格式,使用plink工具计算每个位点上等位基因在材料中出现的频率,将出现频率高的等位基因视为主效等位基因,编码为1,另一个等位基因则为次效等位基因,编码为2,缺失值用NA表示(如表4所示)。First, the genotype file was recoded and converted into a numerical file for subsequent calculations. The hmp format file was converted into a vcf format file using the tassel software on the Linux system. The converted vcf file was converted into the plink (.ped, .map) format using the vcftools software. The plink tool was used to calculate the frequency of alleles at each site in the material. The allele with a high frequency was regarded as the major allele and coded as 1. The other allele was regarded as the minor allele and coded as 2. Missing values were represented by NA (as shown in Table 4).
表4 重新编码后的基因型数据Table 4 Recoded genotype data
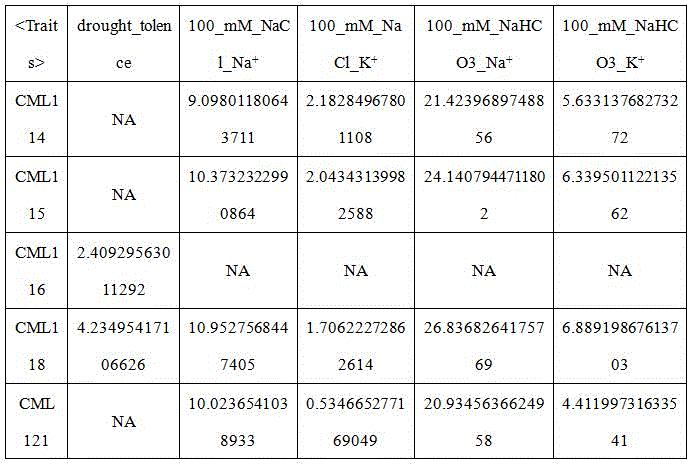
非正态分布的数据往往存在较多的异常值,这些异常值可能会对建模结果产生较大影响,因此在进行后续计算之前,对脂质组数据和表型数据进行boxcox处理(如表5和表6所示),使数据满足正态分布或接近正态分布。Non-normally distributed data often contain many outliers, which may have a significant impact on the modeling results. Therefore, before subsequent calculations, the lipidome data and phenotypic data were subjected to Boxcox processing (as shown in Tables 5 and 6) to make the data conform to or be close to normal distribution.
表5 脂质组原始数据进行标准化后得到的数据Table 5 Data obtained after normalization of lipid group raw data
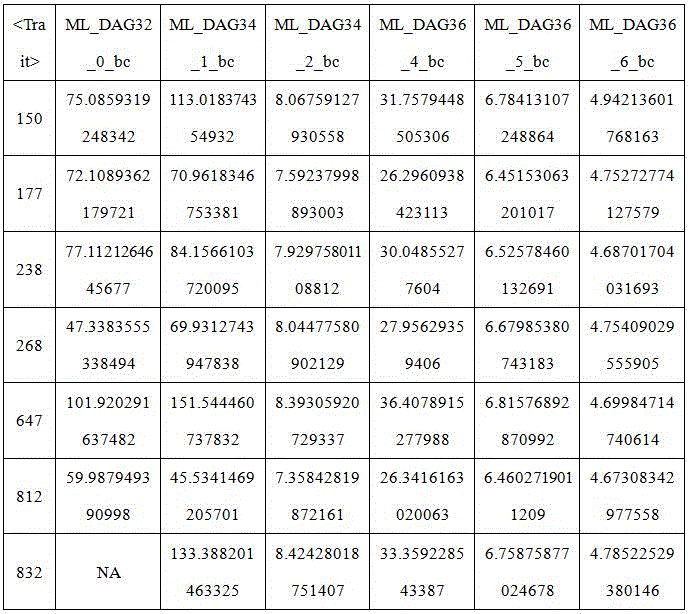
表6 原始表型数据进行标准化后得到的数据Table 6 Data obtained after standardization of original phenotypic data
基因型数据中含有缺失值,使用KNN算法进行填补,计算每个样本与其他样本的相似性,使用欧氏距离计算,对于每个缺失值,找到5个最近邻的样本,将5个样本的已知基因型的平均值作为该缺失值的估计值,重复此步骤,直至所有的缺失值填补完成(如表7所示)。欧氏距离的计算公式为:The genotype data contains missing values, which are filled using the KNN algorithm. The similarity between each sample and other samples is calculated using the Euclidean distance. For each missing value, the five nearest neighbor samples are found, and the average of the known genotypes of the five samples is used as the estimated value of the missing value. This step is repeated until all missing values are filled (as shown in Table 7). The calculation formula for the Euclidean distance is:
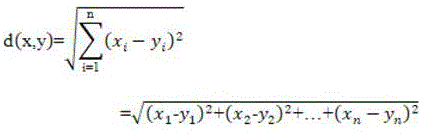
d(x,y)代表n维空间点x(x1,x2,...,xn)和点y(y1,y2,...,yn)之间的欧式距离,其中xi代表第一个点的第i维坐标;yi代表第二个点的第i维坐标;n为向量维度。 d(x,y) represents the Euclidean distance between a point x( x1 , x2 , ..., xn ) and a point y( y1 , y2 , ..., yn ) in n-dimensional space, where xi represents the i-th coordinate of the first point; yi represents the i-th coordinate of the second point; and n is the vector dimension.
对标准化后的脂质组数据和表型数据使用均值填补缺失值(如表8和表9所示),计算每个脂质或性状在群体中的均值,使用均值作为该缺失值的估计值。The mean of the standardized lipidome data and phenotypic data was used to fill in missing values (as shown in Tables 8 and 9), and the mean of each lipid or trait in the population was calculated and used as the estimated value of the missing value.
表7 KNN填充缺失值后的基因型数据Table 7 Genotype data after KNN filling missing values
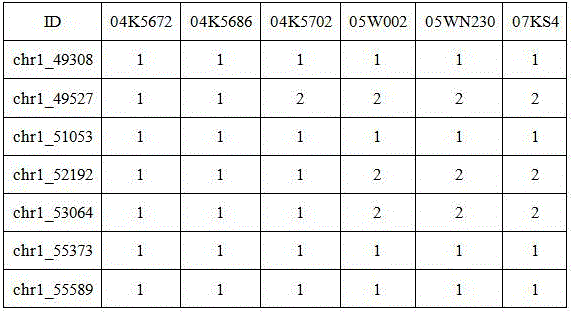
表8 使用均值填补后的脂质组数据Table 8 Lipidome data after mean imputation
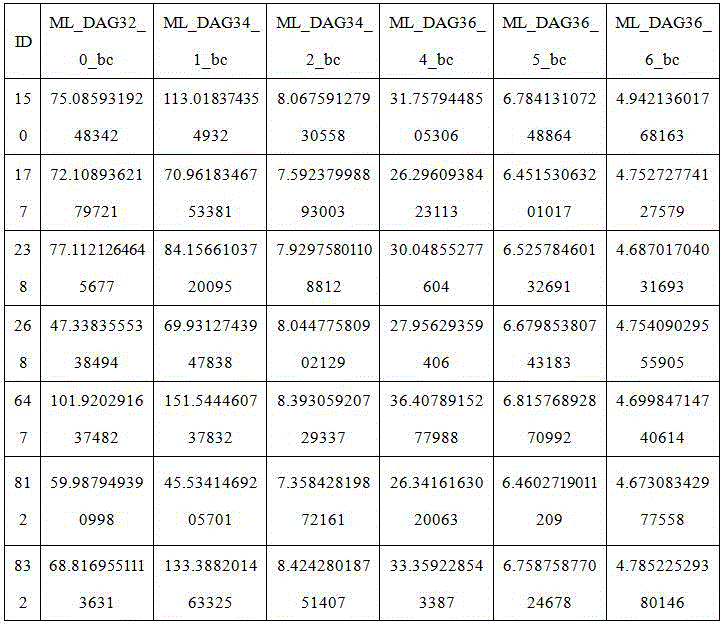
表9 使用均值填补缺失值后的表型数据Table 9 Phenotypic data after using mean to fill missing values

(2)、根据SNP之间的连锁不平衡过滤冗余特征(2) Filter redundant features based on linkage disequilibrium between SNPs
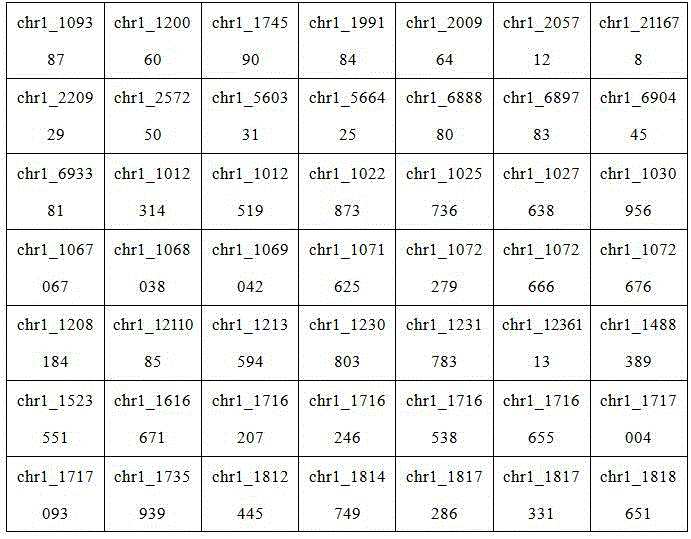
连锁不平衡(Linkage disequilibrium,LD)是指两个或多个位点之间存在的非随机关联,它们位于同一条染色体上且经常同时遗传给后代,这种关联性可能导致特征之间的高度相关,从而影响模型的精度和解释能力。根据基因型数据矩阵,计算每对SNP之间的连锁不平衡系数(r2);对于每个SNP,选择与其LD程度最高的一个或多个相邻的SNP,并让它们代表该SNP;计算每个代表SNP与其他代表SNP之间的LD值,如果某个代表SNP与其他任何一个代表SNPs的LD值都超过了预设的阈值,则将该代表SNP删除。阈值选择0.2,认为r2大于0.2的SNP之间存在连锁不平衡。这种方法可以有效地减少数据集中冗余信息和噪声,提高遗传关联研究的效率和精度。共得到88766个SNP位点(如表10所示)。以下运算以100_mM_NaCL_Na+表型为例。Linkage disequilibrium (LD) refers to the non-random association between two or more loci, which are located on the same chromosome and are often inherited to offspring at the same time. This association may lead to a high correlation between characteristics, thus affecting the accuracy and explanatory power of the model. According to the genotype data matrix, the linkage disequilibrium coefficient (r 2 ) between each pair of SNPs is calculated; for each SNP, one or more adjacent SNPs with the highest LD degree are selected and let them represent the SNP; the LD value between each representative SNP and other representative SNPs is calculated. If the LD value of a representative SNP with any other representative SNPs exceeds the preset threshold, the representative SNP is deleted. The threshold is selected as 0.2, and it is considered that there is linkage disequilibrium between SNPs with r 2 greater than 0.2. This method can effectively reduce redundant information and noise in the data set and improve the efficiency and accuracy of genetic association studies. A total of 88,766 SNP loci were obtained (as shown in Table 10). The following calculation takes the 100_mM_NaCL_Na + phenotype as an example.
表10 去除LD后得到的变量Table 10 Variables obtained after removing LD
(3)、构建随机森林模型,评估特征重要性(3) Build a random forest model and evaluate feature importance
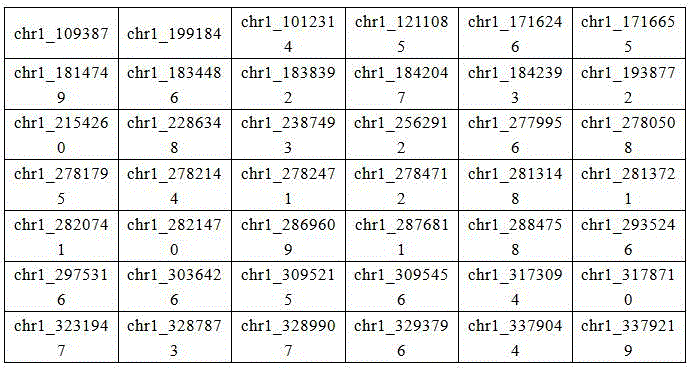
使用上一步结束后得到的特征文件建立随机森林模型,评估特征重要性,进一步对特征进行提取。将第(2)步结果得到的基因型文件(包含88766个SNP位点的矩阵)作为该步骤的输入数据集;在数据集上构建一个随机森林模型,其中包含多个决策树,并利用袋装和随机抽样技术生成不同的训练集和测试集;对每个决策树,在节点处选择最佳分裂变量,并计算该变量在该节点处的mean decrease accuracy作为其重要性分数。这些分数可以通过各种方法进行加权平均,得到每个变量在整个模型中的重要性排名;按照这些排名对变量进行排序,选择得分最高的t个变量作为最终选择结果,构成特征子集。t由交叉验证法确定,交叉验证采用10倍交叉验证法。经以上步骤进行计算后,最后得到13456个评分较高的变量(如表11所示)。Use the feature file obtained after the previous step to build a random forest model, evaluate the feature importance, and further extract the features. The genotype file (a matrix containing 88,766 SNP sites) obtained from step (2) is used as the input data set for this step; a random forest model is built on the data set, which contains multiple decision trees, and different training sets and test sets are generated using bagging and random sampling techniques; for each decision tree, the best split variable is selected at the node, and the mean decrease accuracy of the variable at the node is calculated as its importance score. These scores can be weighted averaged by various methods to obtain the importance ranking of each variable in the entire model; the variables are sorted according to these rankings, and the t variables with the highest scores are selected as the final selection results to form the feature subset. t is determined by the cross-validation method, and the cross-validation adopts the 10-fold cross-validation method. After the above steps are calculated, 13,456 variables with high scores are finally obtained (as shown in Table 11).
表11 使用随机森林方法后得到的重要变量Table 11. Important variables obtained using the random forest method
(4)、为脂质代谢物数据建立回归模型(4) Establishing a regression model for lipid metabolite data
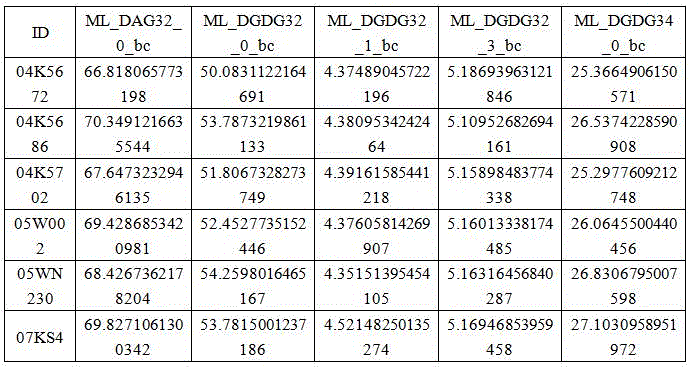
使用第(3)步得到的特征子集,构建LASSO回归模型,计算每一个脂质代谢物的预测值。使用第(3)步得到的特征子集作为本模型的输入数据集;然后,使用glmnet包中的cv.glmnet函数进行LASSO回归模型构建。该函数采用交叉验证方法来选择最优的正则化参数λ,并得到相应的系数估计值;接着,根据系数估计值对变量进行排序并筛选出重要特征子集;使用特征子集对响应变量进行预测,输出预测结果并保存,用于下一步的计算;重复上面构建模型、筛选子集和对响应变量进行预测这三步,直至脂质组数据中的每一个脂质代谢物都作为响应变量构建了模型,得到预测结果(如表12所示)。Using the feature subset obtained in step (3), the LASSO regression model is constructed to calculate the predicted value of each lipid metabolite. The feature subset obtained in step (3) is used as the input data set of this model; then, the cv.glmnet function in the glmnet package is used to construct the LASSO regression model. This function uses the cross-validation method to select the optimal regularization parameter λ and obtain the corresponding coefficient estimates; then, the variables are sorted according to the coefficient estimates and the important feature subsets are screened out; the response variable is predicted using the feature subset, and the prediction results are output and saved for the next calculation; the above three steps of model construction, subset screening, and response variable prediction are repeated until each lipid metabolite in the lipidome data is used as a response variable to build a model and obtain the prediction results (as shown in Table 12).
表12 脂质代谢物的预测值Table 12 Predicted values of lipid metabolites
(5)、表型数据建立回归模型(5) Establishing regression model based on phenotypic data
使用第(4)步得到的每个脂质代谢物的预测结果构成特征子集,构建LASSO回归模型,计算表型的预测值。The prediction results of each lipid metabolite obtained in step (4) were used to form a feature subset, and a LASSO regression model was constructed to calculate the predicted value of the phenotype.
使用第四步得到的特征子集作为本模型的输入数据集;然后,使用glmnet包中的cv.glmnet函数进行LASSO回归模型构建。该函数采用5倍交叉验证方法来选择最优的正则化参数λ,并得到相应的系数估计值;接着,根据系数估计值对变量进行排序并筛选出重要特征子集(如表13所示);使用测试数据对模型进行评估,计算相关指标(如均方根误差RMSE、决定系数R2等)来衡量模型性能。在本节中我们计算得到RMSE的值为0.8001393,决定系数R2的值为0.2808084,表明结合基因型数据和脂质组数据可以解释26%的表型变异。The feature subset obtained in the fourth step was used as the input data set of this model; then, the cv.glmnet function in the glmnet package was used to construct the LASSO regression model. This function uses a 5-fold cross-validation method to select the optimal regularization parameter λ and obtain the corresponding coefficient estimates; then, the variables are sorted according to the coefficient estimates and the important feature subsets are screened out (as shown in Table 13); the model is evaluated using the test data, and relevant indicators (such as root mean square error RMSE, determination coefficient R2, etc.) are calculated to measure the model performance. In this section, we calculated that the RMSE value is 0.8001393 and the determination coefficient R2 value is 0.2808084, indicating that the combination of genotype data and lipidome data can explain 26% of the phenotypic variation.
表13 筛选出的重要脂质代谢物Table 13 Screened important lipid metabolites
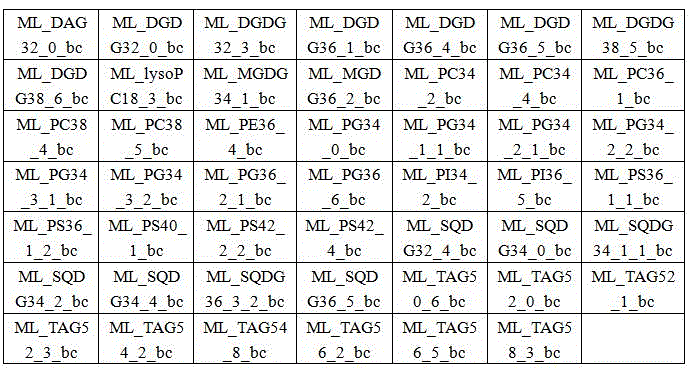
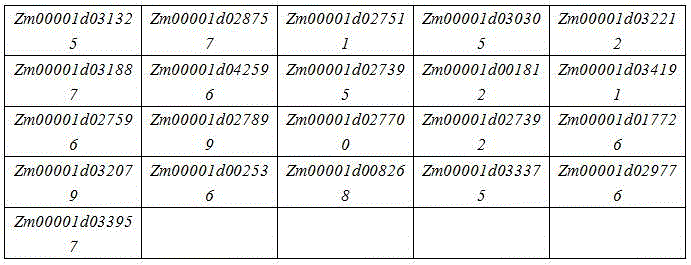
(6)、在第(5)步我们得到了与表型显著相关的脂质代谢物,根据这些脂质代谢物可以在第(4)步中找到与之对应的显著的SNP位点,根据这些SNP位点又可以采用annovar等方法进行注释,挖掘候选基因(如表14所示)。进一步我们可以解析玉米脂质组的遗传机理。比如玉米NAC转录因子家族的基因Zm00001d027395(NAC78),可能通过影响DGDG36_4代谢物的含量,来响应盐胁迫。(6) In step (5), we obtained lipid metabolites that were significantly correlated with the phenotype. Based on these lipid metabolites, we can find the corresponding significant SNP sites in step (4). Based on these SNP sites, we can use annovar and other methods to annotate and mine candidate genes (as shown in Table 14). We can further analyze the genetic mechanism of the maize lipidome. For example, the gene Zm00001d027395 (NAC78) of the maize NAC transcription factor family may respond to salt stress by affecting the content of DGDG36_4 metabolites.
表14 根据显著位点注释的候选基因Table 14 Candidate genes annotated according to significant sites
Claims (5)
Priority Applications (1)
| Application Number | Priority Date | Filing Date | Title |
|---|---|---|---|
| CN202310278072.1A CN115995262B (en) | 2023-03-21 | 2023-03-21 | Method for analyzing corn genetic mechanism based on random forest and LASSO regression |
Applications Claiming Priority (1)
| Application Number | Priority Date | Filing Date | Title |
|---|---|---|---|
| CN202310278072.1A CN115995262B (en) | 2023-03-21 | 2023-03-21 | Method for analyzing corn genetic mechanism based on random forest and LASSO regression |
Publications (2)
| Publication Number | Publication Date |
|---|---|
| CN115995262A CN115995262A (en) | 2023-04-21 |
| CN115995262B true CN115995262B (en) | 2023-05-23 |
Family
ID=85992243
Family Applications (1)
| Application Number | Title | Priority Date | Filing Date |
|---|---|---|---|
| CN202310278072.1A Active CN115995262B (en) | 2023-03-21 | 2023-03-21 | Method for analyzing corn genetic mechanism based on random forest and LASSO regression |
Country Status (1)
| Country | Link |
|---|---|
| CN (1) | CN115995262B (en) |
Families Citing this family (3)
| Publication number | Priority date | Publication date | Assignee | Title |
|---|---|---|---|---|
| CN117437977A (en) * | 2023-05-17 | 2024-01-23 | 上海市农业科学院 | Method for predicting sweet corn endosperm mutant genes based on SNP and logistic regression models |
| CN118098348B (en) * | 2024-01-23 | 2024-08-06 | 华中农业大学 | Method and device for detecting genotype of hybrid parent, electronic equipment and medium |
| CN120412717B (en) * | 2025-06-30 | 2025-09-23 | 中国农业科学院作物科学研究所 | Corn selective breeding effect analysis method integrating population genetics and deep learning |
Citations (1)
| Publication number | Priority date | Publication date | Assignee | Title |
|---|---|---|---|---|
| CN115691660A (en) * | 2022-07-28 | 2023-02-03 | 中国科学院植物研究所 | A method for genome-wide selection of cadmium accumulation traits in maize kernels |
Family Cites Families (4)
| Publication number | Priority date | Publication date | Assignee | Title |
|---|---|---|---|---|
| CN102415243B (en) * | 2011-10-04 | 2013-10-30 | 吉林大学 | Discrete-element-method-based corn threshing process analysis method |
| CN109884637A (en) * | 2019-04-02 | 2019-06-14 | 中国民航大学 | SAR Sparse Feature Enhanced Imaging Method Based on Approximate Message Passing |
| CN111863137B (en) * | 2020-05-28 | 2024-01-02 | 上海朴岱生物科技合伙企业(有限合伙) | Complex disease state evaluation method based on high-throughput sequencing data and clinical phenotype construction and application |
| CN114464274A (en) * | 2022-01-14 | 2022-05-10 | 哈尔滨理工大学 | A Hardness Prediction Method for High Entropy Alloys Based on Machine Learning and Improved Genetic Algorithm Feature Screening |
-
2023
- 2023-03-21 CN CN202310278072.1A patent/CN115995262B/en active Active
Patent Citations (1)
| Publication number | Priority date | Publication date | Assignee | Title |
|---|---|---|---|---|
| CN115691660A (en) * | 2022-07-28 | 2023-02-03 | 中国科学院植物研究所 | A method for genome-wide selection of cadmium accumulation traits in maize kernels |
Also Published As
| Publication number | Publication date |
|---|---|
| CN115995262A (en) | 2023-04-21 |
Similar Documents
| Publication | Publication Date | Title |
|---|---|---|
| EP3939046B1 (en) | Methods and compositions for imputing or predicting genotype or phenotype | |
| Alemu et al. | Genomic selection in plant breeding: Key factors shaping two decades of progress | |
| Xiao et al. | Genome-wide association studies in maize: praise and stargaze | |
| KR20240124392A (en) | Variant calling without using target reference genome | |
| CN115995262A (en) | A Method of Analyzing the Genetic Mechanism of Maize Based on Random Forest and LASSO Regression | |
| CN113192556B (en) | Genotype and phenotype association analysis method in multigroup chemical data based on small sample | |
| EP3929928A1 (en) | Associating pedigree scores and similarity scores for plant feature prediction | |
| Escamilla et al. | Genomic selection: Essence, applications, and prospects | |
| Pool | Genetic mapping by bulk segregant analysis in Drosophila: experimental design and simulation-based inference | |
| Brault et al. | Harnessing multivariate, penalized regression methods for genomic prediction and QTL detection of drought-related traits in grapevine | |
| Naik et al. | Bioinformatics for plant genetics and breeding research | |
| US20220020449A1 (en) | Vector-based haplotype identification | |
| Winn et al. | Profiling of Fusarium head blight resistance QTL haplotypes through molecular markers, genotyping-by-sequencing, and machine learning | |
| Schiavinato et al. | JLOH: Inferring loss of heterozygosity blocks from sequencing data | |
| CN117877573A (en) | A method for constructing a polygenic genetic risk assessment model using the Ising model | |
| CN115273979A (en) | A self-attention mechanism-based pathogenicity prediction system for single nucleotide nonsense mutations | |
| CN118398074B (en) | Multi-stage single nucleotide polymorphism interaction association analysis method and system | |
| CN116403650B (en) | A method for constructing gene regulatory networks based on meta-analysis | |
| Sahu et al. | Genome-wide association study (GWAS): concept and methodology for gene mapping in plants | |
| CN116130006B (en) | A method for discovering superior genes in sorghum | |
| Moore et al. | How computational experiments can improve our understanding of the genetic architecture of common human diseases | |
| CN119964642B (en) | Hybrid combination high-generation genotype prediction simulation method for selfing crops | |
| Amini et al. | Application of the Two-layer Wrapper-Embedded Feature Selection Method to Improve Genomic Selection | |
| CN121583325A (en) | Methods, systems and storage media for gene analysis and prediction of common diseases | |
| Sitarcık et al. | Flower Pollination Algorithm for Detection of Epistasis Associated with a Phenotype |
Legal Events
| Date | Code | Title | Description |
|---|---|---|---|
| PB01 | Publication | ||
| PB01 | Publication | ||
| SE01 | Entry into force of request for substantive examination | ||
| SE01 | Entry into force of request for substantive examination | ||
| GR01 | Patent grant | ||
| GR01 | Patent grant |