CN1261908C - Method and system for detecting defects in printed circuit boards - Google Patents
Method and system for detecting defects in printed circuit boards Download PDFInfo
- Publication number
- CN1261908C CN1261908C CNB018038670A CN01803867A CN1261908C CN 1261908 C CN1261908 C CN 1261908C CN B018038670 A CNB018038670 A CN B018038670A CN 01803867 A CN01803867 A CN 01803867A CN 1261908 C CN1261908 C CN 1261908C
- Authority
- CN
- China
- Prior art keywords
- pcb
- surface defects
- image
- detecting surface
- layer
- Prior art date
- Legal status (The legal status is an assumption and is not a legal conclusion. Google has not performed a legal analysis and makes no representation as to the accuracy of the status listed.)
- Expired - Fee Related
Links
Images





Classifications
-
- H—ELECTRICITY
- H05—ELECTRIC TECHNIQUES NOT OTHERWISE PROVIDED FOR
- H05K—PRINTED CIRCUITS; CASINGS OR CONSTRUCTIONAL DETAILS OF ELECTRIC APPARATUS; MANUFACTURE OF ASSEMBLAGES OF ELECTRICAL COMPONENTS
- H05K3/00—Apparatus or processes for manufacturing printed circuits
-
- G—PHYSICS
- G06—COMPUTING OR CALCULATING; COUNTING
- G06T—IMAGE DATA PROCESSING OR GENERATION, IN GENERAL
- G06T7/00—Image analysis
- G06T7/0002—Inspection of images, e.g. flaw detection
- G06T7/0004—Industrial image inspection
- G06T7/0006—Industrial image inspection using a design-rule based approach
-
- G—PHYSICS
- G06—COMPUTING OR CALCULATING; COUNTING
- G06T—IMAGE DATA PROCESSING OR GENERATION, IN GENERAL
- G06T2207/00—Indexing scheme for image analysis or image enhancement
- G06T2207/30—Subject of image; Context of image processing
- G06T2207/30108—Industrial image inspection
- G06T2207/30141—Printed circuit board [PCB]
Landscapes
- Engineering & Computer Science (AREA)
- Quality & Reliability (AREA)
- Computer Vision & Pattern Recognition (AREA)
- Physics & Mathematics (AREA)
- General Physics & Mathematics (AREA)
- Theoretical Computer Science (AREA)
- Manufacturing & Machinery (AREA)
- Microelectronics & Electronic Packaging (AREA)
- Image Analysis (AREA)
- Image Processing (AREA)
- Investigating Materials By The Use Of Optical Means Adapted For Particular Applications (AREA)
- Length Measuring Devices By Optical Means (AREA)
Abstract
Description
技术领域technical field
本发明涉及用于检测诸如印刷电路板的电子电路上的缺陷的检查系统和方法。更具体来说,本发明涉及基于边缘检测的系统和方法。The present invention relates to inspection systems and methods for detecting defects on electronic circuits, such as printed circuit boards. More specifically, the present invention relates to edge detection based systems and methods.
背景技术Background technique
电子电路可以有很多形式,诸如PCB(印刷电路板),引线框架,混合电路。这些电路通常包含多个组成部分(组件),例如导体,孔,焊点,介质,光聚合物保护膜等等。这些组成部分可以一层在另一层之上组装在各层。这种多层组装的例子是熟知的导体-孔-釉电路结构。在以下的说明中,我们将仅参照印刷电路板(PCB)为例。然而应当理解,本发明不限于电子电路的该实施例。Electronic circuits can take many forms, such as PCBs (printed circuit boards), lead frames, hybrid circuits. These circuits usually contain multiple components (components) such as conductors, vias, solder joints, dielectrics, photopolymer protective films, and more. These components can be assembled in layers one on top of the other. An example of such a multilayer assembly is the well known conductor-hole-glaze circuit structure. In the following description, we will only refer to a printed circuit board (PCB) as an example. It should however be understood that the invention is not limited to this embodiment of an electronic circuit.
过去,PCB的检查通过人工使用放大镜观看电路以视觉进行,试图找出与可接受的电路模型的差别。视觉检查有若干缺陷:主观性,速度慢,难以收集到缺陷的定量信息等。In the past, inspection of PCBs was done visually by looking at the circuit manually with a magnifying glass, trying to find differences from an acceptable circuit model. Visual inspection has several drawbacks: subjectivity, slow speed, difficulty in gathering quantitative information on defects, etc.
随着计算机处理速度的增长近来出现了自动化的检查方法。这些自动检查方法在于提取待检查的PCB的数字图像,并分析该数字图像以确定缺陷的存在。这种自动化检查方法的例子是基于边缘检测的那些例子。Automated inspection methods have recently emerged as computer processing speeds have increased. These automated inspection methods consist in taking a digital image of the PCB to be inspected and analyzing this digital image to determine the presence of defects. Examples of such automated inspection methods are those based on edge detection.
边缘是组件外形(轮廓)的片段。假设组件(或区域)之间的过度具有光学上不同的特征,则能够在视觉上区分数字图像上色调从一个组件到下一组件的变化。基于边缘的检测方法在于表征(characterize)并分析PCB图像的边缘,并通过比较这种边缘和已知数值和标准。Edges are segments of the component shape (outline). Assuming that transitions between components (or regions) have optically distinct characteristics, it is possible to visually distinguish changes in hue from one component to the next on a digital image. Edge-based detection methods consist in characterizing and analyzing the edges of a PCB image, and by comparing such edges with known values and standards.
附图的图1示出可在PCB上或其它类型的电子电路上发现的缺陷的例子。例如,这种缺陷可能是PCB两层之间的不良重叠10,两层未对准12,两个相邻轨迹(track)之间间隙过小14,两个组件之间桥接16,轨迹太窄18或轨迹断开19。Figure 1 of the accompanying drawings shows examples of defects that may be found on PCBs or other types of electronic circuits. Such defects could be, for example, poor overlap between two layers of a PCB10, misalignment of two layers12, too small a gap between two adjacent tracks14, a bridge between two components16, a track that is too narrow 18 or track disconnection 19.
在美国专利No.4,570,180,标题为“用于自动光学检查的方法”(1986年2月11日授权,Baier等人作为发明人)中描述了用于检测电子电路缺陷的基于边缘的方法的一个例子。该专利涉及使用数字图像处理技术用于二维图案的自动光学检查的方法和设备。该方法包括第一步骤,在该步骤对于边缘或线条扫描灰度级数字图像,并在图像存储中标记这些边缘。然后,扫描并对允许的灰度测试图像存储中所有未标记的区域。One of the edge-based methods for detecting defects in electronic circuits is described in U.S. Pat. example. The patent relates to methods and apparatus for automated optical inspection of two-dimensional patterns using digital image processing techniques. The method comprises a first step in which a grayscale digital image is scanned for edges or lines and these edges are marked in an image store. Then, scan and test all unmarked regions in the image against the allowed gray levels.
由于仅仅是通过对允许的灰度级比较未标记的区域对异常进行测试,Baier方法的缺陷在于,其检测的质量太依赖于数字图像的质量。实际上,一个对象的数字化图像由于数字化的算法、放大倍率差等在特征的大小和位置上可以呈现出变化。The defect of the Baier method is that the quality of its detection depends too much on the quality of the digital image because it only tests the abnormality by comparing the unmarked areas with the allowable gray levels. In fact, a digitized image of an object may exhibit variations in the size and location of features due to digitization algorithms, magnification differences, and the like.
Baier方法的另一问题在于,几乎需要相同的计算量测试数字图像上不对应于边缘的所有像素,这导致计算资源和时间的浪费。Another problem with Baier's method is that almost the same amount of computation is required to test all pixels on the digital image that do not correspond to edges, which leads to waste of computation resources and time.
Baier方法的又一缺点在于,要表征检测到的缺陷可能是困难的。这种表征对于找到电子电路制造过程中出现的错误模式可能是有用的。Yet another disadvantage of the Baier method is that it can be difficult to characterize detected defects. Such characterizations may be useful for finding error modes that arise during the fabrication of electronic circuits.
在1995年9月19日颁发的标题为“检测半导体组件引线的方法”的美国专利No.5,452,368中,LeBeau提出一种检测物体中缺陷的方法,这是通过比较第一物体的第一灰度级图像与第二物体的第二灰度级图像。更精确地说,对第一图像的边缘特征骨架化(skeletonize)并与第二图像膨胀的边缘特征比较,并反之亦然。与Baier方法相反,LeBeau方法不测试数字图像上非边缘相关的区域。In U.S. Patent No. 5,452,368, issued September 19, 1995, entitled "Method of Detecting Leads of a Semiconductor Component," LeBeau proposes a method of detecting defects in objects by comparing the first gray level of the first object to level image and a second gray level image of the second object. More precisely, the edge features of the first image are skeletonized and compared with the dilated edge features of the second image, and vice versa. In contrast to Baier's method, LeBeau's method does not test non-edge-related regions on the digital image.
然而LeBeau方法的缺点在于,通过比较物体的两个图像来搜索缺陷,而该物体可能在大致相同的位置被非常相似的缺陷改变。LeBeau方法不允许检测这种缺陷。由于错误的制造过程可能引起这种反复出现的缺陷,故这是一主要的缺点。A disadvantage of the LeBeau method, however, is that the defect is searched for by comparing two images of an object, which may be altered by a very similar defect in approximately the same location. The LeBeau method does not allow detection of such defects. This is a major disadvantage since faulty manufacturing processes can cause such recurring defects.
因而,希望有一种方法和系统,允许检测电子电路上的缺陷而不依赖于电子电路数字化图像的质量和分辨率,并且不把灰度的变化解释为缺陷。Thus, it is desirable to have a method and system that allows detection of defects on electronic circuits independent of the quality and resolution of the digitized image of the electronic circuit and without interpreting changes in grayscale as defects.
还希望有使用设计数据的检测缺陷的方法和系统。It is also desirable to have a method and system for detecting defects using design data.
进而希望有这样的方法和系统,它能提供两种水平的检查,一种是检测异常,而另一种是针对缺陷检查这些异常,这有助于使处理速度最大化。It would further be desirable to have a method and system that provides two levels of checking, one for detecting anomalies and one for checking those anomalies against defects, which helps to maximize processing speed.
发明内容Contents of the invention
更具体地,根据本发明,提供了检测至少一层包含组件的印刷电路板(PCB)的表面缺陷的方法,该方法包括:More specifically, according to the present invention, there is provided a method of detecting surface defects of at least one layer of a printed circuit board (PCB) containing components, the method comprising:
提供PCB的数字图像;Provide a digital image of the PCB;
识别PCB图像上的边缘;Identify edges on PCB images;
对PCB的至少一层上的每一组件提供对应的计算机模型;providing a corresponding computer model for each component on at least one layer of the PCB;
通过比较所述被识别边缘与计算机模型检测PCB图像上的异常;以及detecting anomalies on the PCB image by comparing the identified edges with a computer model; and
对于每一被检测的异常,确定被检测到的异常是否对应于表面的缺陷。For each detected anomaly, it is determined whether the detected anomaly corresponds to a defect in the surface.
根据本发明的另一方面,提供了用于检测PCB的表面缺陷的系统;该系统包括:According to another aspect of the present invention, there is provided a system for detecting surface defects of a PCB; the system comprising:
计算机,包含PCB模型并被配置为识别PCB图像边缘,通过比较被识别的边缘与该计算机模型来检测PCB图像上的异常,并对每一检测到的异常,确定检测到的异常是否对应于表面缺陷;a computer comprising a PCB model and configured to identify PCB image edges, detect anomalies on the PCB image by comparing the identified edges to the computer model, and for each detected anomaly, determine whether the detected anomaly corresponds to a surface defect;
连接到计算机向PCB提供照明的照明部件;Lighting components connected to the computer to provide lighting to the PCB;
连接到计算机的帧抓取器(frame grabber);A frame grabber connected to the computer;
连接到帧抓取器以摄取PCB图像的照相机;以及A camera connected to the frame grabber to take images of the PCB; and
连接到帧抓取器的定位系统。A positioning system connected to the frame grabber.
应当注意,术语“PCB”这里应解释为任何可能包含视觉可分辨的表面缺陷的电子电路。It should be noted that the term "PCB" is here to be interpreted as any electronic circuit that may contain visually discernible surface defects.
在阅读以下仅以例子方式参照附图给出的本发明非限制性优选实施例的说明时,对本发明的优点和特征将更为显而易见。Advantages and characteristics of the invention will become more apparent on reading the following description of non-limiting preferred embodiments of the invention, given by way of example only with reference to the accompanying drawings.
附图说明Description of drawings
在附图中:In the attached picture:
图1是表示印刷电路板(PCB)上的缺陷的例子的示意图;FIG. 1 is a schematic diagram showing an example of a defect on a printed circuit board (PCB);
图2是根据本发明的一实施例用于检测PCB上的缺陷的系统的框图;2 is a block diagram of a system for detecting defects on a PCB according to an embodiment of the present invention;
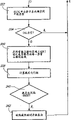
图3是根据本发明的一实施例用于检测PCB上的缺陷的方法的流程图;3 is a flowchart of a method for detecting defects on a PCB according to an embodiment of the present invention;
图4是图3轮廓识别步骤的流程图;Fig. 4 is the flow chart of Fig. 3 contour recognition step;
图5是PCB图像和从其所得的计算机模型的示意图,表示用于这些图像校准的基准点的选择;Figure 5 is a schematic diagram of PCB images and computer models derived therefrom, showing the selection of fiducial points for calibration of these images;
图6a是来自三层PCB模型的重叠多边形的示意图;Figure 6a is a schematic illustration of overlapping polygons from a three-layer PCB model;
图6b是图6a在减去随后的层的多边形的示意图;Figure 6b is a schematic illustration of the polygons of Figure 6a minus subsequent layers;
图6c是图6a的多边形相交部分的示意图;Fig. 6c is a schematic diagram of the intersection of polygons in Fig. 6a;
图7a是图6a的多边形的示意图,表示狭窄的区域;Figure 7a is a schematic illustration of the polygon of Figure 6a, representing a narrow region;
图7b是来自图7a的P1和P3的多边形在膨胀之后的示意图;Figure 7b is a schematic illustration of the polygons from P1 and P3 of Figure 7a after dilation;
图7c是图7a的多边形叠加结果的示意图;Fig. 7c is a schematic diagram of the polygon superposition result of Fig. 7a;
图8是表示检测PCB区域上遗漏的轮廓的示意图;FIG. 8 is a schematic diagram showing detection of missing contours on a PCB area;
图9表示在检测图3的异常之中的缺陷的步骤中定义两个有效半平面(active half-plan)图的示意图;Figure 9 represents a schematic diagram of defining two active half-plan graphs in the step of detecting defects among the abnormalities of Figure 3;
图10是表示当线段不平行时测量线段之间的距离的示意图;Fig. 10 is a schematic diagram representing measuring the distance between line segments when the line segments are not parallel;
图11是表示测量两个平行线段之间积累的间隔的示意图;Figure 11 is a schematic diagram showing the measurement of the accumulated interval between two parallel line segments;
图12是表示确定异常分析区域(AAR)的示意图;FIG. 12 is a schematic diagram showing determination of an abnormal analysis area (AAR);
图13a、13b和13c是确定异常是否违反允许的宽度或间距的方法的流程图;13a, 13b and 13c are flowcharts of methods of determining whether an anomaly violates allowed width or spacing;
图14是表示狭窄的空间区域中缺陷的示意图;Figure 14 is a schematic diagram showing defects in a narrow spatial region;
图15是检测狭窄空间区域中缺陷的决策树;Figure 15 is a decision tree for detecting defects in narrow spatial regions;
图16是来自矢量模型的表示侵蚀处理的多边形的示意图;以及Figure 16 is a schematic diagram of polygons representing erosion processing from a vector model; and
图17图16在侵蚀处理之后的多边形的示意图。Figure 17 Figure 16. Schematic illustration of polygons after erosion processing.
具体实施方式Detailed ways
一般来说,根据本发明的实施例的用于检测PCB表面缺陷的方法包括1)识别PCB数字图像上的边缘,2)通过比较所识别的边缘与PCB的计算机模型检测异常,以及3)通过每一异常的表征确定检测到的异常是否对应于表面的缺陷。In general, a method for detecting PCB surface defects according to an embodiment of the present invention includes 1) identifying edges on a digital image of the PCB, 2) detecting anomalies by comparing the identified edges with a computer model of the PCB, and 3) detecting anomalies by The characterization of each anomaly determines whether the detected anomaly corresponds to a defect in the surface.
因而根据本发明的方法提出两种水平的检查:第一水平,允许快速识别异常并需要相对小的计算时间,以及第二水平,是更为精细的检查,比较识别出的异常与设计规范,以便表征检测到的缺陷。The method according to the invention thus proposes two levels of inspection: a first level, which allows rapid identification of anomalies and requires relatively little computation time, and a second level, which is a more refined inspection, comparing identified anomalies with design specifications, in order to characterize the detected defects.
为了实现这种方法,必须提供被检查的PCB的数字图像和类似的PCB的计算机模型。To implement this method, a digital image of the inspected PCB and a computer model of a similar PCB must be provided.
参见附图的图2,将说明根据本发明的一实施例用于检测PCB表面缺陷的系统20。Referring to Figure 2 of the drawings, a system 20 for detecting surface defects of a PCB according to an embodiment of the present invention will be described.
一般来说,系统20允许聚集进行检查的PCB图像,并使用根据以下将更为详细说明的本发明的方法检测可能的缺陷。In general, the system 20 allows to gather images of PCBs for inspection and to detect possible defects using methods according to the invention as will be described in more detail below.
系统20包括计算机22,帧抓取器24及照明组件26,这两者都连接到计算机22,连接到帧抓取器24的照相机28,及通过轴线控制器32与伺服控制器34连接到帧抓取器24的定位系统30。System 20 includes computer 22, frame grabber 24 and lighting assembly 26, both of which are connected to computer 22, camera 28 connected to frame grabber 24, and connected to frame by
计算机22最好是个人计算机形式,其配置为使得可存储由照相机28摄取的待检查的PCB的图像以及类似的PCB的计算机模型这两者。计算机22还最好被编程,以便控制照明组件26,并进行分析图像、及使用根据本发明的方法评估检查的PCB是否包含表面缺陷所需的计算。The computer 22 is preferably in the form of a personal computer configured such that both the image taken by the camera 28 of the PCB to be inspected and a computer model of a similar PCB can be stored. The computer 22 is also preferably programmed to control the lighting assembly 26 and to perform the calculations needed to analyze the images and evaluate whether an inspected PCB contains surface defects using the method according to the invention.
照明组件26允许调节被检查的PCB上的光强。The lighting assembly 26 allows adjustment of the light intensity on the PCB being inspected.
帧抓取器24是连接照相机28与计算机22的一个卡的形式。帧抓取器24最好能够以两种模式任一种操作。按第一种模式,帧抓取器24逐行捕获图像,并向计算机22发送每一行。在第二这模式下,帧抓取器24在向计算机22发送图像之前一次捕获PCB的整个图像。Frame grabber 24 is in the form of a card that connects camera 28 to computer 22 . Frame grabber 24 is preferably capable of operating in either of two modes. In the first mode, the frame grabber 24 captures the image line by line and sends each line to the computer 22 . In a second mode, the frame grabber 24 captures the entire image of the PCB at one time before sending the image to the computer 22 .
一种可选的传统图像处理卡36最好接口帧抓取器24和计算机22,并允许快速处理由照相机28摄取的图像。当没有包括卡36时,计算机22被配置成可处理图像。An optional conventional
照相机28允许摄取PCB的数字式图像。照相机28最好是可按线性或矩阵模式操作的CCD(电荷耦合器件)照相机形式。照相机28的分辨率可根据所检查的PCB的性质及所需的精度而改变。A camera 28 allows digital images of the PCB to be taken. The camera 28 is preferably in the form of a CCD (charge coupled device) camera operable in linear or matrix mode. The resolution of camera 28 may vary depending on the nature of the PCB being inspected and the precision required.
线性CCD照相机的使用要求定位系统30在垂直于其像素的方向扫描PCB。然而垂直方向获得的分辨率实际上可以是无限的。其线分辨率大约为8000像素。The use of a linear CCD camera requires the positioning system 30 to scan the PCB in a direction perpendicular to its pixels. However, the resolution obtained in the vertical direction can be practically infinite. Its linear resolution is about 8000 pixels.
矩阵CCD照相机具有大约4000×4000像素的分辨率。最好在PCB的稀疏区域使用这种照相机。这种情形下,定位系统30可被设置为在区域之间移动。A matrix CCD camera has a resolution of approximately 4000x4000 pixels. It is best to use this camera on sparse areas of the PCB. In such a situation, the positioning system 30 may be arranged to move between areas.
定位系统30包括允许PCB位于其上的支架运动的轴和伺服电动机(未示出)。The positioning system 30 includes axes and servo motors (not shown) that allow movement of the carriage on which the PCB rests.
轴控制器32允许定位系统30的运动与检查系统20的要求同步。
伺服控制器34控制定位系统30与反馈回路,该回路调节向定位系统30的电动机(未示出)供电所需的电流振幅。
由于认为帧抓取器,伺服控制器,定位系统和CCD照相机是业内熟知的,这里将不对它们作进一步的详细说明。Since frame grabbers, servo controllers, positioning systems and CCD cameras are considered well known in the art, they will not be described in further detail here.
当然,在不背离本发明的精神和本质之下系统20可以有其它的配置。Of course, other configurations of the system 20 are possible without departing from the spirit and essence of the present invention.
系统20显然可以是生产线的一部分。System 20 can obviously be part of a production line.
现在转到图3,将更为详细地说明根据本发明的一实施例用于检测PCB或其它电子电路上的缺陷的方法200。Turning now to FIG. 3 , a method 200 for detecting defects on a PCB or other electronic circuit according to an embodiment of the present invention will be described in more detail.
在步骤202,向计算机22提供PCB的数字图像。该图像最好是具有灰度级的位图形式的。灰度级数可根据精度的需要的变化。根据本发明的一最佳实施例,系统20产生并分析具有256级灰度的数字图像。另外,原始的图像也可以有其它的格式,并增加转换步骤以提供位图图像。At step 202 , a digital image of the PCB is provided to computer 22 . The image is preferably in the form of a bitmap with gray scale. The number of gray levels can be changed according to the needs of precision. According to a preferred embodiment of the present invention, system 20 generates and analyzes digital images having 256 gray levels. In addition, the original image can also have other formats, and the conversion step is added to provide a bitmap image.
在步骤204,识别PCB图像上的轮廓。步骤204产生实际的轮廓图(ACC),它是PCB图像上轮廓的表示。正如以下将要解释的,将以比由系统20摄取的PCB图像的分辨率更大的分辨率计算轮廓的位置。步骤204概括在图4中。At step 204, contours on the PCB image are identified. Step 204 produces an actual contour map (ACC), which is a representation of the contours on the PCB image. As will be explained below, the position of the outline will be calculated at a resolution greater than that of the PCB image taken by the system 20 . Step 204 is summarized in FIG. 4 .
在子步骤204a(图4),校正PCB图像的光度(luminosity)。更具体来说,最好使用以下方程式使图像的光度(像素亮度)规格化:In sub-step 204a (FIG. 4), the PCB image is corrected for luminosity. More specifically, it is best to normalize the luminosity (pixel brightness) of an image using the following equation:
lum=256×(lum-LUM_MIN)/(LUM_MAX-LUM_MIN) (1)lum=256×(lum-LUM_MIN)/(LUM_MAX-LUM_MIN) (1)
其中lum是图像的每一像素的光度;where lum is the luminosity of each pixel of the image;
LUM_MIN是图像的最黑暗区域中的平均光度;以及LUM_MIN is the average luminance in the darkest region of the image; and
LUM-MAX是图像的最明亮区域中的平均光度。LUM-MAX is the average luminosity in the brightest areas of the image.
以上的方程式允许像素的强度分布在LUM_MIN与LUM_MAX之间,以便覆盖所有256灰度级。The above equation allows the intensity of the pixel to be distributed between LUM_MIN and LUM_MAX in order to cover all 256 gray levels.
显然,以上方程式可以根据图像的灰度级数校正。也可以使用其它规格化方程式。Obviously, the above equation can be corrected according to the gray scale of the image. Other normalization equations may also be used.
虽然子步骤204a是可选的,但发现校正光度对于增加确定阈值的子步骤(204d)的效率是有益的。Although sub-step 204a is optional, correcting the luminosity has been found to be beneficial to increase the efficiency of the sub-step of determining the threshold (204d).
应当相信理解确定最黑暗和最明亮区域的算法是在业内专业人员的知识范围之内。It is believed to be within the purview of those skilled in the art to understand the algorithm for determining the darkest and brightest regions.
可选的子步骤204b中,PCB图像被过滤,以降低图像数字化所引起的噪声。以下高斯滤波器最好施加到3乘3像素窗口上(八连接窗口):In optional sub-step 204b, the PCB image is filtered to reduce noise caused by image digitization. The following Gaussian filter is best applied to a 3 by 3 pixel window (eight-connected window):
121121
242242
121121
高斯滤波器可施加到具有其它尺寸的像素窗口。也可使用其它类型的滤波器。Gaussian filters can be applied to pixel windows with other sizes. Other types of filters may also be used.
在子步骤204c,使用通常的Prewitt方法在八连接窗口上计算数值梯度。另外,也可以使用其它的方法。梯度的强度存储在一新的图像中。由于Prewitt方法被认为在业内是熟知的,在以不再详述。In sub-step 204c, numerical gradients are computed over eight-connected windows using the usual Prewitt method. In addition, other methods may also be used. The strength of the gradient is stored in a new image. Since the Prewitt method is considered to be well known in the art, it will not be described in detail.
然后比较梯度图像与预定的阈值,以识别图像中光度变化迅速的区域中的像素(步骤204d)。这些区域通常对应于图像中重叠轮廓的像素轨迹。The gradient image is then compared to a predetermined threshold to identify pixels in regions of the image where the luminosity changes rapidly (step 204d). These regions generally correspond to pixel trajectories of overlapping contours in the image.
在子步骤204e,通过对在子步骤204d识别出的像素轨迹的骨架化而计算边缘的第一近似。实际上,图像上每一边缘对应于一串连接的像素,每一像素在八连接窗口中具有至少一个邻域。骨架化处理过程允许像素串呈现出具有一个像素宽度的轨迹。该结果最好被保存在具有与原始图像相同尺寸但只有二值,即对于属于边缘的像素为1,而对其它像素为0的图像文件(ACCimage)中。In sub-step 204e, a first approximation of the edge is computed by skeletonizing the pixel trajectory identified in sub-step 204d. In fact, each edge on the image corresponds to a chain of connected pixels, each pixel having at least one neighborhood in an eight-connected window. The skeletonization process allows strings of pixels to appear as trajectories with a width of one pixel. The result is preferably saved in an image file (ACC image ) that has the same dimensions as the original image but only has binary values,
子步骤204f中,按形成ACC的像素的坐标列出ACCimage像素的每一串。如以下将要说明的,这些坐标只是实际坐标的第一估计。In sub-step 204f, each string of ACC image pixels is listed by the coordinates of the pixels forming the ACC. As will be explained below, these coordinates are only a first estimate of the actual coordinates.
更精确来说,该串遵循反时针方向,且每一连续的像素的坐标保存在文件中:ACC。因而,ACC包含一系列矢量,每一个表示着图像轮廓之一的坐标。More precisely, the string follows an anti-clockwise direction, and the coordinates of each successive pixel are saved in the file: ACC. Thus, ACC contains a series of vectors, each representing the coordinates of one of the image contours.
然后逐像素分析每一轮廓,以便通过二阶导数上的零估计通路的位置,已发现该导数是光度转折点坐标的可靠指示。认为对应的像素是轮廓的一部分,因为光度外形的转折点是两种材料之间过度的指示。Each profile was then analyzed pixel by pixel to estimate the position of the pathway by the zero on the second derivative, which has been found to be a reliable indicator of the coordinates of the photometric turning point. The corresponding pixels are considered to be part of the profile, since a turning point in the photometric profile is an indication of the transition between the two materials.
更精确地,该处理过程首先在于在每个像素找出垂直于轮廓的方向的估计。为实现这一点,首先作一条线拟合在当前像素位置,包含在同一轮廓上之前的2个像素和之后的2个像素。拟合的线指示在该像素位置轮廓切线的角度。增加90度就获得垂直方向。然后在作为由系统20最初摄取的原始PCB图像中,抽取沿该方向并穿过当前像素的光度外形(profile)。对光度外形计算二阶导数。二阶导数的零通路对应于光度外形的转折点。这点的坐标保存在ACC中,代替坐标的第一估计。More precisely, the process first consists in finding at each pixel an estimate of the direction perpendicular to the contour. To achieve this, a line is first fitted at the current pixel location, containing 2 pixels before and 2 pixels after on the same contour. The fitted line indicates the angle of the tangent to the contour at that pixel location. Add 90 degrees to get the vertical orientation. A photometric profile along that direction and through the current pixel is then extracted in the raw PCB image as originally captured by the system 20 . Computes the second derivative of the photometric profile. The zero passage of the second derivative corresponds to the turning point of the photometric profile. The coordinates of this point are stored in the ACC instead of the first estimate of the coordinates.
当然,也可以使用其它数值方法找出在每一像素垂直于轮廓的方向的估计。Of course, other numerical methods can also be used to find an estimate of the direction perpendicular to the contour at each pixel.
相信考虑从受检查的PCB数字图像抽取轮廓的其它方法,应是业内专业人员知识范围之内的事情。It is believed to be within the knowledge of those skilled in the art to consider other methods of extracting contours from digital images of PCBs under inspection.
正如在步骤208将更为详细说明的,通过比较保存在ACC中及ACCimage中的轮廓位置与所设计的轮廓位置,检测出受检查的PCB上的异常。实际上,如果其位置不同于其设计的位置,则轮廓或轮廓的一部分在ACC上是可怀疑的。As will be described in more detail in step 208, abnormalities on the inspected PCB are detected by comparing the contour positions stored in the ACC and in the ACC image with the designed contour positions. In fact, a profile or part of a profile is suspect on the ACC if its position differs from that for which it was designed.
然后在方法200(图3)的步骤206中,提供受检查的PCB计算机模型。计算机模型最好包含组件轮廓每一层的多边形形式的矢量模型。除了作为轮廓的适当的表示,已发现多边形对于与ACC比较的有效的模型,这将在以下说明。Then in step 206 of method 200 (FIG. 3), a computer model of the PCB under inspection is provided. The computer model preferably includes a vector model in polygonal form of each layer of the component outline. In addition to being an adequate representation of contours, polygons have been found to be effective models for comparison with ACC, as will be explained below.
PCB传统的Gerber模型最好转换为矢量模型,其中每一层的每一组件表示为一多边形。当然,如果把弧形边缘以短角顶表示,即使包含圆弧的元素也可以表示为适当的矢量模型。另外,如果没有PCB的Gerber模型,也可使用PCB的其它多层模型以抽取相关的信息。Traditional Gerber models of PCBs are best converted to vector models, where each component of each layer is represented as a polygon. Of course, even elements containing arcs can be represented as proper vector models if the arc edges are represented as short corner vertices. In addition, if there is no Gerber model of PCB, other multi-layer models of PCB can also be used to extract relevant information.
在比较PCB的矢量模型与ACC及ACCimage之前,可以对矢量模型进行变换,以便使该模型与图像对准。当然,PCB制造期间,各层通常是由不同的机器在不同时刻施加的,各层的接正可能稍微不同。这时最好有PCB的多层模型,并根据受检查的PCB重新校准模型的各层,这样可产生较好的PCB模型。Before comparing the vector model of the PCB with the ACC and the ACC image , the vector model can be transformed to align the model with the image. Of course, during PCB manufacturing, each layer is usually applied by different machines at different times, and the connection of each layer may be slightly different. It is best to have a multi-layer model of the PCB at this time, and recalibrate the layers of the model based on the inspected PCB, which can produce a better PCB model.
对于每一层,选择预定的点作为校准处理的基准。从表示层32和PCB图像34的模型的图5能够较好看出,已经发现最好选择水平36和垂直38线段的交叉点40作为基准点。显然,没有被来自另一层的元件覆盖的层的区域提供了更可靠的基准点。应当注意,由于PCB图像34包含所有的层,PCB图像34包含诸如组件42这样的不是出现在单独一层模型32上的组件。For each layer, a predetermined point is selected as a reference for the calibration process. As can be seen better from Figure 5, which shows a model of the
一旦建立了基准点的列表,就能够在一层的每一点上施加以下的变换,以便根据PCB图像上的基准点校准该点:Once the list of fiducial points is established, the following transformation can be applied to each point of a layer to calibrate that point against the fiducial points on the PCB image:
其中(u,v)是PCB图像中的坐标,where (u, v) are the coordinates in the PCB image,
(x,y)是层模型中的坐标,(x, y) are the coordinates in the layer model,
及 au,bu,cu,dd和ee是允许补偿在PCB图像和模型之间旋转、平移、缩放及透视的系数。这些系数对每一层可能是不同的。and a u , b u , c u , dd and ee are coefficients that allow compensation of rotation, translation, scaling and perspective between the PCB image and the model. These coefficients may be different for each layer.
最好在检查PCB之前选择基准点,以将计算机延时最小化。It is best to choose fiducials before inspecting the PCB to minimize computer delays.
一旦模型的所有层都被校准,它们所有都被叠加。Once all layers of the model are calibrated, they are all superimposed.
由于模型所有的层包含多个多边形,2层的叠加就在于把第一层的每一多边形与来自第二层的所有多边形叠加。例如如果模型包含第三层,则来自第三层的多边形与来自前两层叠加结果的新的多边形叠加。Since all layers of the model contain multiple polygons, 2-layer overlay consists in overlaying each polygon of the first layer with all the polygons from the second layer. For example, if the model contains a third layer, the polygons from the third layer are overlaid with new polygons from the overlay results of the first two layers.
这一叠加过程示于图6a到6c。This superposition process is shown in Figures 6a to 6c.
图6a示出包含三个逐层叠加的多边形P1、P2和P3的三层模型。叠加在于把多边形P3(Pv3)叠加到多边形P1和P2的叠加结果之上。Fig. 6a shows a three-layer model comprising three polygons P1, P2 and P3 superimposed layer by layer. The superposition consists in superimposing the polygon P3 (Pv3) on the superposition result of the polygons P1 and P2.
P2在P1上的叠加产生:Superposition of P2 on P1 yields:
Pv1=P1-P2 (4)Pv1=P1-P2 (4)
Pv2=P2 (5)Pv2=P2 (5)
在P2叠加到P1上之后,P2保持原样不动,同时P1必须减去P2的重叠的部分。P3在P2和P1的叠加上的叠加产生(参见图6b):After P2 is superimposed on P1, P2 remains unchanged, and P1 must subtract the overlapping part of P2. The superposition of P3 on the superposition of P2 and P1 yields (see Figure 6b):
Pv1=P1-P2-P3 (6)Pv1=P1-P2-P3 (6)
Pv2=P2-P3 (7)Pv2=P2-P3 (7)
Pv3=P3 (8)Pv3=P3 (8)
在某些情形下,2个多边形的减去会产生孤立的多边形。Pv1和Pv1可被看作是多边形列表。当按层有多于一个的多边形时,P1、P2和P3也可被看作是多边形列表。In some cases, the subtraction of 2 polygons can produce isolated polygons. Pv1 and Pv1 can be viewed as lists of polygons. When there is more than one polygon by layer, P1, P2 and P3 can also be considered as polygon lists.
叠加的过程允许指出重叠的区域。在叠加新的层之后重叠区域上的多边形必须被更新。The process of overlaying allows to point out areas of overlap. The polygons in the overlapping area must be updated after overlaying the new layer.
在图6c上明显可见,O21是在与P3叠加之后P1和P2求交所得的结果的多边形。It is evident on Figure 6c that O21 is the polygon resulting from the intersection of P1 and P2 after being superimposed on P3.
又由于两个多边形或两个多边形的相交或两个多边形之间的差可能产生一个以上的多边形,O21这里必须解释为多边形列表。如果层1和2之间没有多边形重叠,该列表可以不包含多边形。And since two polygons or the intersection of two polygons or the difference between two polygons may produce more than one polygon, O21 must be interpreted here as a list of polygons. This list can contain no polygons if no polygons overlap between
如以下将要描述的那样,上述的叠加过程还允许保持狭窄区域的踪迹。狭窄区域的一个例子是图7a中的区域T31。区域T31是如下被抽取的。As will be described below, the superposition process described above also allows keeping track of narrow regions. An example of a narrow region is region T31 in Fig. 7a. The region T31 is extracted as follows.
从图7b可见,多边形P1和P3被膨胀而产生D(Pv1)和D(P3)。这时发现它们之间的相交产生显然包含被抽取的区域的多边形D31。多边形O31被膨胀而产生从D31抽取的D(O31),产生狭窄区域T31(参见图7c)。As can be seen from Figure 7b, polygons P1 and P3 are dilated to produce D(Pv1) and D(P3). It is now found that the intersection between them yields polygon D31 which apparently contains the extracted area. Polygon O31 is dilated to produce D(O31) extracted from D31, resulting in narrow region T31 (see Fig. 7c).
图7a到图7c所示的操作概括为以下的公式:The operations shown in Figures 7a to 7c are summarized in the following equation:
T31=(D(P3)∧D(Pv1))-D(O31) (9)。T31=(D(P3)∧D(Pv1))-D(O31) (9).
由于以下的原因,这里T31又可看作是多边形列表:两个多边形的相交可以产生多于一个的多边形,并且D(O31)也可以产生一个以上的多边形。Here again T31 can be seen as a list of polygons for the following reasons: the intersection of two polygons can produce more than one polygon, and D(O31) can also produce more than one polygon.
总之,层的叠加产生以下三种结果:In summary, the stacking of layers produces the following three results:
Pvk+1=(Pvk+1-Pk+1)∪Pk+1 (10),Pv k+1 =(Pv k+1 -P k+1 )∪P k+1 (10),
可见多边形的列表;list of visible polygons;
Ok+1=(Ok-Pk+1)∪(Pk+1∩Pvk) (11),O k+1 = (O k -P k+1 )∪(P k+1 ∩Pv k ) (11),
来自重叠区域的多边形列表;以及a list of polygons from overlapping regions; and
Tk+1=(Tk-Pk+1)∪((D(Pk+1)∩D(Pvk))-D(Pk+1∩Pvk)) (12)T k+1 =(T k -P k+1 )∪((D(P k+1 )∩D(Pv k ))-D(P k+1 ∩Pv k )) (12)
来自狭窄区域的多边形列表,A list of polygons from a narrow area,
其中in
T1=D(P1)∩D(P1) (13);以及T 1 =D(P 1 )∩D(P 1 ) (13); and
O1是零(空)。O 1 is zero (empty).
该过程是迭代的,即每一个新的层被叠加到通过以前层的叠加所得的Pvk,Ok,Tk。K指示已叠加的层的数目。The process is iterative, ie each new layer is superimposed on the Pv k , Ok , T k obtained by the superposition of previous layers. K indicates the number of superimposed layers.
多边形列表上进行的运算是含并(union)、相交(intersection)、减(subtraction)和膨胀(dilatation)。合并(∪)在于把两个多边形列表组合成单个列表。两个列表相交(∩)在于来自第一列表的每一多边形与来自第二个列表的每一多边形相交。类似地,当两个列表减时,对第一个列表的每一个多边形减去第二个列表的所有多边形。The operations performed on polygon lists are union, intersection, subtraction, and dilatation. Merge (∪) consists in combining two lists of polygons into a single list. Two lists intersect (∩) in that every polygon from the first list intersects every polygon from the second list. Similarly, when subtracting two lists, all polygons in the second list are subtracted from every polygon in the first list.
可见的多边形Pvk列表描述了应当在PCB图像上出现的所有轮廓。然而,上述的列表Pvk并不是适合于与ACC快速比较的格式。实际上,ACC中的每一点应当与来自Pvk的至少一个多边形段对应,以保证快速比较。The list of visible polygons Pv k describes all outlines that should appear on the PCB image. However, the list Pv k above is not in a format suitable for quick comparison with ACC. In fact, each point in ACC should correspond to at least one polygon segment from Pv k to ensure fast comparison.
转换列表Pvk以便以它同下一个顶点形成的线段代替每一多边形顶点产生特征轮廓图(CCC)。这样CCC的线段被划分为多边形列表,包含所有它们的线段而不是整个顶点的描述,如同在Pvk列表那样。更具体地,CCC中的每一线段由一直线的方程式、直线的端点坐标,及该线段允许的距离阈值表征。此外,CCC对所有的多边形包含接近封闭该多边形的矩形的表征。这矩形被膨胀到保证ACC中没有被封闭在该矩形中的每一点不对应于多边形的线段。Transforming the list Pvk to replace each polygon vertex with the line segment it forms with the next vertex produces a characteristic contour map (CCC). Such CCC segments are partitioned into polygon lists containing descriptions of all their segments rather than entire vertices, as in the Pv k list. More specifically, each line segment in the CCC is characterized by the equation of a line, the endpoint coordinates of the line, and the allowable distance threshold of the line segment. In addition, CCC represents for all polygons that contain a rectangle close to enclosing the polygon. The rectangle is inflated to ensure that every point in the ACC not enclosed in the rectangle does not correspond to a line segment of the polygon.
异常的检测abnormal detection
一旦生成CCC,方法200(参见图3)的步骤208在于通过比较ACC中的轮廓与现在为CCC形式的计算机模型而检测PCB上的异常。更具体来说,异常最好在以下两种图中被指出和表征:Once the CCC is generated, step 208 of the method 200 (see FIG. 3 ) consists in detecting anomalies on the PCB by comparing the contours in the ACC with the computer model now in the form of the CCC. More specifically, anomalies are best pointed out and characterized in the following two diagrams:
ECC,超越轮廓图(Excess Contour Chart),及ECC, Excess Contour Chart, and
MCC,遗漏轮廓图(Missing Contour Chart)MCC, Missing Contour Chart
按超越检测轮廓的第一步骤是要找到对应于ACC中每一点的CCC中的线段。如果一点不充分靠近CCC的任何线段,它被看作是处于超越并被保存在ECC中。计算的距离与预定的阈值比较。ECC的格式与ACC相同;它是轮廓的一个列表,每一轮廓由连接的点的一个列表表征。The first step in detecting contours by transcendence is to find the line segments in CCC that correspond to each point in ACC. If a point is not sufficiently close to any line segment of the CCC, it is considered to be beyond and is stored in the ECC. The calculated distance is compared with a predetermined threshold. The format of ECC is the same as ACC; it is a list of contours, each contour represented by a list of connected points.
更具体来说,对于ACC中每一点:More specifically, for each point in ACC:
·CCC被扫描直到其列出的矩形之一围住该点;The CCC is scanned until one of its listed rectangles encloses the point;
·对应的多边形被扫描直到找到该点可以对应的点的线段;The corresponding polygon is scanned until a line segment of the point to which the point can correspond is found;
·如果没有线段对应于该点,扫描另一多边形;· If no line segment corresponds to the point, scan another polygon;
·如果检测到一线段,处理过程继续到一个点,但是最好以相同的线段开始。实际上,由于形成多边形的点是相继的,下一个点对应于相同线段的概率很大;• If a line segment is detected, processing continues to a point, but preferably starts with the same line segment. In fact, since the points forming the polygon are consecutive, there is a high probability that the next point corresponds to the same line segment;
·不对应于任何线段的点在ECC中被指出。如果该点是连续的一系列点的一部分,它则在ECC中作为这一系列的部分被记录。• Points that do not correspond to any line segment are indicated in the ECC. If the point is part of a continuous series of points, it is recorded in the ECC as part of the series.
对于ACC的每一轮廓,在ACC和CCC中各点最好以相同的方向被扫描。For each profile of the ACC, the points in the ACC and CCC are preferably scanned in the same direction.
当然,可以使用其它的方法检测ACC中的超越轮廓。Of course, other methods can be used to detect overrunning contours in the ACC.
现在更为详细地说明遗漏轮廓的检测。The detection of missing contours is now described in more detail.
遗漏轮廓的检测也意味着对CCC中轮廓位置偏离太多的轮廓的检测。对于高密度的电子电路,轮廓的允许偏离带相对是狭窄的。但是由于CCC是矢量的形式,其分辨率不限于图像的分辨率。类似地,ACC的分辨率是图像分辨率的7到8倍,因为在以子像素分辨率检测轮廓之后ACC已被编译过。这一点是有益的,因为这允许即使当最大允许偏离狭窄时也能检测放错的轮廓。The detection of missing contours also implies the detection of contours whose position deviates too much in the CCC. For high-density electronic circuits, the allowable deviation band of the profile is relatively narrow. But because CCC is in the form of vector, its resolution is not limited to the resolution of the image. Similarly, the resolution of the ACC is 7 to 8 times the image resolution because the ACC has been compiled after detecting contours at sub-pixel resolution. This is beneficial as it allows detection of misplaced contours even when the maximum allowed deviation is narrow.
应当注意,遗漏轮廓的检测就精密度来说是相对没有约束的。遗漏轮廓检测过程的目的只是要验证,CCC上的轮廓是否在PCB的图像上没有。其实,出现在PCB图像上但相对于计算机模型放错的轮廓,将通过超越轮廓过程的检测而检测,并在ECC上指出。因而,遗漏轮廓的检测能够以图像的分辨率实现,这样就能够通过比较图像进行。It should be noted that the detection of missing contours is relatively unconstrained in terms of precision. The purpose of the missing contour detection process is just to verify if the contour on the CCC is missing on the image of the PCB. In fact, contours that appear on the PCB image but are misplaced relative to the computer model will be detected by the detection beyond the contour process and indicated on the ECC. Thus, the detection of missing contours can be achieved at the resolution of the images, which can then be done by comparing the images.
为了获得MCC,CCC上的轮廓首先被绘制到二元图像上,即与ACCimage有相同的分辨率的CCCimage。比较CCCimage与ACCimage,产生MCC,这概括为以下的方程式:To obtain the MCC, the contours on the CCC are first drawn onto the binary image, i.e. the CCC image with the same resolution as the ACC image . Comparing the CCC image with the ACC image yields the MCC, which is summarized by the following equation:
MCC=D(ACCimage)CCCimage∩CCCimage (15)MCC=D(ACC image )CCC image ∩CCC image (15)
这里D(ACCimage)是膨胀之后的ACCimage。计算MCC的处理过程还总结在图8中。Here D(ACC image ) is the ACC image after dilation. The process of computing the MCC is also summarized in FIG. 8 .
MCC和ECC包括对应于PCB图像中异常的区域描述。这些区域在方法200的步骤210中被检查(参见图3),以检测缺陷。MCC and ECC include descriptions of regions corresponding to anomalies in PCB images. These areas are inspected in step 210 of method 200 (see FIG. 3 ) to detect defects.
异常的检查exception check
由于异常能够在ECC中产生一个以上的轮廓,但是ECC的每一个轮廓只对应于一个异常,故ECC的每个轮廓最好看作是独立的异常并分别被检查。当ECC中所有的轮廓已经被检查时,检查过程就结束。被发现超过预定的制造标准的ECC中的轮廓最好被在文件中指明并表征。Since anomalies can generate more than one profile in an ECC, but each profile of an ECC corresponds to only one anomaly, each profile of an ECC is best viewed as a separate anomaly and examined separately. The checking process ends when all profiles in the ECC have been checked. Profiles in the ECC that are found to exceed predetermined manufacturing standards are preferably indicated and characterized in the documentation.
在不背离本发明的精神和性质之下该文件可以采取许多形式,例如可以包括缺陷的位置和尺寸,以及由这种缺陷被弯曲的PCB的描述。This documentation may take many forms without departing from the spirit and nature of the invention, and may include, for example, the location and size of defects, and a description of the PCB that was bent by such defects.
能够在PCB上发现的大部分缺陷对应于在PCB上印刷的元件的错误的宽度,或这些元件之间不正确的间隔。当元件的宽度或两个元件之间的距离与设计规范差异太大时,其它的异常,诸如污染物,沟槽,及毛刺可能成为问题。Most of the defects that can be found on a PCB correspond to wrong widths of components printed on the PCB, or incorrect spacing between these components. Other anomalies such as contamination, grooves, and burrs can become a problem when the width of a component or the distance between two components differs too much from design specifications.
当以下两个之一超过制造标准时,异常中的缺陷被检测:其上有异常的元件的宽度,及如果异常不在元件上,两个相邻元件之间的距离。如以下所述,这两个条件是独立地被检验的。A defect in an anomaly is detected when one of the following exceeds the manufacturing standard: the width of the element on which the anomaly is located, and, if the anomaly is not on the element, the distance between two adjacent elements. These two conditions were independently tested as described below.
这两个条件的验证很类似。一般来说,在两种情形下,可在异常的邻域中找到的CCC的所有线段都存储在一列表形式的计算机文件中,这里称之为邻域线段列表(NSL)。对于异常附近的每一线段,找到与第一线段相对的NSL的每一其它线段。验证第一线段与所有这些相对的线段之间的距离,以便评估该距离是否在设计或制造标准之内。那些标准显然是预先确定的并预先存储在计算机文件中,以便可由计算机32访问。The verification of these two conditions is very similar. Generally, in both cases, all segments of the CCC that can be found in the anomalous neighborhood are stored in a computer file in the form of a list, referred to herein as the Neighborhood Segment List (NSL). For each line segment near the anomaly, find every other line segment of the NSL opposite the first line segment. The distance between the first line segment and all such opposing line segments is verified in order to assess whether the distance is within design or manufacturing criteria. Those criteria are obviously predetermined and pre-stored in a computer file so as to be accessible by the
如以下将解释的那样,两个线段之间的距离的验证和它们之间的宽度的验证的区别仅在于怎么考虑两个相对的线段的定义。As will be explained below, the verification of the distance between two line segments and the verification of the width between them differ only in how the definitions of the two opposing line segments are taken into account.
如图9中所见,轮廓的每一线段,诸如线段44,可被解释为2个半平面46和48的边界。在线段44的与轮廓50相对的一侧的平面46,是在线段44的“外”侧。在线段44与轮廓50相同的一侧的平面48,被称为线段44的“材料”(material)侧。当验证线段44与“相对”(opposed,对立)线段52之间的距离时,材料侧设置为“有效”(active)的。As seen in FIG. 9 , each line segment of the contour, such as line segment 44 , can be interpreted as the boundary of 2 half-planes 46 and 48 . The plane 46 on the side of the line segment 44 opposite the profile 50 is the "outer" side of the line segment 44 . The plane 48 on the same side of the line segment 44 as the profile 50 is referred to as the "material" side of the line segment 44 . When verifying the distance between segment 44 and the "opposed" segment 52, the material side is set to "active".
当段44与56之间的轨迹54的宽度被检验时,外侧是有效的。两个线段,如果它们彼此面对并如果它们在相同的有效平面内,则被配对分析。在图9的例子中,线段52,58和60可选地与线段44配对。When the width of trace 54 between segments 44 and 56 is examined, the outer side is valid. Two line segments are analyzed as a pair if they face each other and if they are in the same effective plane. In the example of FIG. 9 , line segments 52 , 58 and 60 are optionally paired with line segment 44 .
检测过程使用的阈值最好以百分数表示,这样提供统一的方法,对于每一新的电路类型,不需要对宽度和距离新的阈值进行编程。当然,百分数是根据设计值表示的。例如,当如果两个线段之间的距离小于设计的两倍将成为问题时,则阈值被设置为50%。The thresholds used by the detection process are preferably expressed as a percentage, which provides a uniform approach without the need to program new thresholds for width and distance for each new circuit type. Of course, percentages are expressed according to design values. For example, when it would be a problem if the distance between two line segments was less than twice the design, the threshold was set at 50%.
显然,基于绝对值的阈值也可以用来检验线段之间的宽度。Obviously, thresholding based on absolute values can also be used to check the width between line segments.
可以选择不同的方法确定两个线段之间的间隔,这取决于线段的取向及是否两个线段之间有一个或多个异常。Different methods can be chosen to determine the spacing between two line segments, depending on the orientation of the line segments and whether there are one or more anomalies between the two line segments.
如果是在两个平行的线段之间检测到异常,这两个线段之间的间隔就被简单地定义为这两个线段之间的距离。If the anomaly is detected between two parallel line segments, the interval between these two line segments is simply defined as the distance between these two line segments.
如果两个线段62和64不平行(参见图10),该间隔被任意定义为它们之间的角度。这种情形下,一个点到基准线段62的距离被如下测量:测量穿过两个线段之间的交叉点68与该点的直线66。该点与基准线段之间的距离定义为直线66与基准线段62之间的角度72。If the two line segments 62 and 64 are not parallel (see Fig. 10), the separation is arbitrarily defined as the angle between them. In this case, the distance of a point to the reference line segment 62 is measured by measuring a straight line 66 passing through the point of intersection 68 between the two line segments. The distance between this point and the reference line segment is defined as the angle 72 between the line 66 and the reference line segment 62 .
在两种情形下,都要计算异常的每一点与基准线段(相对的线段)之间的距离。记录的最大和最小距离定义了包含异常的区间(interval)。在异常存在时,两个线段之间的有效间隔是两个线段之间的间隔减去该区间。规范化的间隔是有效间隔与两个线段之间的间隔的比率。In both cases, the distance between each point of the anomaly and the reference line segment (opposite line segment) is calculated. The maximum and minimum distances recorded define the interval that contains the exception. In the presence of anomalies, the effective interval between two line segments is the interval between the two line segments minus the interval. The normalized interval is the ratio of the effective interval to the interval between two line segments.
图11示出,当在两个线段80和82之间检测出多个异常74、76和78时,间隔计算的一个例子。FIG. 11 shows an example of interval calculation when multiple anomalies 74 , 76 and 78 are detected between two line segments 80 and 82 .
这种情形下,对于每一异常计算区间。如果一个以上的异常的区间重叠(例如参见异常74和76),这些区间被再分组,以形成单个的累积区间(a-c)。累积的(a-c)和非累积的(d-e)区间被相加而产生有效的间隔。再次,规范化的间隔是两个线段之间有效间隔与实际间隔之间的比率。In this case, intervals are calculated for each exception. If the intervals of more than one anomaly overlap (see eg anomalies 74 and 76), these intervals are regrouped to form a single cumulative interval (a-c). The cumulative (a-c) and non-cumulative (d-e) intervals are summed to produce the effective interval. Again, the normalized interval is the ratio between the effective interval and the actual interval between two line segments.
间隔和宽度的检验只是在异常附近的PCB图像区域中进行。以下的描述说明了这些区域是怎样被确定的。这些区域这里将称为异常分析区域(AAR)。The inspection of spacing and width is only performed in the area of the PCB image near the anomaly. The following description shows how these areas are determined. These areas will be referred to herein as Anomaly Analysis Areas (AARs).
现在转向图12,首先作为围住异常86的矩形84确定AAR。如果已知形成异常86的轮廓的点的坐标,可以使用熟知的算法确定这种矩形。Turning now to FIG. 12 , the AAR is first determined as the rectangle 84 enclosing the anomaly 86 . Such a rectangle can be determined using well known algorithms if the coordinates of the points forming the outline of the anomaly 86 are known.
然后通过由以下定义的膨胀因子(DF)膨胀矩形84:The rectangle 84 is then inflated by a dilation factor (DF) defined by:
这里%res是规范化的间隔或规范化的宽度上的预定阈值,以产生有效AAR 88。Here %res is a predetermined threshold on the normalized interval or normalized width to produce an effective AAR88.
在矩形88围住的区域之外的元素最好不考虑作进一步分析,因为预先假设它们不会与异常86的组合引起缺陷。然而,对按上述配对并在AAR 88中的所有的线段89-91和89-91’要检查缺陷。Elements outside the area enclosed by rectangle 88 are preferably not considered for further analysis since it is presupposed that they will not cause defects in combination with anomaly 86 . However, all segments 89-91 and 89-91' paired as above and in AAR 88 are checked for defects.
当在步骤208(参见图3)检测到异常并保存在ECC中时,最好对每一异常确定AAR。When anomalies are detected and stored in the ECC at step 208 (see FIG. 3), an AAR is preferably determined for each anomaly.
如果第二个异常的AAR与第一个异常的AAR重叠,则设想这两个异常的组合能够引起缺陷。当检查异常的缺陷时,当作似乎其AAR没有重叠其它异常的AAR那样进行检验。如果是这样,则生成一新的围住所有涉及到的异常的矩形。新的矩形被膨胀而产生一新的AAR,且重复这最后的处理直到新的AAR不重叠任何其它的AAR为止。在该AAR中,再对所有的线段对检验其缺陷。If the AAR of the second anomaly overlaps with the AAR of the first anomaly, it is assumed that the combination of the two anomalies can cause the defect. When examining anomalies for defects, they are checked as if their AARs did not overlap the AARs of other anomalies. If so, generate a new rectangle surrounding all involved exceptions. The new rectangle is inflated to generate a new AAR, and this final process is repeated until the new AAR does not overlap any other AAR. In this AAR, all line segment pairs are then checked for defects.
由于ARR可能包含一个以上的异常或在大小上可能是相对重要的,可以进行测试以检验是否每一异常都位于两个线段之间的中间间隔中。最好实现以下两个规则进行该测试。Since the ARR may contain more than one anomaly or may be relatively important in size, a test can be performed to check whether each anomaly is located in the intermediate interval between two line segments. It is best to implement the following two rules for this test.
第一个条件是说,定义ARR的矩形应当重叠两个配对的线段的两个有效半平面。The first condition says that the rectangle defining the ARR should overlap the two valid half-planes of the two paired line segments.
第二个条件意思是,两个线段应当充分靠近。更具体地,使用以下的准则:第一和第二线段之间的异常的距离之和应当小于它们之间的最大距离的一半。两个线段之间的最大距离被保存并在这里将称为dsegmax。虽然已经发现这种准则可产生良好的结果,其它的准则也可以用来确定两个线段是否充分靠近来被检查。The second condition means that the two line segments should be sufficiently close. More specifically, the following criterion is used: the sum of the anomalous distances between the first and second line segment should be less than half of the maximum distance between them. The maximum distance between two line segments is stored and will be referred to here as dsegmax. While this criterion has been found to produce good results, other criteria can be used to determine whether two line segments are close enough to be checked.
当第一和第二个条件满足时,认为异常在两个线段之间的中间间隔内,并认为相对的一对线段被检查缺陷。When the first and second conditions are met, the anomaly is considered to be in the middle interval between two line segments, and the opposite pair of line segments is considered to be checked for defects.
现在转向图13a、13b和13c,将说明方法300,该方法确定异常是否由于违反允许的宽度或间隔而引起缺陷。Turning now to Figures 13a, 13b and 13c, a
诸如以下将要说明的那样,在狭窄空间区域和重叠区域的情形下,将要另外进行两个附加的检查。In the case of narrow space areas and overlapping areas, two additional checks are to be performed, as will be explained below.
最好把异常划分为两个组:可能引起宽度缺陷的元件上的异常,以及不在元件上但可能引起间隔缺陷的异常。It is best to divide anomalies into two groups: anomalies on components that may cause width defects, and anomalies that are not on components but may cause spacer defects.
元件上的异常相当容易选择。实际上,ECC上每一轮廓对应于一系列连续的点。与CCC轮廓重叠的ECC轮廓这时一分为二。由此,如果ECC的轮廓的任何点在元件上,则认为轮廓的所有的点也在这一元件上。如果只要有ECC轮廓的一个点不在元件上,则不认为该轮廓在元件上。因而只检验ECC上每一轮廓的一个点即允许区分在两个组中的异常,这里称为ECCspacing和ECCwidth。方法300在两个组上被独立使用。Exceptions on components are fairly easy to select. In fact, each contour on the ECC corresponds to a series of consecutive points. The ECC profile overlapping the CCC profile is now split in two. Thus, if any point of the contour of the ECC is on a component, all points of the contour are considered to be on this component as well. If at least one point with an ECC profile is not on the component, the profile is not considered to be on the component. Examining only one point per contour on the ECC thus allows distinguishing anomalies in two groups, here called ECCs pacing and ECC width .
由于方法300在两个组每一个上的应用之间的差别很相似,并为了简介的目的,将只是参照整个ECC说明方法300。Since the differences between the application of the
第一步骤302是要提取列在ECCwidth中下一个没有检查的异常。显然,第一次执行步骤302,下一个异常是第一个列出的异常。现在这一异常将称为当前异常(CA)。The
步骤304是找到ECC中的所有异常,该ECC具有重叠CA的AAR的其对应的AAR。Step 304 is to find all anomalies in the ECC that have their corresponding AARs that overlap the CA's AAR.
在步骤306,这些异常在ECC列表中被标记为被检查,并被放置在当前异常列表(CAL)中。按以上所讨论的那样ARR被重新评估(步骤306),并重复步骤304和306直到没有未检查的异常使其ARR重叠新的ARR为止。At
在步骤308,被封闭在AAR中的CCC中所有的轮廓被列在新的NSL中。At
在步骤310,检验NSL中所有的线段被标记为已分析。如果它们不是这样,则在NSL中下一个未被分析的线段成为当前线段(CS),CS在NSL中被标记为被分析(步骤311),且处理过程继续进行到步骤316。At
如果这时NSL中所的线段被标记为被分析,在步骤312,对ECC中所有的异常已经被标记为被检查的情形进行检验。如果不是,对下一个异常重复步骤302。如果是,则异常的检查结束并停止整个处理过程(步骤314)。If the line segment in the NSL is marked as being analyzed at this time, at
步骤316在于使用上述准则验证NSL的下一个未分析线段是否相对于CS。如果是这种情形,则处理过程继续进行步骤320。如果不是这种情形,且已达到NSL的末端(318),则重复步骤310。否则,重复步骤316。Step 316 consists in verifying whether the next unanalyzed segment of NSL is relative to CS using the above criteria. If this is the case, processing continues at step 320 . If this is not the case, and the end of the NSL has been reached (318),
在步骤320,考虑到CS与相对于CS的线段,如上所述计算dsegmax。At step 320, dsegmax is calculated as described above, taking into account CS and the line segment relative to CS.
在步骤322,进行检验看CAL是否包含另一个未检查的异常。如果是这种情形,CAL中下一个未检查异常设置为CA(步骤324),且处理过程继续进行步骤326。否则该方法前进到步骤330。In step 322, a check is made to see if the CAL contains another unchecked exception. If this is the case, the next unchecked exception in CAL is set to CA (step 324 ), and processing continues at step 326 . Otherwise the method proceeds to step 330 .
在步骤326,如果CA的ARR没有重叠CS和与其相对的线段两者的有效半平面,则重复步骤322。如果重叠,则方法前进到步骤328。At step 326, if the ARR of CA does not overlap the effective half-plane of both CS and the line segment opposite it, then step 322 is repeated. If so, the method proceeds to step 328 .
在步骤328,对于CA的每一点计算到CS(MD1)与到相对线段(MD2)的最小距离,以及最大和最小间隔(MAS和MIS)。In step 328, the minimum distance to CS (MD1) and to the opposite line segment (MD2), and the maximum and minimum separations (MAS and MIS) are calculated for each point of CA.
在所有被检测的异常之中,确定在两个线段的内部空间中的那些异常(步骤330)。测试如下:如果Among all detected anomalies, those in the inner space of the two line segments are determined (step 330). The test is as follows: if
MD1+MD2>DESGMAX*%RESMD1+MD2>DESGMAX * %RES
则不认为异常在两个线段内部空间中。从CAL中除去不在内部空间中的异常(步骤332)。Then the exception is not considered to be in the space between two line segments. Exceptions not in internal space are removed from the CAL (step 332).
如果CAL是空的,则处理过程返回步骤310(步骤334)。If the CAL is empty, then processing returns to step 310 (step 334).
在步骤336中,由每一异常占据的区域被保存在所有被占据区域(AOR)的列表中,该列表最好是区间的形式。AOR列表包括对每一异常的MAS和MIS。如果两个区域重叠,则它们的区间相加。In
在步骤338,如上所述计算规范化的间隔。实际上,要计算CS及与其相对的线段之间的有效间隔。这等于两个线段之间的间隔减去AOR中的区间之和。规范化的间隔等于有效间隔对两个线段之间的实际间隔的比率。In
如果规范化的间隔劣于值%RES,则在步骤340检测到缺陷。If the normalized interval is worse than the value %RES, a defect is detected at
在步骤342,对检测到的缺陷被表征并保存到缺陷列表中。更具体地,保存异常和两个线段(CS和相对于CS的线段)。然后处理过程返回步骤310。At
狭窄空间区域的检查Inspection of confined space areas
由于以下两个原因,最好对来自狭窄区域的多边形Tk+1进行检查:It is better to check Tk+1 on polygons from narrow regions for two reasons:
·多层模型上它们的尺度可能太小;以及· their scale may be too small on multi-layer models; and
·即使模型上两个元件之间的内部空间正确,图像上对应的区域可能不正确。· Even if the internal space between two components is correct on the model, the corresponding area on the image may not be correct.
一般来说,多边形Tk+1列表中两个相对的线段产生具有一宽度的内部空间。如果对应的宽度不在预定的阈值之内,则这些内部空间的某些对应于缺陷。In general, two opposing line segments in the polygon T k+1 list create an interior space with a width. Some of these interior spaces correspond to defects if the corresponding widths are not within a predetermined threshold.
更具体来说,多层模型上太小的尺度可能指示着重要的层间校准间隙。这通过以预定的准则测试内部空间进行检测。例如,两种不同材料之间的间隔可能被检验,以保证其不劣于例如由PCB制造者所设置的最小间隔值。如果小于,则在两层之间检测出校准的问题。More specifically, too small scales on multilayer models may indicate important interlayer calibration gaps. This is detected by testing the interior space against predetermined criteria. For example, the spacing between two different materials may be checked to ensure that it is not inferior to a minimum spacing value set eg by the PCB manufacturer. If less than , a calibration problem has been detected between the two layers.
有可能,根据方法300的异常的检测可能无法检测到PCB两个元件之间错误的间隔。It is possible that detection of anomalies according to
实际上,如以上所讨论,异常的检测是在模型中的轮廓与在PCB图像中检测出的轮廓之间预定的容差内进行的。然而,内部空间中允许的缺陷的最小尺度与内部空间的尺度有关。例如,如果关于轮廓位置的容差是模型上宽度的25%,且区域的最小宽度是模型宽度的50%,则按算法300将不能检测到异常。In practice, as discussed above, the detection of anomalies is performed within a predetermined tolerance between the contours in the model and the contours detected in the PCB image. However, the minimum size of defects allowed in the interior space is related to the dimensions of the interior space. For example, if the tolerance on contour position is 25% of the width on the model, and the minimum width of the region is 50% of the model width, then
现在转到图14,第一异常90能够引起轮廓91在公差容限内偏差并达标称宽度92的25%,且在相对的轮廓93附近的第二异常94也是如此。按方法300两个异常都不能检测到,因为它们都在公差容限92和96之内。然而,这两个异常的组合使内部空间变得狭窄到其标称宽度的50%。然而,这就对应着一个缺陷。Turning now to FIG. 14 , a first anomaly 90 can cause the profile 91 to deviate within tolerances and up to 25% of the nominal width 92 , as can a second anomaly 94 near the opposite profile 93 . Neither anomaly can be detected by
如图15所示,以下的准则是根据本发明的方法设置的,以便检测狭窄空间(内部空间)区域的缺陷。As shown in FIG. 15, the following criteria are set according to the method of the present invention in order to detect defects in narrow space (inner space) regions.
在步骤400,如果计算的内部空间的宽度劣于例如由制造者规定的阈值,则检测到层的校准错误。In step 400 , a calibration error of the layer is detected if the calculated width of the inner space is worse than a threshold, eg specified by the manufacturer.
如果不是,且宽度劣于轮廓位置上的四倍公差容限(步骤402),则可能出现缺陷,并测量PCB图像上的内部空间宽度。If not, and the width is worse than four times the tolerance tolerance on the outline location (step 402), a defect may be present, and the interior space width is measured on the PCB image.
如果测量的宽度劣于模型上的宽度的50%(步骤404),则元件之间的区域(内部空间)不正确并检测到缺陷。If the measured width is worse than 50% of the width on the model (step 404), the area between elements (inner space) is incorrect and a defect is detected.
如图16和17所示,最好通过使多边形100逐步变窄(参见箭头101)直到多边形的线段交叉(参见图17中102),进行矢量模型上内部空间98的测量。这一过程称为侵蚀。As shown in Figures 16 and 17, the measurement of the interior space 98 on the vector model is preferably performed by gradually narrowing the polygon 100 (see arrow 101) until the polygon's line segments intersect (see 102 in Figure 17). This process is called erosion.
侵蚀率是内部空间98宽度的指示。例如,直到出现交叉102之前侵蚀率最好设置得高。然后,降低该比率来膨胀该多边形100。然后再降低该比率重新开始侵蚀直到另一交叉出现。重复该处理过程直到侵蚀率等于或劣于所需的分辨率。该比率是以像素的分数表示的,因为如上所讨论,分辨率最好按子像素的数量级。The erosion rate is indicative of the width of the interior space 98 . For example, the erosion rate is preferably set high until the
图像上内部空间的测量最好通过划分出内部空间的轮廓的抽取进行。应当注意到,这些轮廓不一定对应于相同的元件或不一定产生封闭的轮廓。然后轮廓被封闭以形成多边形的顶点。以上对于矢量模型中多边形的侵蚀所讨论的方法被用来测量轮廓的宽度。The measurement of the interior space on the image is preferably carried out by extracting the contours delimiting the interior space. It should be noted that these profiles do not necessarily correspond to identical elements or result in closed profiles. The outline is then closed to form the vertices of the polygon. The method discussed above for erosion of polygons in vector models is used to measure the width of the outline.
在不背离本发明的精神之下,其它方法也可以用来测量矢量模型和图像这两者上的内部空间。Other methods can also be used to measure interior space on both vector models and images without departing from the spirit of the invention.
当然,也可以设置其它的阈值或准则来检测狭区域的中的缺陷。Of course, other thresholds or criteria can also be set to detect defects in narrow areas.
重叠区域的检查Checking for overlapping areas
由于前节所述相同的两个原因,对通过方程式(11)获得的重叠区域进行检查。The overlapping area obtained by equation (11) is checked for the same two reasons as described in the previous section.
然而在重叠区域的情形下,可能出现另一问题:一层的一个或多个轮廓可能被重叠层隐藏在PCB图像上面。这种情形下,存在两种可能性。In the case of overlapping areas, however, another problem may arise: one or more outlines of a layer may be hidden on top of the PCB image by the overlapping layer. In this case, there are two possibilities.
线段的一部分是可见的,允许进行上层的轮廓的外插。否则,只能检测到可见的轮廓。A portion of the line segment is visible, allowing extrapolation of the overlying contour. Otherwise, only visible contours are detected.
由于重叠区域中缺陷的检测一般基于图15中所述相同的准则,故这里不再详述。Since the detection of defects in overlapping regions is generally based on the same criteria as described in Figure 15, it will not be described in detail here.
由狭窄区域或重叠区域引起的缺陷最好被表征并保存在文件中,供进一步分析。该文件可以是与用来存储和表征其它检测到的缺陷的相同的文件。Defects caused by narrow or overlapping regions are best characterized and kept on file for further analysis. This file may be the same file used to store and characterize other detected defects.
虽然以上就本发明优选实施例对本发明进行了说明,但在不背离所附权利要求中定义的主题发明的精神和本质之下,它可以被修改。While the invention has been described above in terms of its preferred embodiments, it can be modified without departing from the spirit and nature of the subject invention as defined in the appended claims.
Claims (35)
Applications Claiming Priority (2)
| Application Number | Priority Date | Filing Date | Title |
|---|---|---|---|
| CA002296143A CA2296143A1 (en) | 2000-01-18 | 2000-01-18 | Optical inspection system |
| CA2,296,143 | 2000-01-18 |
Publications (2)
| Publication Number | Publication Date |
|---|---|
| CN1401107A CN1401107A (en) | 2003-03-05 |
| CN1261908C true CN1261908C (en) | 2006-06-28 |
Family
ID=4165090
Family Applications (1)
| Application Number | Title | Priority Date | Filing Date |
|---|---|---|---|
| CNB018038670A Expired - Fee Related CN1261908C (en) | 2000-01-18 | 2001-01-17 | Method and system for detecting defects in printed circuit boards |
Country Status (12)
| Country | Link |
|---|---|
| US (1) | US6771807B2 (en) |
| EP (1) | EP1254431B1 (en) |
| JP (1) | JP2003520969A (en) |
| KR (1) | KR100744212B1 (en) |
| CN (1) | CN1261908C (en) |
| AT (1) | ATE247309T1 (en) |
| AU (1) | AU2001228211A1 (en) |
| CA (1) | CA2296143A1 (en) |
| DE (1) | DE60100594T2 (en) |
| IL (2) | IL150744A0 (en) |
| TW (1) | TWI240223B (en) |
| WO (1) | WO2001054068A2 (en) |
Families Citing this family (96)
| Publication number | Priority date | Publication date | Assignee | Title |
|---|---|---|---|---|
| US6115491A (en) | 1996-02-27 | 2000-09-05 | Cyberoptics Corporation | Apparatus and method for estimating background tilt and offset |
| DE10194788T1 (en) | 2000-01-07 | 2003-02-27 | Cyberoptics Corp | Phase profilometry system with telecentric projector |
| US6549647B1 (en) | 2000-01-07 | 2003-04-15 | Cyberoptics Corporation | Inspection system with vibration resistant video capture |
| US6593705B1 (en) | 2000-01-07 | 2003-07-15 | Cyberoptics Corporation | Rapid-firing flashlamp discharge circuit |
| US6980685B2 (en) * | 2001-01-22 | 2005-12-27 | Siemens Corporate Research, Inc. | Model-based localization and measurement of miniature surface mount components |
| US6920624B2 (en) * | 2002-01-17 | 2005-07-19 | Seagate Technology, Llc | Methodology of creating an object database from a Gerber file |
| IL148829A0 (en) * | 2002-03-21 | 2002-09-12 | Camtek Ltd | A method for storing information on layers of a layered product |
| JP3589424B1 (en) * | 2003-12-22 | 2004-11-17 | 株式会社メガトレード | Board inspection equipment |
| JP2005351631A (en) * | 2004-06-08 | 2005-12-22 | Dainippon Screen Mfg Co Ltd | Defect detection device and method |
| JP2006235762A (en) * | 2005-02-22 | 2006-09-07 | Orion Denki Kk | Cad system for printed circuit board |
| KR100687870B1 (en) * | 2005-04-04 | 2007-02-27 | 주식회사 하이닉스반도체 | Wafer inspection method |
| US7653235B2 (en) * | 2005-10-27 | 2010-01-26 | Honeywell International Inc. | Surface anomaly detection system and method |
| US7551272B2 (en) * | 2005-11-09 | 2009-06-23 | Aceris 3D Inspection Inc. | Method and an apparatus for simultaneous 2D and 3D optical inspection and acquisition of optical inspection data of an object |
| EP1997074B1 (en) * | 2006-03-13 | 2013-02-06 | Given Imaging Ltd. | Device, system and method for automatic detection of contractile activity in an image frame |
| ATE487995T1 (en) * | 2006-03-13 | 2010-11-15 | Given Imaging Ltd | CASCADE ANALYSIS FOR INTESTINAL CONTRACTION DETECTION |
| US7684609B1 (en) * | 2006-05-25 | 2010-03-23 | Kla-Tencor Technologies Corporation | Defect review using image segmentation |
| JP5010207B2 (en) * | 2006-08-14 | 2012-08-29 | 株式会社日立ハイテクノロジーズ | Pattern inspection apparatus and semiconductor inspection system |
| US20080117438A1 (en) * | 2006-11-16 | 2008-05-22 | Solvision Inc. | System and method for object inspection using relief determination |
| CN101201371B (en) * | 2006-12-15 | 2011-12-21 | 鸿富锦精密工业(深圳)有限公司 | Method and device for detecting printed circuit |
| US7535560B2 (en) * | 2007-02-26 | 2009-05-19 | Aceris 3D Inspection Inc. | Method and system for the inspection of integrated circuit devices having leads |
| US7664614B2 (en) * | 2007-11-02 | 2010-02-16 | United Microelectronics Corp. | Method of inspecting photomask defect |
| US8059280B2 (en) | 2008-01-31 | 2011-11-15 | Cyberoptics Corporation | Method for three-dimensional imaging using multi-phase structured light |
| US8131107B2 (en) * | 2008-05-12 | 2012-03-06 | General Electric Company | Method and system for identifying defects in NDT image data |
| US8269836B2 (en) * | 2008-07-24 | 2012-09-18 | Seiko Epson Corporation | Image capture, alignment, and registration |
| US20100046816A1 (en) * | 2008-08-19 | 2010-02-25 | Igual-Munoz Laura | Method for automatic classification of in vivo images |
| US8121415B2 (en) | 2008-10-28 | 2012-02-21 | Quality Vision International, Inc. | Combining feature boundaries |
| TWI427556B (en) * | 2008-12-30 | 2014-02-21 | Hon Hai Prec Ind Co Ltd | System and method for comparing images |
| US8260030B2 (en) * | 2009-03-30 | 2012-09-04 | Koh Young Technology Inc. | Inspection method |
| US8378702B2 (en) | 2009-05-08 | 2013-02-19 | Corning Incorporated | Non-contact testing of printed electronics |
| JP5407632B2 (en) * | 2009-07-22 | 2014-02-05 | 富士通株式会社 | Printed circuit board test support apparatus, printed circuit board test support method, and printed circuit board test support program |
| US8339449B2 (en) * | 2009-08-07 | 2012-12-25 | Globalfoundries Singapore Pte. Ltd. | Defect monitoring in semiconductor device fabrication |
| JP5678737B2 (en) * | 2011-03-10 | 2015-03-04 | セイコーエプソン株式会社 | Defect detection method and defect detection apparatus |
| US8942465B2 (en) * | 2011-12-13 | 2015-01-27 | General Electric Company | Methods and systems for processing images for inspection of an object |
| CN103185560A (en) * | 2011-12-29 | 2013-07-03 | 鸿富锦精密工业(深圳)有限公司 | System and method for detecting circuit width of printed circuit board (PCB) |
| US9881354B2 (en) * | 2012-03-15 | 2018-01-30 | Microsoft Technology Licensing, Llc | Image completion including automatic cropping |
| CN102721695B (en) * | 2012-05-18 | 2015-01-07 | 深圳大学 | Method for detecting printed circuit board defect |
| CN102914549B (en) * | 2012-09-10 | 2015-03-25 | 中国航天科技集团公司第五研究院第五一三研究所 | Optical image matching detection method aiming at satellite-borne surface exposed printed circuit board (PCB) soldering joint quality |
| WO2014063301A1 (en) * | 2012-10-23 | 2014-05-01 | Luo Yi | Test method and device for pcb of smt |
| CN102937595B (en) * | 2012-11-13 | 2015-05-20 | 浙江省电力公司电力科学研究院 | Method, device and system for detecting printed circuit board (PCB) |
| CN103063677A (en) * | 2012-12-24 | 2013-04-24 | 上海金东唐精机科技有限公司 | Multifunctional printed circuit board (PCB) test system |
| US9361682B2 (en) * | 2013-03-15 | 2016-06-07 | John S. Youngquist | Virtual assembly and product inspection control processes |
| US10126252B2 (en) | 2013-04-29 | 2018-11-13 | Cyberoptics Corporation | Enhanced illumination control for three-dimensional imaging |
| KR102154075B1 (en) * | 2013-10-21 | 2020-09-09 | 삼성전자주식회사 | Methods of inspecting a semiconductor device and semiconductor inspection systems |
| CN104636525B (en) * | 2013-11-14 | 2017-12-19 | 英业达科技有限公司 | Printed circuit inspection method and device |
| CN103728316B (en) * | 2014-01-13 | 2016-04-06 | 深圳市永光神目科技有限公司 | The pick-up unit of PCBA board |
| CN103728305A (en) * | 2014-01-13 | 2014-04-16 | 深圳市永光神目科技有限公司 | Detection method for PCBA (printed circuit board assembly) |
| CN103885216A (en) * | 2014-02-10 | 2014-06-25 | 北京京东方显示技术有限公司 | A substrate detection device and method |
| CN104156958B (en) * | 2014-08-06 | 2017-07-11 | 中国科学院生物物理研究所 | A kind of circuit board wiring edge extracting method and extraction platform |
| CN105466951B (en) * | 2014-09-12 | 2018-11-16 | 江苏明富自动化科技股份有限公司 | A kind of automatic optical detection device and its detection method |
| WO2016086486A1 (en) | 2014-12-05 | 2016-06-09 | 深圳市凯意科技有限公司 | Image generation method and apparatus for electronic circuit board x-ray inspection |
| EP3261933B1 (en) * | 2015-02-27 | 2020-09-23 | Pulsar S.r.l. | A plant for processing products including a unit for detecting defective products |
| CN104820979A (en) * | 2015-03-20 | 2015-08-05 | 深圳市纳研科技有限公司 | Image thinning and characteristic classification method used for product defect detection and quality control |
| US10571413B2 (en) * | 2015-04-15 | 2020-02-25 | Yxlon International Gmbh | Method for checking an electronic component |
| CN105069772B (en) * | 2015-06-11 | 2018-01-26 | 国家电网公司 | A kind of electric power Identify chip method |
| US9727785B2 (en) * | 2015-06-18 | 2017-08-08 | The Boeing Company | Method and apparatus for tracking targets |
| US9715639B2 (en) | 2015-06-18 | 2017-07-25 | The Boeing Company | Method and apparatus for detecting targets |
| CN106937080A (en) * | 2015-12-30 | 2017-07-07 | 希姆通信息技术(上海)有限公司 | Visible detection method and control device that a kind of mobile terminal is tightened up a screw |
| CN106127779B (en) * | 2016-06-29 | 2018-12-11 | 上海晨兴希姆通电子科技有限公司 | The defect inspection method and system of view-based access control model identification |
| CN106327496B (en) * | 2016-08-26 | 2019-04-23 | 西安电子科技大学 | Detection system and method for blind hole defect of PCB bare board based on AOI |
| CN106526448A (en) * | 2016-09-30 | 2017-03-22 | 厦门通士达照明有限公司 | Automatic detecting system and detection method for power supply drive board |
| US11275361B2 (en) * | 2017-06-30 | 2022-03-15 | Kla-Tencor Corporation | Systems and methods for predicting defects and critical dimension using deep learning in the semiconductor manufacturing process |
| TWI640932B (en) * | 2017-08-08 | 2018-11-11 | 富比庫股份有限公司 | Electronic part pattern verification system and method thereof |
| CN110197797B (en) * | 2018-02-27 | 2021-07-02 | 上海微电子装备(集团)股份有限公司 | A standard sheet for defect detection |
| CN109033917A (en) * | 2018-06-04 | 2018-12-18 | 广州美维电子有限公司 | A kind of information tracing method of pcb board and pcb board |
| CN109389597B (en) * | 2018-10-24 | 2021-04-27 | 四川长虹电器股份有限公司 | Circuit board defect detection system and method on production line |
| CN110285760A (en) * | 2019-06-27 | 2019-09-27 | 重庆矢崎仪表有限公司 | A kind of FPC assembling detection system and method |
| CN110555858A (en) * | 2019-08-16 | 2019-12-10 | 珠海格力电器股份有限公司 | A method and device for detecting the position of hot melt adhesive on an electric control board |
| CN110751624B (en) * | 2019-09-10 | 2022-08-09 | 华中科技大学 | Method and system for improving PCB inspection precision |
| CN112579810B (en) * | 2019-09-30 | 2023-10-27 | 深圳市嘉立创科技发展有限公司 | Printed circuit board classification method, device, computer equipment and storage medium |
| TWI721718B (en) | 2019-12-19 | 2021-03-11 | 新加坡商鴻運科股份有限公司 | Printed circuit board smart detection method, device, system, and storage thereof |
| CN111570327B (en) * | 2020-04-09 | 2022-05-31 | 广州视源电子科技股份有限公司 | Method, device and equipment for classifying printed circuit boards of LED display screen |
| CN113554582B (en) * | 2020-04-22 | 2022-11-08 | 中国科学院长春光学精密机械与物理研究所 | Defect detection method, device and system for functional hole in electronic equipment cover plate |
| US11803960B2 (en) * | 2020-08-12 | 2023-10-31 | Kla Corporation | Optical image contrast metric for optical target search |
| CN113222913B (en) * | 2021-04-28 | 2024-04-12 | 南京南瑞继保电气有限公司 | Circuit board defect detection positioning method, device and storage medium |
| CN113610761B (en) * | 2021-07-06 | 2023-11-17 | 上海望友信息科技有限公司 | Method, device, electronic equipment and storage medium for judging broken wires |
| CN113744247A (en) * | 2021-09-03 | 2021-12-03 | 西安建筑科技大学 | PCB welding spot defect identification method and system |
| TWI807426B (en) * | 2021-09-17 | 2023-07-01 | 鴻海精密工業股份有限公司 | Literal image defect detection method, computer device, and storage medium |
| TWI786838B (en) * | 2021-09-17 | 2022-12-11 | 鴻海精密工業股份有限公司 | Printing defect detection method, computer device, and storage medium |
| CN115829904B (en) * | 2021-09-17 | 2025-10-10 | 鸿海精密工业股份有限公司 | Printing defect detection method, computer device and storage medium |
| WO2023055375A1 (en) * | 2021-09-30 | 2023-04-06 | Hewlett-Packard Development Company, L.P. | Image comparison to determine device abnormalities |
| CN113870257B (en) * | 2021-12-01 | 2022-03-18 | 武汉飞恩微电子有限公司 | Printed circuit board defect detection and classification method, device and computer storage medium |
| CN114384204B (en) * | 2021-12-07 | 2024-03-22 | 广州兴森快捷电路科技有限公司 | PCB jointed board detection device, system, method and storage medium |
| CN116242830B (en) * | 2021-12-08 | 2026-02-03 | 先进半导体材料(深圳)有限公司 | Flaw detection method of lead frame |
| CN114663420B (en) * | 2022-04-07 | 2025-04-04 | 聚时科技(上海)有限公司 | An image-based method for detecting abnormal spacing defects |
| CN114627113B (en) * | 2022-05-12 | 2022-07-29 | 成都数之联科技股份有限公司 | A printed circuit board defect detection method, system, device and medium |
| CN116106724A (en) * | 2023-02-15 | 2023-05-12 | 合肥联宝信息技术有限公司 | Method, device, electronic equipment and storage medium for testing circuit board |
| CN116563357B (en) * | 2023-07-10 | 2023-11-03 | 深圳思谋信息科技有限公司 | Image matching method, device, computer equipment and computer readable storage medium |
| CN116912250B (en) * | 2023-09-13 | 2023-11-28 | 山东众成菌业股份有限公司 | Fungus bag production quality detection method based on machine vision |
| CN117451728B (en) * | 2023-12-26 | 2024-02-20 | 常州漫舒医疗科技有限公司 | Ostomy product production inspection system based on visual inspection |
| CN118657177B (en) * | 2024-08-13 | 2024-10-25 | 昆明理工大学 | Circuit board defect identification transducer network distributed reasoning method based on IEC61499 standard |
| CN118837725B (en) * | 2024-09-19 | 2025-01-24 | 苏州元脑智能科技有限公司 | Insertion loss test method and device |
| CN119338776B (en) * | 2024-10-11 | 2025-07-22 | 浙江中数激光装备有限公司 | Rail train wheel surface scratch detection method and system |
| CN119881110B (en) * | 2025-03-27 | 2025-06-03 | 东莞朗诚微电子设备有限公司 | Ultrasonic detection method, system and device for integrated circuit plastic package |
| CN120431040B (en) * | 2025-04-23 | 2026-01-27 | 深圳市辉煌星电子有限公司 | PCB processing deviation correcting method and system based on visual calibration |
| CN120282438B (en) * | 2025-06-05 | 2025-08-22 | 信熙缘(江苏)智能科技有限公司 | Detection method for mounting missing material on flexible circuit board strips |
| CN121120610B (en) * | 2025-10-16 | 2026-04-21 | 天津市信卓越科技有限公司 | Communication chip layout defect automatic identification method based on artificial intelligence |
Family Cites Families (26)
| Publication number | Priority date | Publication date | Assignee | Title |
|---|---|---|---|---|
| DE3267548D1 (en) | 1982-05-28 | 1986-01-02 | Ibm Deutschland | Process and device for an automatic optical inspection |
| US4589140A (en) | 1983-03-21 | 1986-05-13 | Beltronics, Inc. | Method of and apparatus for real-time high-speed inspection of objects for identifying or recognizing known and unknown portions thereof, including defects and the like |
| DE3475106D1 (en) | 1983-04-15 | 1988-12-15 | Hitachi Ltd | Method and apparatus for detecting defects of printed circuit patterns |
| US4578810A (en) | 1983-08-08 | 1986-03-25 | Itek Corporation | System for printed circuit board defect detection |
| JPS60263807A (en) | 1984-06-12 | 1985-12-27 | Dainippon Screen Mfg Co Ltd | Instument for inspecting pattern defect of printed wiring board |
| US4648053A (en) * | 1984-10-30 | 1987-03-03 | Kollmorgen Technologies, Corp. | High speed optical inspection system |
| US5774572A (en) | 1984-12-20 | 1998-06-30 | Orbotech Ltd. | Automatic visual inspection system |
| EP0186874B1 (en) | 1984-12-26 | 1994-06-08 | Hitachi, Ltd. | Method of and apparatus for checking geometry of multi-layer patterns for IC structures |
| EP0195161B1 (en) * | 1985-03-14 | 1993-09-15 | Nikon Corporation | Apparatus for automatically inspecting objects and identifying or recognizing known and unknown portions thereof, including defects and the like and method |
| US4776022A (en) | 1985-04-09 | 1988-10-04 | Aoi Systems, Inc. | System for printed circuit board defect detection |
| EP0236738A3 (en) | 1986-02-05 | 1988-12-21 | OMRON Corporation | Input method for reference printed circuit board assembly data to an image processing printed circuit board assembly automatic inspection apparatus |
| US4974261A (en) | 1988-11-15 | 1990-11-27 | Matsushita Electric Works, Ltd. | Optical surface inspection method |
| US5272763A (en) * | 1990-03-02 | 1993-12-21 | Matsushita Electric Industrial Co., Ltd. | Apparatus for inspecting wiring pattern formed on a board |
| US5054094A (en) * | 1990-05-07 | 1991-10-01 | Eastman Kodak Company | Rotationally impervious feature extraction for optical character recognition |
| US5115475A (en) | 1990-06-04 | 1992-05-19 | Motorola, Inc. | Automatic semiconductor package inspection method |
| US5086477A (en) | 1990-08-07 | 1992-02-04 | Northwest Technology Corp. | Automated system for extracting design and layout information from an integrated circuit |
| US5586058A (en) | 1990-12-04 | 1996-12-17 | Orbot Instruments Ltd. | Apparatus and method for inspection of a patterned object by comparison thereof to a reference |
| US5119434A (en) | 1990-12-31 | 1992-06-02 | Beltronics, Inc. | Method of and apparatus for geometric pattern inspection employing intelligent imaged-pattern shrinking, expanding and processing to identify predetermined features and tolerances |
| JPH05223532A (en) * | 1991-07-10 | 1993-08-31 | Raytheon Co | Automatic visual inspection system |
| DE69331433T2 (en) | 1992-10-22 | 2002-10-02 | Advanced Interconnection Technology, Inc. | Device for the automatic optical inspection of printed circuit boards with wires laid therein |
| US5365596A (en) | 1992-12-17 | 1994-11-15 | Philip Morris Incorporated | Methods and apparatus for automatic image inspection of continuously moving objects |
| US5452368A (en) | 1993-08-02 | 1995-09-19 | Motorola, Inc. | Method of detecting defects in semiconductor package leads |
| US5517234A (en) | 1993-10-26 | 1996-05-14 | Gerber Systems Corporation | Automatic optical inspection system having a weighted transition database |
| US5506793A (en) * | 1994-01-14 | 1996-04-09 | Gerber Systems Corporation | Method and apparatus for distortion compensation in an automatic optical inspection system |
| US5751910A (en) * | 1995-05-22 | 1998-05-12 | Eastman Kodak Company | Neural network solder paste inspection system |
| US5848189A (en) | 1996-03-25 | 1998-12-08 | Focus Automation Systems Inc. | Method, apparatus and system for verification of patterns |
-
2000
- 2000-01-18 CA CA002296143A patent/CA2296143A1/en not_active Abandoned
-
2001
- 2001-01-17 AT AT01942769T patent/ATE247309T1/en not_active IP Right Cessation
- 2001-01-17 WO PCT/CA2001/000042 patent/WO2001054068A2/en not_active Ceased
- 2001-01-17 KR KR1020027009214A patent/KR100744212B1/en not_active Expired - Fee Related
- 2001-01-17 EP EP01942769A patent/EP1254431B1/en not_active Expired - Lifetime
- 2001-01-17 IL IL15074401A patent/IL150744A0/en active IP Right Grant
- 2001-01-17 JP JP2001554290A patent/JP2003520969A/en active Pending
- 2001-01-17 DE DE60100594T patent/DE60100594T2/en not_active Expired - Fee Related
- 2001-01-17 CN CNB018038670A patent/CN1261908C/en not_active Expired - Fee Related
- 2001-01-17 AU AU2001228211A patent/AU2001228211A1/en not_active Abandoned
- 2001-01-18 US US09/764,745 patent/US6771807B2/en not_active Expired - Fee Related
- 2001-01-18 TW TW090101143A patent/TWI240223B/en not_active IP Right Cessation
-
2002
- 2002-07-15 IL IL150744A patent/IL150744A/en not_active IP Right Cessation
Also Published As
| Publication number | Publication date |
|---|---|
| US20010028732A1 (en) | 2001-10-11 |
| IL150744A0 (en) | 2003-02-12 |
| WO2001054068A2 (en) | 2001-07-26 |
| EP1254431A2 (en) | 2002-11-06 |
| ATE247309T1 (en) | 2003-08-15 |
| JP2003520969A (en) | 2003-07-08 |
| AU2001228211A1 (en) | 2001-07-31 |
| KR100744212B1 (en) | 2007-07-30 |
| WO2001054068A3 (en) | 2002-08-08 |
| IL150744A (en) | 2007-09-20 |
| CN1401107A (en) | 2003-03-05 |
| KR20020089325A (en) | 2002-11-29 |
| DE60100594T2 (en) | 2004-06-24 |
| EP1254431B1 (en) | 2003-08-13 |
| DE60100594D1 (en) | 2003-09-18 |
| TWI240223B (en) | 2005-09-21 |
| US6771807B2 (en) | 2004-08-03 |
| CA2296143A1 (en) | 2001-07-18 |
Similar Documents
| Publication | Publication Date | Title |
|---|---|---|
| CN1401107A (en) | Method and system for detecting defects on a printed circuit board | |
| CN1289901C (en) | Reduction of False Alarms in PCB Inspection | |
| CN1071893C (en) | Ophthalmic lens inspection method and apparatus | |
| CN1920539A (en) | Defect detecting method and defect detecting device | |
| CN1401075A (en) | Method for automatically detecting casting defects in a test piece | |
| CN1224089C (en) | Imperfection detecting method and device for semiconductor ICs | |
| CN1628324A (en) | Method and system for detecting defects | |
| CN1947153A (en) | Systems and methods for detecting defects in printed solder paste | |
| CN1862597A (en) | Method of registering and aligning multiple images | |
| CN101038670A (en) | Workpiece size measurement method and apparatus | |
| JP5325802B2 (en) | Observation method and observation apparatus | |
| CN1576782A (en) | Pattern inspection method and apparatus, and pattern alignment method | |
| CN1906480A (en) | X-ray inspection apparatus, and method for creating an image processing procedure of the X-ray inspection apparatus | |
| CN1746667A (en) | Substrate inspection method and apparatus | |
| CN1231868C (en) | Pattern evaluation method, pattern evaluation device computer reading record medium | |
| CN1940994A (en) | Defect detecting device, image sensor device, and image sensor module | |
| CN1656601A (en) | Semiconductor manufacturing method and device thereof | |
| CN1825100A (en) | Printed circuit board inspecting method and apparatus inspection logic setting method and apparatus | |
| CN1724999A (en) | Methods of and apparatus for inspecting substrate | |
| CN108700531A (en) | Flaw detection apparatus | |
| CN1757046A (en) | image processing device | |
| CN1841054A (en) | Defect Inspection Method | |
| CN1272626C (en) | Surface state examining method for curve and base plate examining apparatus | |
| CN1898698A (en) | Non-destructive monitoring procedure for nuclear reactor component | |
| CN1518664A (en) | Inspection System Using Dynamically Acquired Data and Related Techniques |
Legal Events
| Date | Code | Title | Description |
|---|---|---|---|
| C06 | Publication | ||
| PB01 | Publication | ||
| C10 | Entry into substantive examination | ||
| SE01 | Entry into force of request for substantive examination | ||
| C14 | Grant of patent or utility model | ||
| GR01 | Patent grant | ||
| C19 | Lapse of patent right due to non-payment of the annual fee | ||
| CF01 | Termination of patent right due to non-payment of annual fee |