EP0140599B1 - Méthode et appareil d'analyse utilisant des processus multiples de séparation - Google Patents
Méthode et appareil d'analyse utilisant des processus multiples de séparation Download PDFInfo
- Publication number
- EP0140599B1 EP0140599B1 EP84306781A EP84306781A EP0140599B1 EP 0140599 B1 EP0140599 B1 EP 0140599B1 EP 84306781 A EP84306781 A EP 84306781A EP 84306781 A EP84306781 A EP 84306781A EP 0140599 B1 EP0140599 B1 EP 0140599B1
- Authority
- EP
- European Patent Office
- Prior art keywords
- basic
- sets
- sample
- group
- components
- Prior art date
- Legal status (The legal status is an assumption and is not a legal conclusion. Google has not performed a legal analysis and makes no representation as to the accuracy of the status listed.)
- Expired
Links
- 238000000034 method Methods 0.000 title claims description 108
- 238000000926 separation method Methods 0.000 title claims description 47
- 238000004458 analytical method Methods 0.000 title claims description 17
- 238000009826 distribution Methods 0.000 claims description 32
- 238000002835 absorbance Methods 0.000 claims description 30
- 238000001514 detection method Methods 0.000 claims description 28
- 238000012545 processing Methods 0.000 claims description 5
- 150000001875 compounds Chemical class 0.000 claims description 4
- 230000005526 G1 to G0 transition Effects 0.000 claims description 3
- 230000005670 electromagnetic radiation Effects 0.000 claims description 3
- 230000001174 ascending effect Effects 0.000 claims 1
- 238000001228 spectrum Methods 0.000 description 121
- 239000011159 matrix material Substances 0.000 description 38
- 239000000203 mixture Substances 0.000 description 16
- 230000003595 spectral effect Effects 0.000 description 16
- 238000005259 measurement Methods 0.000 description 11
- 238000000556 factor analysis Methods 0.000 description 8
- 238000012360 testing method Methods 0.000 description 8
- 238000010521 absorption reaction Methods 0.000 description 6
- 238000004587 chromatography analysis Methods 0.000 description 6
- 150000002500 ions Chemical class 0.000 description 5
- 238000004949 mass spectrometry Methods 0.000 description 5
- 239000002904 solvent Substances 0.000 description 5
- 238000004811 liquid chromatography Methods 0.000 description 4
- 239000013626 chemical specie Substances 0.000 description 3
- 238000011208 chromatographic data Methods 0.000 description 3
- 239000002131 composite material Substances 0.000 description 3
- 230000000694 effects Effects 0.000 description 3
- 239000003480 eluent Substances 0.000 description 3
- 230000003287 optical effect Effects 0.000 description 3
- 238000000354 decomposition reaction Methods 0.000 description 2
- 238000010586 diagram Methods 0.000 description 2
- 238000010606 normalization Methods 0.000 description 2
- 230000005855 radiation Effects 0.000 description 2
- 238000005070 sampling Methods 0.000 description 2
- 239000000126 substance Substances 0.000 description 2
- 238000011481 absorbance measurement Methods 0.000 description 1
- 238000000862 absorption spectrum Methods 0.000 description 1
- 238000001042 affinity chromatography Methods 0.000 description 1
- 238000005119 centrifugation Methods 0.000 description 1
- 238000013375 chromatographic separation Methods 0.000 description 1
- 230000001427 coherent effect Effects 0.000 description 1
- 238000009792 diffusion process Methods 0.000 description 1
- 238000004821 distillation Methods 0.000 description 1
- 238000002848 electrochemical method Methods 0.000 description 1
- 238000001962 electrophoresis Methods 0.000 description 1
- 238000010828 elution Methods 0.000 description 1
- 238000001825 field-flow fractionation Methods 0.000 description 1
- 238000004817 gas chromatography Methods 0.000 description 1
- 230000005484 gravity Effects 0.000 description 1
- 238000004128 high performance liquid chromatography Methods 0.000 description 1
- 238000004255 ion exchange chromatography Methods 0.000 description 1
- 230000031700 light absorption Effects 0.000 description 1
- 239000000463 material Substances 0.000 description 1
- 238000012067 mathematical method Methods 0.000 description 1
- 238000005374 membrane filtration Methods 0.000 description 1
- 238000013508 migration Methods 0.000 description 1
- 230000005012 migration Effects 0.000 description 1
- 239000002808 molecular sieve Substances 0.000 description 1
- 238000004816 paper chromatography Methods 0.000 description 1
- 238000004313 potentiometry Methods 0.000 description 1
- 238000007781 pre-processing Methods 0.000 description 1
- 238000000513 principal component analysis Methods 0.000 description 1
- 238000004445 quantitative analysis Methods 0.000 description 1
- 230000000717 retained effect Effects 0.000 description 1
- URGAHOPLAPQHLN-UHFFFAOYSA-N sodium aluminosilicate Chemical compound [Na+].[Al+3].[O-][Si]([O-])=O.[O-][Si]([O-])=O URGAHOPLAPQHLN-UHFFFAOYSA-N 0.000 description 1
- 238000004611 spectroscopical analysis Methods 0.000 description 1
- 238000000859 sublimation Methods 0.000 description 1
- 230000008022 sublimation Effects 0.000 description 1
- 230000002123 temporal effect Effects 0.000 description 1
- 238000004809 thin layer chromatography Methods 0.000 description 1
- 230000001131 transforming effect Effects 0.000 description 1
- 239000013598 vector Substances 0.000 description 1
- 238000004832 voltammetry Methods 0.000 description 1
Images




Classifications
-
- G—PHYSICS
- G01—MEASURING; TESTING
- G01N—INVESTIGATING OR ANALYSING MATERIALS BY DETERMINING THEIR CHEMICAL OR PHYSICAL PROPERTIES
- G01N30/00—Investigating or analysing materials by separation into components using adsorption, absorption or similar phenomena or using ion-exchange, e.g. chromatography or field flow fractionation
- G01N30/02—Column chromatography
- G01N30/86—Signal analysis
- G01N30/8675—Evaluation, i.e. decoding of the signal into analytical information
-
- G—PHYSICS
- G01—MEASURING; TESTING
- G01N—INVESTIGATING OR ANALYSING MATERIALS BY DETERMINING THEIR CHEMICAL OR PHYSICAL PROPERTIES
- G01N21/00—Investigating or analysing materials by the use of optical means, i.e. using sub-millimetre waves, infrared, visible or ultraviolet light
- G01N21/17—Systems in which incident light is modified in accordance with the properties of the material investigated
- G01N21/25—Colour; Spectral properties, i.e. comparison of effect of material on the light at two or more different wavelengths or wavelength bands
- G01N21/31—Investigating relative effect of material at wavelengths characteristic of specific elements or molecules, e.g. atomic absorption spectrometry
-
- G—PHYSICS
- G01—MEASURING; TESTING
- G01N—INVESTIGATING OR ANALYSING MATERIALS BY DETERMINING THEIR CHEMICAL OR PHYSICAL PROPERTIES
- G01N30/00—Investigating or analysing materials by separation into components using adsorption, absorption or similar phenomena or using ion-exchange, e.g. chromatography or field flow fractionation
- G01N30/02—Column chromatography
- G01N30/04—Preparation or injection of sample to be analysed
- G01N30/06—Preparation
- G01N30/10—Preparation using a splitter
-
- G—PHYSICS
- G01—MEASURING; TESTING
- G01N—INVESTIGATING OR ANALYSING MATERIALS BY DETERMINING THEIR CHEMICAL OR PHYSICAL PROPERTIES
- G01N30/00—Investigating or analysing materials by separation into components using adsorption, absorption or similar phenomena or using ion-exchange, e.g. chromatography or field flow fractionation
- G01N30/02—Column chromatography
- G01N30/26—Conditioning of the fluid carrier; Flow patterns
- G01N30/38—Flow patterns
- G01N30/46—Flow patterns using more than one column
- G01N30/466—Flow patterns using more than one column with separation columns in parallel
-
- G—PHYSICS
- G01—MEASURING; TESTING
- G01N—INVESTIGATING OR ANALYSING MATERIALS BY DETERMINING THEIR CHEMICAL OR PHYSICAL PROPERTIES
- G01N30/00—Investigating or analysing materials by separation into components using adsorption, absorption or similar phenomena or using ion-exchange, e.g. chromatography or field flow fractionation
- G01N30/02—Column chromatography
- G01N30/86—Signal analysis
- G01N30/8675—Evaluation, i.e. decoding of the signal into analytical information
- G01N30/8682—Group type analysis, e.g. of components having structural properties in common
Definitions
- This invention provides a method and apparatus for analyzing an unknown sample to produce information concerning the properties of individual components of the sample. Such information may then be used to identify and quantify the components of the sample.
- a fundamental goal in analytical chemistry is the identification and quantitative analysis of the individual components in a sample. Identification generally cannot proceed, however, until the individual components have been to some extent physically separated from one another.
- One of the most widely used separation techniques is chromatography. In a typical chromatographic process, a sample is passed through a tube or column containing a stationary porous medium that has a different affinity for the various components in the sample, so that the components migrate through the column at different rates. Ideally, the components become completely separated prior to emerging or eluting from the column, and can then be identified as pure chemical species by an appropriate detector positioned at the outlet. Unfortunately, complete separation or resolution of the components is the exception rather than the rule.
- the process of identifying individual chemical components once they have been partially or completely separated is commonly termed detection.
- One common detection method for chromatography employs an optical spectrometer;(e.g., ultraviolet, visible or IR) positioned at the downstream end of the chromatographic column.
- the spectrometer measures the amount of radiation at a particular wavelength absorbed or emitted by the components as they elute from the column past the detector.
- TRAC Terends in Analytical Chemistry
- Vol. 1 (1982) pp 324-328 and US 3,676,649 each disclose chromatographic analysers with multiple chromatographic columns which are each provided with single channel detectors.
- a single-channel detector may not be capable of identifying the components, because absorption at a single wavelength is not a particularly unique identifier or signature of a chemical species. Knowledge of absorption or emission over a range of wavelengths often is a much better identifier, however, and multi-channel detectors have therefore been developed that simultaneously measure the absorption or emission of eluting samples at several different wavelengths. Ideally, the components become fully separated in the chromatographic column, and each one is then uniquely identified as it passes the multi-channel detector.
- Mass spectrometry Another type of multi-channel detector that has been widely used is the mass spectrometry, an unknown sample is converted into an ionized gas and the ions are then separated according to their mass/charge ratios and quantified by an integral ion sensitive detector.
- Mass spectrometry can be used as a multi-channel detection method for chromatography by periodically sampling the eluting components and analyzing the samples with a mass spectometer to produce measurements of ion current as a function of mass/charge. Ion current and mass/ charge are analogous to absorption and wavelength respetively, and mass spectrometry provides comparatively unique signatures of chemical species.
- One such curve resolution technique is based on principal component analysis or factor analysis.
- Factor analysis can be generally understood by imagining that two components have eluted from a chromatographic column at nearly the same time, and that the absorption of light by the overlapped, eluting components has been measured as a function of wavelength at 20 different time points during the interval when the components were passing a multi-channel UV-VIS spectrophotometic detector.
- One now has, in effect, 20 sequential graphs or signatures of absorption versus wavelength. Since the measured absorption is due to two components A and B, then it should be possible to produce all 20 absorbance graphs by adding together, in varying proportions, two underlying graphs corresponding to the signatures of pure A and pure B.
- methods based on factor analysis may be used to process the data represented by the 20 graphs and to find the graphs or signatures corresponding to components A and B, and thus resolving the single chromatographic peak into its separate components.
- US 4,353,242 discloses a method for analysing a sample in order to produce data corresponding to a set of properties of at least one of the individual components thereof, the properties being selected such that said set of properties is adequate for identifying at least one of said components, said method comprising the steps of:
- US 4,353,242 also describes an apparatus for analysing a sample in order to produce data corresponding to a set of properties of at least one of the individual components thereof, the properties being selected such that said set of properties is adequate for identifying at least one of said components, said apparatus comprising:
- separation means adapted to produce a distribution of the sample
- multi-channel detection means arranged to determine said set of properties of the sample at each of a plurality of positions along said distribution and to produce corresponding sample sets;
- processing means arranged to generate one or more basic sets, such that the sample sets can be represented by the common basic sets, whereby said common basic sets are estimates of said set of properties for individual compounds.
- Prior techniques based on factor analysis are effective only when the components are at least partially separated by chromatography or by other separation techniques. When components elute through a chromatographic column at the same or an immeasurably different rate, however, factor analysis is unable to resolve the composite detection data into individual component signatures. It is quite common, especially in the analysis of complex mixtures, to find that many components have nearly identical rates, and no methods have heretofore been available for the analysis of such complex samples in an efficient manner.
- the present invention provides a method and apparatus for analyzing a sample such that data corresponding to its individual components is produced.
- the power of the technique can be appreciated from the fact that it is capable in certain cases of resolving a given component even if that component is never separated, to any degree, from other components in the sample.
- the present invention provides a method as disclosed in US 4,353,242, characterised in that in step i), the sample is subjected to a plurality of separation processes, each of which is adapted to produce a corresponding plurality of different distributions of the sample, in step ii) a said sample set is produced by said multi-channel detection means at each of a plurality of positions along each said distribution, and in step iii) said one or more common basic sets are generated by analyzing all of the sample sets corresponding to all of said distributions.
- the invention provides apparatus as disclosed in US 4,353,242, characterised in that a plurality of said separation means are provided and are arranged to produce a corresponding plurality of different distributions of the sample;
- said multi-channel detection means arranged to produce said sample sets in respect of each of said distributions
- said processing means is arranged to generate said one or more basic sets by analyzing all of the sample sets corresponding to all of said distributions of the sample.
- FIGURE 1 is a block diagram of a chromatographic apparatus suitable for carrying out the present invention.
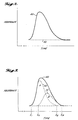
- FIGURE 2 shows a single absorbance peak such as that produced by a spectrophotometric detector in connection with a chromatographic separation process.
- FIGURE 3 shows a composite absorbance peak resolved into two components.
- FIGURE 4 schematically illustrates a data matrix consisting of a plurality of absorbance measurements.
- FIGURE 5 is a graph of the two-dimensional spectra measured for two partially overlapped components A and B of FIGURE 3.
- FIGURE 6 is a graph of absorbance versus time showing two overlapped components A and B and a third component C.
- FIGURE 7 is a graph, in eigenvector space, of point representing spectra collected for the distribution shown in FIGURE 6.
- FIGURE 8 is a graph showing the absorbance versus time of three partially overlapped components A, B and C.
- FIGURE 9 is a graph, in eigenvector space, of points representing the spectra measured over the distribution shown in FIGURE 8.
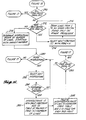
- FIGURE 10 consists of two graphs showing the absorbance versus time of three components A, B and C measured on two different separation processes.
- FIGURE 11 illustrates the data matrix formed from the absorbances measured for the two separation processes of FIGURE 10.
- FIGURE 12 is a graph, in eigenvector space, of the data represented by FIGURE 10.
- FIGURES 13-17 are flow charts detailing the steps for one preferred method of carrying out the present invention.
- the present invention involves the use of two or more separation processes in connection with multichannel detection means.
- separation process includes all techniques capable of producing at least a partial separation of the components of a mixed sample. The particular processes selected will depend upon the nature of the sample to be analyzed. Examples of separation processes that may be suitable for a given application include liquid chromatography, gas chromatography, paper chromatography, thin layer chromatography, ion exchange chromatography, electrophoresis, distillation, sublimation, molecular sieves, field flow fractionation, membrane filtration, centrifugation, thermal diffusion, mass spectrometry, and affinity chromatography.
- separation process also includes techniques based on altering the detection characteristics of the components over time, e.g., altering spectral properties by application of a magnetic field (Zeeman effect).
- the processes selected must produce different separations, i.e., distinguishable distributions of the components.
- the invention will be illustrated herein utilizing two liquid chromatography processes in which the columns exhibit different separating characteristics.
- the multichannel detection means that may be used to carry out the present invention include all techniques capable of determining a set (plurality) of properties of individual components in the sample, such that characteristic or identifying signatures of the components can be produced. Examples include multichannel electromagnetic radiation spectroscopy (e.g., UV, visible, IR), in which the absolute intensity or intensity difference of radiation is measured at a plurality of wavelengths, and mass spectrometry, in which ion current is measured at a plurality of mass/charge ratios. Other suitable multichannel detection means include electrochemical methods such as voltammetry and potentiometry, and magnetic resonance techniques such as NMR.
- multichannel electromagnetic radiation spectroscopy e.g., UV, visible, IR
- mass spectrometry in which ion current is measured at a plurality of mass/charge ratios.
- Other suitable multichannel detection means include electrochemical methods such as voltammetry and potentiometry, and magnetic resonance techniques such as NMR.
- the multichannel detection means can also comprise means for determining a set of unrelated properties, such as a single channel spectrometer in combination with other physiochemical measurements.
- a set of unrelated properties such as a single channel spectrometer in combination with other physiochemical measurements.
- the same multichannel detection method i.e., the same set of properties, must be determined for each separation process. Different measurements could be made for different processes, so long as appropriate means were available for converting the measurements into a single set of properties common to all processes.
- the invention will be illustrated using a multichannel ultraviolet spectrophotometer as the multichannel detection means.
- each separation process is used to produce a distribution of the components of the unknown mixture, and the multichannel detection means is then used to generate signatures of the mixture at a plurality of positions along each of the distributions.
- the multichannel detection means is then used to generate signatures of the mixture at a plurality of positions along each of the distributions.
- separation processes e.g., liquid chromatography
- this is most conveniently accomplished by arranging for the material eluting from the separation column to flow past a stationary detector, and by having the detector make measurements at a series of times.
- the following description will illustrate the present invention using multichannel detection measurements made at a plurality of discrete time points, it being understood that this is simply one method of sampling a chromatographic distribution.
- FIGURE 1 schematically illustrates a chromatographic apparatus that may be used to carry out the present invention.
- the apparatus comprises two liquid chromatography columns 10 and 12 having different stationary phases selected to produce qualitatively different types of separations of the components to be analyzed. For example, one might choose columns 10 and 12 packed with polar and nonpolar absorbing media respectively.
- a sample to be analyzed is introduced via injecter 14 and flows together with a solvent or mobile phase through splitter 16 into columns 10 and 12.
- the components of the sample migrate through columns 10 and 12 at various rates, and then elute past multichannel ultraviolet spectrophotometric detectors 20 and 22, respectively.
- Each detector 20 and 22 measures the absorbance of the solvent/sample mixture at a plurality of wavelengths at each one of a series of evenly spaced time points.
- the resulting absorbance data is stored and processed by digital computer 24, and the results are communicated to the analyst via an output device 26 such as a CRT screen, plotter, or printer.
- An output device 26 such as a CRT screen, plotter, or printer.
- a suitable instrument for detectors 20 and 22 is the diode array spectrophotometric detector for HPLC, Model No. HP1040A, available from the Hewlett-Packard Company. Suitable instruments for digital computer 24 and output device 26, compatible with the HP1040A detector, are available from the same company.
- FIGURE 1 It should be noted that it is not necessary to perform the two separation processes simultaneously.
- a single chromatographic column could be used, the sample being injected first using one solvent and then a second time with a different solvent.
- a single multichannel detector would suffice.
- the two-column embodiment of FIGURE 1 could also be modified by providing a single multichannel detector having two sample cells and means for switching the optical path back and forth (i.e., multiplexing) between the cells.
- FIGURE 2 illustrates one such peak 40.
- the absorbance level 42 before and after peak 40 is termed the background level, and represents principally the absorbance of the solvent mobile phase or sample carrier.
- the absorbance above background level 42 is due to one or more components of the sample, and the object is to identify such components.
- a necessary first step is to determine whether peak 40 is due to a single component or to several components that have migrated through the chromatographic column at essentially the same rate. In the latter case, it is then required to resolve composite curve 40 into its separate individual components.
- FIGURE 3 illustrates a hypothetical resolution for the case in which the peak is due to two components A and B, whose individual absorbances 50 and 55 add linearly to produce peak 40.
- FIGURE 4 A different and often superior technique, known as self-modeling curve resolution, is based on factor analysis.
- a sample has been analyzed using column 10 and detector 20 only, and that FIGURE 2 represents the output of one channel of multichannel detector 20.
- FIGURE 4 it is assumed that the UV absorbance of the sample has been measured at N different wavelengths ⁇ 1 through ⁇ N , and that at each wavelength, the absorbance was sampled at M sequential times t1 through t M . In general, this range of times may comprise the entire measurement period, or a subrange as illustrated in FIGURE 2.
- the optical absorbance at time i and wavelength j is designated a ij
- the a ij values are arranged in a data matrix 70 in which each row represents the wavelength spectrum of the unknown at a particular time (i.e., an absorbance spectrum), and each column represents a time spectrum at a particular wavelength (i.e., a wavelength chromatogram).
- the data represented by curve 40 in FIGURES 2 and 3 would therefore comprise a single column of the FIGURE 4 matrix.
- the background level 42 will be determined for each channel and subtracted from the data, so that the a ij values represent the absorbance of the sample alone.
- peak 40 represents two components A and B, that component A has eluted from the chromatographic column from times t1 through t Y , and that component B eluted at times t X through t M , where t1 ⁇ t X ⁇ t Y ⁇ t M . From times t1 through t X-1 , only component A is measured, and from times t Y+1 through t M , only component B is measured. Measurements during the intermediate time interval t X through t Y include both components.
- the columns of data matrix 70 can be thought of as points or vectors in an N dimensional space in which the axes are the absorbances at wavelengths ⁇ 1 through ⁇ N .
- matrix 70 would have two columns, and each row or spectrum could be represented as a point in a two-dimensional coordinate system. If the spectra were first normalized such that the absorbances in each row summed to unity, the result of plotting the spectra in such a two-dimensional space would be as indicated in FIGURE 5.
- Spectra measured at times t1 through t X-1 corresponding to pure component A, would cluster together at point 72, and spectra measured at times t Y+1 through t M , corresponding to pure component B, would cluster together at point 74.
- the clustering is a result of the normalization and the fact that for a pure component, the ratio of absorbance at two different wavelengths is a constant.
- Spectra measured at t X through t Y corresponding to mixtures of A and B, will lie on the straight line between points 72 and 74. For the usual case in which N is greater than 2, the line between points 72 and 74 would be a straight line in an N dimensional space.
- absorbance peak 40 actually corresponded to a single pure component, then the points in FIGURE 5 would form a single cluster.
- peak 40 were due to three components, then the points in FIGURE 5 would lie within the boundaries of a triangle.
- the space e.g., line, triangle
- the spectral points will have a dimension one less than the number of components present.
- the two-wavelength illustration of FIGURE 5 can be extended and formalized through the use of self-modeling curve resolution. Assume that an N channel detector has been used to record the absorbance of the eluent from a single chromatographic process. If the channels are sampled at M times, then the data can be represented by the M x N matrix 70 of FIGURE 4. The matrix is composed of elements a ij where the first subscript designates the time sample point and the second subscript designates the channel. The entire matrix will be designated by the symbol X.
- the rows or spectra forming matrix X are normalized such that
- the variance-covariance matrix X T X formed from this data will have a rank R equal to the number of distinct components present, and it will be possible to represent all of the variance in the data with the R principal eigenvectors V1 ... V R of X T X.
- all the spectra in matrix X can be represented as linear combinations of the two principal eigenvectors V1 and V2 of matrix X T X.
- it will be possible to rotate the N dimensional spectral space such that all of the spectral points lie on the plane defined by eigenvectors V1 and V2.
- the data can then be represented in a manner similar to the two-dimensional representation of FIGURE 5.
- Mean-centering consists of finding the average value of each column of matrix X, and subtracting that average from each element in that column.
- the variance-covariance matrix X T X is then formed by matrix multiplication.
- Mean-centering thus simply shifts the origin of the coordinate axis to the "center of gravity" of the data points. Its effect is to reduce the rank of the variance-covariance matrix by 1. This can readily be understood with reference to FIGURE 5. If the origin of the coordinate system were shifted to a position on the line between points 72 and 74, then all of the variance in the data could be represented by a single eigenvector directed along such line.
- the spectra can be resolved by projecting each spectral point onto the space defined by the eigenvectors.
- the spectra can be resolved by projecting each spectral point onto the space defined by the eigenvectors.
- the spectra can be resolved by projecting each spectral point onto the space defined by the eigenvectors.
- FIGURE 6 where the components elute out of a chromatographic column in two groups 80 and 82, with group 80 actually consisting of two components A and B, and group 82 consisting of a single additional component C.
- the resulting data can be represented by a data matrix such as matrix 70 of FIGURE 4.
- factor analysis would yield two principal eigenvectors V1 and V2 capable of representing all the variance in the data aside from noise.
- the fractional compositions represented by the other points (i.e., mixed spectra) on this line, for example point 88, can be determined by measuring the distance between it and points 84 and 86 in a manner analogous to mole fraction diagrams.
- the fraction of component A represented by point 88 is equal to the distance between points 86 and 88 divided by the distance between points 84 and 86.
- FIGURES 8 and 9 illustrate a more complex case in which three components A, B, and C, represented respectively by curves 90, 92, and 94, have eluted at nearly the same time.
- Curve 96 represents the data actually measured at one wavelength. While there are times, such as t1 and t2, when pure A and pure C respectively are measured, pure B is never measured. Subjecting the mean-centered multichannel chromatographic data to factor analysis, as described above, would yield two principal eigenvectors corresponding to three pure components.
- FIGURE 9 shows the original spectral data plotted in the space defined by principal eigenvectors V1 and V2.
- FIGURES 6 through 9 The analysis techniques that have been illustrated by FIGURES 6 through 9 may readily be carried out using a digital computer together with known programs for analytic geometry, matrix algebra and curve fitting. They have been shown here in graphical form principally for clarity and ease of illustration.
- the present invention overcomes these limitations by adding extra dimensions to the analysis.
- the dimensions are added by subjecting the unknown mixture to two or more different separation processes.
- the separation processes could be two different chromatographic columns, as illustrated in FIGURE 1, or any other separation processes that produce different spatial (or temporal) distributions of the individual components.
- An appropriate multichannel detection technique is used to determine a set of properties of the unknown sample (a sample set) at a plurality of positions along each distribution.
- the resulting sample sets for each process are then analyzed to determine a collection of basic sets capable of representing all of the sample sets for that process.
- the resulting basic sets for the different processes are then compared to determine those basic sets common to all processes.
- Such common sets are taken to be the sets of properties (i.e., the multichannel signatures) associated with the individual components making up the unknown sample. Incomplete basic sets found for less than all processes are then analyzed to determine whether they can be represented by linear combinations of common basic sets, or whether they can be represented as linear combinations of certain known basic sets and a new basic set.
- FIGURES 1 and 10-12 The invention can be understood for a simple case with reference to FIGURES 1 and 10-12.
- FIGURES 10a and 10b represent the respective elution profiles at a given wavelength.
- first column (FIGURE 10a) components A and B are completely overlapped
- second column (FIGURE 10B) components B and C are completely overlapped.
- the result would be a graph having two separate clusters of data points, indicating (incorrectly) that the mixture contains two pure components.
- the mean-centered variance-covariance matrix formed from the data from either column would have rank of 1.
- the data from the two columns is analyzed in a coherent manner.
- the spectra from column 10 are combined with the spectra from column 12 to form a single data matrix indicated by numeral 130 in FIGURE 11.
- FIGURE 11 it is assumed that multichannel detectors 20 and 22 (FIGURE 1) have analyzed the eluent from columns 10 and 12, respectively, at N wavelengths ⁇ 1 through ⁇ N , the set of wavelengths being the same for the two detectors.
- Detector 20 performs its measurements at times t 1 ...t M1
- detector 22 performs its measurements at times t' 1 ...t' M2 .
- the absorbance data from column 10 can be represented as an M1 x N matrix X1 in a manner identical to that described for matrix 70 of FIGURE 4.
- matrix X1 consists of that portion of matrix 130 above dashed line 132.
- the absorbance data from column 12 can be represented by an M2 x N matrix X2, corresponding to the portion of matrix 130 below line 132.
- the complete matrix 130 is analyzed, by the self-modeling curve resolution technique described above, or by another appropriate technique.
- FIGURE 10 For the simple case illustrated in FIGURE 10, the result could be represented as shown in FIGURE 12, wherein the original spectra have been plotted in the plane defined by principal eigenvectors V1 and V2. Spectra from column 10 cluster at points 140 and 142, while spectra from column 12 cluster at points 144 and 146. It may now appear that four components are present in the sample. However, if point 140 represents a pure component Z, then spectra lying at this point should have been found on both columns.
- ALSCOMPS alternating least squares algorithms with optimal scaling features
- each point found on only one column is checked to see if it lies on a straight line between two other points found only on the other column. If so, then the point in question represents an overlapped combination of the two other points. In FIGURE 12, no points satisfy this criteria, and the analysis therefore proceeds to stage two.
- stage two for each point found on only one column, straight lines are drawn to all points found only on the other column.
- lines 148 and 150 are drawn
- lines 152 and 154 are drawn.
- Identical lines could be constructed for points 144 and 146. All intersections of the lines so drawn are then examined to see if the intersections represent valid spectra.
- intersection point is transferred back into the original spectral space in which the axes are the absorbances at the various wavelengths. If the transformed point has a negative value (i.e., a negative absorbance) for any axis, it is rejected as invalid.
- point 156 is the intersection of lines 148 and 154. If point 156 represents a valid spectrum, then point 140 represents the completely overlapped mixture spectrum of the pure component spectra represented by points 144 and 156. These components can be designated A and B, respectively. Proceeding with the analysis, it is then apparent that point 146 represents a mixture spectrum of component B and a third component C whose pure spectrum is represented by point 142. Since the three remaining points 142, 144 and 156 have been "found" on both columns, the actual number of components and their locations have been determined. By transforming points 142, 144 and 156 back to the original spectral axes, the actual spectra representative of pure A, B, and C can be produced, and the corresponding components possibly identified by comparison with reference data.
- the fractional amounts of A, B, and C may be determined for each mixed spectral point by measuring the distances between them and the appropriate pure spectral points as was done for FIGURE 7 previously (page 12), or by fitting the pure spectra to the mixture spectra using least squares or another appropriate method.
- the original chromatographic data is then resolved into separate reconstructed chromatograms representative of pure A, B and C.
- Each of these reconstructed pure data sets may then be integrated to quantitatively determine the amounts of A, B, and C present, with appropriate reference to known calibration data. It should be noted that this resolution has been achieved even though component B was always completely overlapped or masked by other components of the mixture.
- FIGURES 10 and 12 illustrate a three-component case, three being the maximum number of components for which the data can readily be represented in two dimensions.
- FIGURES 13 through 17 illustrate one preferred method of carrying out the present invention in the more general case in which any number of components may be present.
- an unknown sample has been subjected to C different separation processes, and that each spatial distribution has been analyzed at a plurality of positions using the same multichannel detection means.
- the multichannel signatures are termed spectra, although nonspectral detection methods could also be used.
- the data from the C processes could be analyzed by combining it into a matrix such as matrix 130 of FIGURE 11, and by analyzing the entire matrix using mathematical methods such as those described above. For situations in which there are a large number of components, however, methods based on the direct analysis of matrix 130 can be computationally quite difficult. In addition, since the number of channels in the multichannel detection means must equal or exceed the number of components present, a multicomponent sample can often exceed the capacity of the available multichannel detection means. The method set forth in FIGURES 13 through 17 avoids this difficulty by taking advantage of the fact that, in most cases, each separation process will separate the components into a series of non-overlapping groups.
- FIGURES 13 through 17 Since, for a given process, no components will be found in more than one group, the data corresponding to each group can be "preprocessed" using, for example, self-modeling curve resolution and the results then combined and analyzed as described below.
- the method of FIGURES 13 through 17 will, in general, be carried out on a digital computer, such as computer 24 shown in FIGURE 1, and the flow chart of FIGURES 13 through 17 will, in that case, represent the program for operating the computer.
- the program commences by initializing parameters in block 200 and by collecting the spectral data from C processes in block 202, C being greater than 1. If appropriate, the operations in block 202 could include determining the background level for each process, and subtracting such background levels from the collected data.
- the data from the several processes are analyzed one at a time, commencing with block 204. As long as there are more processes to be analyzed, control passes from block 204 to block 206, where the next process P is selected and the variable GROUP is assigned a value of false. The program then enters a loop, commencing at block 208, and remains in that loop until all spectra (i.e., all multichannel signatures) in process P have been analyzed. The next spectrum to be analyzed is selected by block 210, and block 212 determines whether this spectrum differs from the background level for process P. If not, and if GROUP is still false, the program loops back to block 208.
- the variable GROUP is then assigned a value true in block 218, and control returns to block 208.
- GROUP is set to false, and control returns to block 208.
- test in block 208 fails, and control passes to block 222. If the last spectra measured on process P was part of a group (as opposed to a background level measurement), then this final group for process P is preprocessed in block 224. Control then returns to block 204. If there are more processes to be analyzed, the program proceeds to do so, commencing again with block 206. Otherwise, control passes to the program portion commencing with FIGURE 15.
- FIGURE 14 sets forth the subprogram used to process the spectra comprising a group.
- the rank of the spectra in the group is first determined in block 230, and the data is then resolved into one or more basic spectra in block 232.
- the rank of the data is preferably determined by means of the self-modeling curve resolution techniques previously described. If the rank of the mean-centered data is zero, then the one basic set is the mean of the spectra in the group. If the rank is greater than zero, then the basic sets are determined by self-modeling curve resolution or by another appropriate technique.
- the basic sets will be the minimum number of linearly independent spectra capable of representing all spectra in the group, i.e., it will be possible to express each spectrum in the group as a linear combination of that group's basic spectra.
- the basic spectra correspond either to pure components, or to overlapped mixtures that cannot be resolved by the separation process.
- Basic spectra may also be used as described previously to calculate the reconstructed chromatograms for pure components which can then be integrated and used to calculate concentrations.
- the sub-program of FIGURE 14 keeps track of basic spectra found for different groups and processes by means of a spectrum table and related program variables FREQ and COUNT. Each unique basic spectra found for any process is stored in the spectrum table. For each spectrum table entry S, FREQ (S) indicates the number of different processes for which entry S has been found, and COUNT (S, P) indicates the number of times (usually 0 or 1) that entry S has been found on process P.
- Block 236 selects the next basic spectrum in the group, and block 238 determines whether it is identical to any basic spectrum already found and stored in the spectrum table. If the basic spectrum is unique, then block 240 stores it in position S (the next available position) in the spectrum table. Block 242 then initializes the FREQ and COUNT variables for spectrum S and returns control to block 234. If a basic spectrum is found by block 238 to be the same as a basic spectrum already in the spectrum table, block 244 sets variable S so that it points to such spectrum table entry. Block 246 then tests to see whether basic spectrum S has already been found on the current process P.
- the spectrum table contains a number of basic spectra, each of which represents either a pure component spectra, or an overlapped combination of spectra which could not be resolved in blocks 230 and 232.
- the counter array FREQ indicates, for each basic spectrum, the number of processes on which that particular basic spectrum was found. If all FREQ values are equal to C, then each basic spectrum was found on all processes, and the analysis is complete. In this case, the test in block 256 is successful, and control passes to FIGURE 17.
- Block 258 creates an ordered list of all basic spectra found less than C times, the list beginning with those basic spectra found least frequently. The program then enters a loop beginning with block 260 which analyzes each basic spectrum in the list to determine whether it in fact consists of a linear combination of two other basic spectra.
- block 262 selects the next basic spectrum (I) from the list, and block 264 then determines whether basic spectrum I lies on a straight line between any two other basic spectra (A and B) that were found only on other processes. If basic spectrum I cannot be so resolved, then the program returns to block 260 and continues looping. If the test in block 264 is satisfied for two basic spectra A and B, then basic spectrum I actually represents an overlapped combination of the components corresponding to basic spectra A and B. Basic spectrum I is therefore deleted from the spectrum table in block 266, the FREQ values for A and B are incremented in block 268, and control returns to block 260.
- the line referred to in block 264 is a line drawn in N dimensional spectral space, where N is the number of channels in the multichannel detector.
- Each intersection determined by block 278 will have two or more lines radiating from it. The intersections are ordered based on the number of radiating lines, beginning with those with the greatest number.
- the program then enters a loop beginning at block 280 in which each intersection is analyzed. Block 282 selects the next ordered intersection, and block 284 determines whether this intersection corresponds to a valid spectrum. This determination is made by checking the validity of each coordinate of the intersection point. For example, for an N channel spectrophotometric detector in which the measured data represents absorbances, each of the N coordinates of the intersection point is checked to see if it is a positive number. If an intersection does not represent a valid spectrum, then the program returns to block 280 and continues looping.
- intersection represents a new pure component, and a basic spectrum corresponding to the intersection is added to the spectrum table as indicated in block 286.
- the FREQ value for this new basic spectrum is set equal to the number of lines radiating from the intersection.
- block 288 for each line radiating from the intersection, the basic spectrum corresponding to the intermediate point of the line is deleted from the spectrum table, and the FREQ value for the basic spectrum on the other end of the line is incremented by one.
- the program checks, in block 290, to see whether all basic spectra have been found on all processes. If not, then it resumes checking intersections at block 280. When test 290 has been satisfied or when all intersections have been checked, control passes to block 292 of FIGURE 17.
- Block 292 finds the rank of the data matrix formed from the spectra from all processes. For a two-process case, R would be the rank of matrix 130 in FIGURE 11.
- Block 294 then checks to see whether the number of basic spectra in the spectrum table equals R. If it is not, then a warning message is printed in block 296.
- Block 298 then checks to see whether all basic spectra have been found on all processes. If they have not, then a warning message is printed in block 300.
- Block 302 then checks to see if the COUNT variable is greater than 1 for any basic spectrum and process. If so, then it is possible that the sample being analyzed contains two components having identical signatures, and a warning message is printed in block 304. Finally, in block 306, the basic spectra stored in the spectrum table are output via output device 26 (FIGURE 1), and the program is then complete.
Landscapes
- Physics & Mathematics (AREA)
- Analytical Chemistry (AREA)
- General Health & Medical Sciences (AREA)
- Health & Medical Sciences (AREA)
- Life Sciences & Earth Sciences (AREA)
- Chemical & Material Sciences (AREA)
- Spectroscopy & Molecular Physics (AREA)
- Biochemistry (AREA)
- Pathology (AREA)
- General Physics & Mathematics (AREA)
- Immunology (AREA)
- Library & Information Science (AREA)
- Engineering & Computer Science (AREA)
- Investigating Or Analysing Materials By Optical Means (AREA)
- Investigating Or Analyzing Non-Biological Materials By The Use Of Chemical Means (AREA)
Claims (19)
- Procédé pour analyser un échantillon de façon à produire des données correspondant à un ensemble de propriétés d'au moins un des composants individuels de celui-ci, les propriétés étant choisies de telle sorte que ledit ensemble de propriétés est convenable pour identifier au moins un desdits composants, ledit procédé comportant les étapes qui consistent:i) a soumettre ledit échantillon à un procédé de séparation pour produire une distribution de l'échantillon;ii) à déterminer ledit ensemble de propriétés de l'échantillon par des moyens de détection multi-canaux à un ensemble de positions selon ladite distribution; pour produire des ensembles d'échantillons correspondants;iii) à engendrer un ou plusieurs ensembles de base, tels que les ensembles d'échantillons peuvent être représentés par les ensembles de base communs, de telle sorte que lesdits ensembles de base communs soient des valeurs estimées dudit ensemble de propriétés pour des composés individuels;
caractérisé en ce que :
dans l'étape i), l'échantillon est soumis à un ensemble de procédés de séparation, qui sont susceptibles de produire un ensemble correspondant de différentes distributions de l'échantillon,
dans l'étape ii), undit ensemble d'échantillons est produit par lesdits moyens de détection multi-canaux à chacune d'un ensemble de positions selon chaque dite distribution, et
dans l'étape iii), lesdits ensembles de base communs uniques ou multiples sont engendrés par analyse de tous les ensembles d'échantillons correspondant à toutes lesdites distributions. - Procédé tel que revendiqué à la revendication 1, dans lequel l'étape qui consiste à analyser tous les ensembles d'échantillons comporte :
le fait de déterminer un ou plusieurs ensembles de base pour chaque procédé de séparation, de telle sorte que tous les ensembles d'échantillons correspondant à la distribution produite par ce procédé peuvent être représentés par l'ensemble de base dudit procédé; et
le fait de comparer les ensembles de base pour les différents procédés les uns par rapport aux autres pour identifier de la sorte un ou plusieurs desdits ensembles de base communs de telle sorte que tous les ensembles d'échantillons peuvent être représentés par les ensembles de base communs. - Procédé selon la revendication 2, dans lequel le fait de comparer les ensembles de base consiste en outre à identifier un ou plusieurs groupes de base incomplets trouvés pour moins que tous les procédés et pour chaque groupe de base incomplet, à déterminer si ledit groupe de base incomplet peut être représenté en tant que combinaison linéaire de deux groupes de base qui ne se trouvent pas pour des procédés quelconques pour lesquels ledit ensemble de base incomplet a été trouvé et, s'il ne peut pas être représenté ainsi, pour chaque procédé pour lequel ledit ensemble de base incomplet a été trouvé, à supprimer ledit ensemble de base incomplet et à additionner lesdits deux ensembles de base.
- Procédé selon la revendication 3, dans lequel lesdits ensembles de base incomplets sont analysés dans un ordre croissant basé sur le nombre de procédés pour lesquels ils ont été trouvés.
- Procédé selon l'une quelconque des revendications 2, 3 et 4, dans lequel le fait de comparer les ensembles de base comporte le fait de trouver un nouvel ensemble de base tel qu'il existe un ensemble de premiers ensembles de base, de telle sorte que, pour chaque premier ensemble de base, un second ensemble de base que l'on ne trouve pas pour un procédé quelconque pour lequel ledit premier ensemble de base a été trouvé peut être représenté en tant que combinaison linéaire dudit premier ensemble de base et dudit nouvel ensemble de base.
- Procédé selon l'une quelconque des revendications 2, 3 et 5, qui comporte en outre le fait de normaliser chaque ensemble d'échantillons de telle sorte qu'il ait une somme correspondant à une valeur constante.
- Procédé selon la revendication 6, dans lequel le fait de déterminer les ensembles de base pour chaque procédé de séparation consiste en outre pour chaque groupe d'un ou plusieurs composants totalement séparé des autres composants par ledit procédé, à analyser les ensembles d'échantillons correspondant audit groupe pour déterminer le nombre de composants dans ledit groupe et les ensembles de base pour ledit groupe, de telle sorte que tous les ensembles d'échantillons correspondant audit groupe peuvent être représentés par les ensembles de base pour ledit groupe.
- Procédé selon la revendication 7, dans lequel le fait d'analyser les ensembles d'échantillons correspondant audit groupe consiste à réaliser une analyse à résolution avec courbe d'autocorrélation sur les ensembles d'échantillons correspondant audit groupe, de telle sorte que ledit groupe est résolu sous la forme d'un ou plusieurs ensembles de base.
- Procédé selon la revendication 8, dans lequel le fait d'analyser les ensembles d'échantillons correspondant audit groupe consiste en outre à centrer les données correspondant à chacune desdites propriétés avant de réaliser l'analyse de résolution à courbe d'autocorrélation.
- Procédé selon l'une quelconque des revendications précédentes, dans lequel l'ensemble des procédés de séparation consiste en deux procédés chromatographiques ayant des phases stationnaires différentes.
- Procédé selon la revendication 10, dans lequel ledit ensemble de propriétés comporte l'absorbance d'un rayonnement électromagnétique à plusieurs longueurs d'onde.
- Appareil pour analyser un échantillon de façon à produire des données correspondant à un ensemble de propriétés d'au moins un des composants individuels de celui-ci, les propriétés étant choisies de telle sorte que chaque ensemble de propriétés est convenable pour identifier au moins un desdits composants, ledit appareil comprenant :i) des moyens de séparation (10, 12) conçus pour produire une distribution de l'échantillon;ii) des moyens de détection multi-canaux (20, 22) conçus pour déterminer ledit ensemble de propriétés de l'échantillon pour chacune d'un ensemble de positions selon ladite distribution et pour produire les ensembles d'échantillons correspondants;iii) des moyens de traitement (24) disposés pour engendrer un ou plusieurs ensembles de base, de telle sorte que les ensembles d'échantillons puissent être représentés par les ensembles de base communs, de telle sorte que les ensembles de base communs soient des valeurs estimées dudit ensemble de propriétés pour des composés individuels;
caractérisé en ce que :
un ensemble desdits moyens de séparation (10, 12) sont prévus et sont disposés pour produire un ensemble correspondant de diverses distributions de l'échantillon;
lesdits moyens de détection multi-canaux (20, 22) sont conçus pour produire lesdits ensembles d'échantillons en fonction de chacune desdites distributions, et
lesdits moyens de traitement (24) sont conçus pour engendrer lesdits ensembles de base uniques ou multiples par analyse de tous les ensembles d'échantillons correspondant à toutes lesdites distributions de l'échantillon. - Appareil tel que revendiqué à la revendication 12, dans lequel lesdits moyens de traitement (24) comportent :
des moyens prévus pour déterminer un ou plusieurs ensembles de base pour chaque moyen de séparation, de telle sorte que tous les ensembles d'échantillons correspondant à la distribution produite par ces moyens de séparation peuvent être représentés par les ensembles de base pour ces moyens de séparation, et
des moyens conçus pour comparer les ensembles de base pour les différents moyens de séparation l'un par rapport à l'autre de façon à identifier un ou plusieurs ensembles de base communs de sorte que tous les ensembles d'échantillons puissent être représentés par les ensembles de base communs, de sorte que lesdits ensembles de base communs soient des valeurs estimées dudit ensemble de propriétés pour des composants individuels. - Appareil tel que revendiqué à la revendication 13, dans lequel des moyens pour comparer les ensembles de base comportent en outre des moyens pour identifier un ou plusieurs ensembles de base incomplets trouvés pour moins que l'ensemble des moyens de séparation, et pour chaque ensemble de base incomplet, pour déterminer si ledit ensemble de base incomplet peut être représenté sous la forme d'une combinaison linéaire de deux ensembles de base qui ne se trouvent pas pour un moyen de séparation quelconque pour lequel ledit ensemble de base incomplet a été trouvé et, si cela ne peut pas être ainsi représenté, pour chaque moyen de séparation pour lequel ledit ensemble de base incomplet a été trouvé, pour supprimer ledit ensemble de base incomplet et ajouter lesdits deux ensembles de base.
- Appareil tel que revendiqué à la revendication 13 ou la revendication 14, dans lequel les moyens pour comparer les ensembles de base consistent en des moyens pour trouver un nouvel ensemble de base de telle sorte qu'il existe un ensemble de premiers ensembles de base tels que, pour chaque premier ensemble de base, un second ensemble de base non trouvé pour des moyens de séparation quelconques pour lesquels ledit premier ensemble de base a été trouvé peuvent être représentés sous la forme d'une combinaison linéaire du premier ensemble de base et dudit nouvel ensemble de base.
- Appareil tel que revendiqué dans l'une quelconque des revendications 13 à 15, dans lequel les moyens pour déterminer les ensembles de base pour chaque moyen de séparation comportent en outre des moyens pour analyser, pour chaque groupe d'un ou plusieurs composants totalement séparés des autres composants par ces moyens de séparation, les ensembles d'échantillons correspondant audit groupe pour déterminer le nombre de composants dans ledit groupe et les ensembles de base pour ledit groupe, de telle sorte que tous les ensembles d'échantillons correspondant audit groupe peuvent être représentés par les ensembles de base pour ledit groupe.
- Appareil tel que revendiqué dans l'une quelconque des revendications 12 à 16, dans lequel les moyens pour analyser les ensembles d'échantillons correspondant audit groupe comportent des moyens pour réaliser une analyse de résolution à courbe d'autocorrélation sur les ensembles d'échantillons correspondant audit groupe, de telle sorte que ledit groupe est résolu en un ou plusieurs ensembles de base.
- Appareil tel que revendiqué dans l'une quelconque des revendications 12 à 17, dans lequel l'ensemble des moyens de séparation consiste en deux colonnes chromatographiques (10, 12) ayant des phases stationnaires différentes.
- Appareil tel que revendiqué à la revendication 18, dans lequel les moyens de détection (20, 22) consistent en au moins un détecteur spectrophotométrique, dans lequel ledit ensemble de propriétés comporte l'absorbance de rayonnement électromagnétique pour diverses longueurs d'onde.
Applications Claiming Priority (2)
| Application Number | Priority Date | Filing Date | Title |
|---|---|---|---|
| US548493 | 1983-11-03 | ||
| US06/548,493 US4631687A (en) | 1983-11-03 | 1983-11-03 | Method and apparatus for analysis employing multiple separation processes |
Publications (3)
| Publication Number | Publication Date |
|---|---|
| EP0140599A2 EP0140599A2 (fr) | 1985-05-08 |
| EP0140599A3 EP0140599A3 (en) | 1986-12-30 |
| EP0140599B1 true EP0140599B1 (fr) | 1991-03-06 |
Family
ID=24189090
Family Applications (1)
| Application Number | Title | Priority Date | Filing Date |
|---|---|---|---|
| EP84306781A Expired EP0140599B1 (fr) | 1983-11-03 | 1984-10-04 | Méthode et appareil d'analyse utilisant des processus multiples de séparation |
Country Status (4)
| Country | Link |
|---|---|
| US (1) | US4631687A (fr) |
| EP (1) | EP0140599B1 (fr) |
| JP (1) | JPS60115829A (fr) |
| DE (1) | DE3484224D1 (fr) |
Cited By (1)
| Publication number | Priority date | Publication date | Assignee | Title |
|---|---|---|---|---|
| DE4238781A1 (de) * | 1992-11-17 | 1994-05-19 | Kulicke Werner Michael Prof Dr | Verfahren zur Durchführung von Lichtstreuuntersuchungen und Meßanordnung zur Durchführung des Verfahrens |
Families Citing this family (36)
| Publication number | Priority date | Publication date | Assignee | Title |
|---|---|---|---|---|
| US4766550A (en) * | 1985-10-30 | 1988-08-23 | Westinghouse Electric Corp. | Automatic on-line chemistry monitoring system |
| US4865746A (en) * | 1987-01-23 | 1989-09-12 | Exxon Research And Engineering Company | Chromatographic analysis of hydrocarbons |
| US4807148A (en) * | 1987-05-29 | 1989-02-21 | Hewlett-Packard Company | Deconvolving chromatographic peaks |
| US4837726A (en) * | 1987-06-19 | 1989-06-06 | Applied Biosystems, Inc. | Quantitation of chromatographic information |
| US4852017A (en) * | 1987-06-19 | 1989-07-25 | Applied Biosystems, Inc. | Determination of peptide sequences |
| US4988446A (en) * | 1988-05-14 | 1991-01-29 | Exxon Research And Engineering Company | Method for spectroscopic analysis of hydrocarbons |
| DE3816520A1 (de) * | 1988-05-14 | 1989-11-23 | Bosch Gmbh Robert | Regelverfahren und -vorrichtung, insbesondere lambdaregelung |
| US5076909A (en) * | 1988-05-14 | 1991-12-31 | Exxon Research And Engineering Company | Method for refining or upgrading hydrocarbons with analysis |
| US5014216A (en) * | 1988-07-19 | 1991-05-07 | Beckman Instruments, Inc. | Concentration determination with multiple wavelength flash photometers |
| US5116764A (en) * | 1988-07-26 | 1992-05-26 | Raymond Annino | Dual-column, dual-detector gas detector and analyzer |
| EP0359320A3 (fr) * | 1988-09-14 | 1991-10-23 | Philips Electronics Uk Limited | Chromatographe |
| US5019999A (en) * | 1988-09-30 | 1991-05-28 | Technicon Instruments Corporation | Immunoanalysis method for discriminating between antigen excess and antibody excess conditions |
| FR2675265B1 (fr) * | 1991-04-11 | 1993-07-30 | Schlumberger Services Petrol | Procede d'analyse de melanges d'huiles hydrocarbonees utilisant la chromatographie par permeation de gel. |
| WO1993021592A1 (fr) * | 1992-04-16 | 1993-10-28 | The Dow Chemical Company | Procede ameliore d'interpretation de donnees complexes et de detection de defauts dans un instrument ou un processus |
| US5644503A (en) * | 1994-03-28 | 1997-07-01 | Hitachi, Ltd. | Methods and apparatuses for analyzing multichannel chromatogram |
| JP2824443B2 (ja) * | 1994-05-12 | 1998-11-11 | ティ・エフ・シィ株式会社 | 分取用液体クロマトグラフィ装置 |
| DE69630011T2 (de) * | 1996-03-27 | 2004-04-01 | Agilent Technologies Inc., A Delaware Corp., Palo Alto | Verfahren zum Nachweis von Probensubstanzen und Fluoreszenzspektrometer nach diesem Verfahren |
| US5808180A (en) * | 1996-09-12 | 1998-09-15 | Exxon Research And Engineering Company | Direct method for determination of true boiling point distillation profiles of crude oils by gas chromatography/mass spectrometry |
| US6296771B1 (en) | 1999-04-02 | 2001-10-02 | Symyx Technologies, Inc. | Parallel high-performance liquid chromatography with serial injection |
| US6579720B1 (en) * | 1999-05-13 | 2003-06-17 | Bdc Pharma Llc | Method for activity profiling compound mixtures |
| US6673554B1 (en) * | 1999-06-14 | 2004-01-06 | Trellie Bioinformatics, Inc. | Protein localization assays for toxicity and antidotes thereto |
| IT1312357B1 (it) * | 1999-06-17 | 2002-04-15 | Arvi S N C Di Arrigoni Roberto | Procedimento e dispositivo per eseguire contemporaneamente analisigascromatografiche di componenti diversi |
| DE19931901A1 (de) * | 1999-07-08 | 2001-01-11 | Basf Ag | Verfahren und Vorrichtung zum Parallel-Analysieren von kolloidalen Teilchen mit Feldflußfraktionierung |
| US6333501B1 (en) * | 2000-01-27 | 2001-12-25 | Perkin-Elmer Corporation | Methods, apparatus, and articles of manufacture for performing spectral calibration |
| AU2001261392A1 (en) * | 2000-05-12 | 2001-11-26 | Admetric Biochem Inc. | High throughput chromatographic systems |
| US6635173B2 (en) * | 2000-12-28 | 2003-10-21 | Cohesive Technologies, Inc. | Multi column chromatography system |
| JP3868267B2 (ja) * | 2001-10-31 | 2007-01-17 | 株式会社荏原製作所 | マルチカラム・アフィニティー検出システム |
| US7195486B2 (en) * | 2002-08-06 | 2007-03-27 | Mcgraw Robert W | Reconfigurable simulation structure |
| CN102272590A (zh) * | 2008-12-23 | 2011-12-07 | 微宏公司 | 高通量分析的设备和方法 |
| US10261058B2 (en) * | 2014-01-14 | 2019-04-16 | Bio-Rad Laboratories, Inc. | Method and system for liquid chromatography data analysis |
| US10881985B1 (en) * | 2016-12-08 | 2021-01-05 | Elemental Scientific, Inc. | System with reusable column with resin packing and unpacking procedures and sample analysis |
| RU2679912C1 (ru) * | 2018-04-26 | 2019-02-14 | Федеральное Государственное Бюджетное Учреждение Науки Институт Химии Коми Научного Центра Уральского Отделения Российской Академии Наук | Способ количественного анализа многокомпонентной газовой смеси в технологическом потоке |
| EP3742160B1 (fr) | 2019-05-24 | 2023-08-09 | Sartorius Stedim Biotech GmbH | Procédé de chromatographie, procédé de détermination de la concentration d'au moins un composé dans un procédé de chromatographie et procédé d'obtention d'au moins un paramètre de procédé de chromatographie |
| EP3742159A1 (fr) * | 2019-05-24 | 2020-11-25 | Sartorius Stedim Biotech GmbH | Procédé de chromatographie, procédé de détermination de l'influence de l'interdépendance d'au moins deux paramètres dans un procédé de chromatographie et procédé d'obtention d'au moins un paramètre de procédé de chromatographie |
| CN110793955A (zh) * | 2019-11-07 | 2020-02-14 | 江苏师范大学 | 一种化学反应产物的快速分离-定性方法 |
| SG10202002459UA (en) | 2020-03-17 | 2021-10-28 | Shimadzu Corp | Peak analyzing method and waveform processing device |
Family Cites Families (17)
| Publication number | Priority date | Publication date | Assignee | Title |
|---|---|---|---|---|
| BE636278A (fr) * | 1962-08-17 | |||
| US3374659A (en) * | 1965-01-22 | 1968-03-26 | Phillips Petroleum Co | Gas analysis |
| CH462501A (de) * | 1965-03-26 | 1968-09-15 | Ceskoslovenska Akademie Ved | Verfahren und Einrichtung zur Vermeidung der Wiedervermischung einzelner Komponenten eines mit einem Indikationsreagens zur Indikationsreaktion fähigen Stoffgemisches nach dessen Trennung |
| SE326056B (fr) * | 1966-01-07 | 1970-07-13 | Ceskoslovenska Akademie Ved | |
| US3726127A (en) * | 1968-07-25 | 1973-04-10 | Westinghouse Electric Corp | Methods for detecting presence and measuring the concentration of minor overlapped components in gas chromatography |
| US3676649A (en) * | 1970-05-08 | 1972-07-11 | Phillips Petroleum Co | Signal analysis and recording |
| GB1339475A (en) * | 1971-05-04 | 1973-12-05 | Polska Akademia Nauk Instytut | Chromatogrpahic spectrophotometric method of analysis and equipment suitable for employing the method |
| US3847546A (en) * | 1972-10-04 | 1974-11-12 | Chromalytics Corp | Method and system for thermal analysis |
| US3847550A (en) * | 1973-03-27 | 1974-11-12 | Atomic Energy Commission | Differential chromatographic method |
| CS182967B1 (en) * | 1974-04-04 | 1978-05-31 | Jan Jokl | Dividing analysis equipment |
| FR2279104A1 (fr) * | 1974-07-18 | 1976-02-13 | Aquitaine Petrole | Procede d'analyse par chromatographie en phase liquide |
| US3923460A (en) * | 1974-11-12 | 1975-12-02 | Dow Chemical Co | Dual ion chromatograph using parallel columns for ionic analysis |
| US4271697A (en) * | 1979-10-17 | 1981-06-09 | Phillips Petroleum Company | Chromatographic analysis |
| US4367041A (en) * | 1980-08-25 | 1983-01-04 | Micromeritics Instrument Corporation | Chromatograph detection system |
| US4364263A (en) * | 1980-09-15 | 1982-12-21 | Burroughs Wellcome Co. | High pressure liquid chromatographic system |
| US4353242A (en) * | 1980-12-16 | 1982-10-12 | University Of Utah Research Foundation | Multichannel detection and resolution of chromatographic peaks |
| US4383433A (en) * | 1981-07-17 | 1983-05-17 | Phillips Petroleum Company | Chromatographic analysis using a plurality of detectors |
-
1983
- 1983-11-03 US US06/548,493 patent/US4631687A/en not_active Expired - Lifetime
-
1984
- 1984-10-04 DE DE8484306781T patent/DE3484224D1/de not_active Expired - Fee Related
- 1984-10-04 EP EP84306781A patent/EP0140599B1/fr not_active Expired
- 1984-10-31 JP JP59230010A patent/JPS60115829A/ja active Pending
Cited By (1)
| Publication number | Priority date | Publication date | Assignee | Title |
|---|---|---|---|---|
| DE4238781A1 (de) * | 1992-11-17 | 1994-05-19 | Kulicke Werner Michael Prof Dr | Verfahren zur Durchführung von Lichtstreuuntersuchungen und Meßanordnung zur Durchführung des Verfahrens |
Also Published As
| Publication number | Publication date |
|---|---|
| JPS60115829A (ja) | 1985-06-22 |
| EP0140599A2 (fr) | 1985-05-08 |
| EP0140599A3 (en) | 1986-12-30 |
| US4631687A (en) | 1986-12-23 |
| DE3484224D1 (de) | 1991-04-11 |
Similar Documents
| Publication | Publication Date | Title |
|---|---|---|
| EP0140599B1 (fr) | Méthode et appareil d'analyse utilisant des processus multiples de séparation | |
| Sanchez et al. | Generalized rank annihilation method: I. Application to liquid chromatography—diode array ultraviolet detection data | |
| US7279679B2 (en) | Methods and systems for peak detection and quantitation | |
| US4353242A (en) | Multichannel detection and resolution of chromatographic peaks | |
| Griffiths et al. | Capillary Gc/Ft-Ir | |
| JP3091866B2 (ja) | 質量分光法における時間圧縮クロマトグラフィー | |
| Hites | Gas chromatography mass spectrometry | |
| US4802102A (en) | Baseline correction for chromatography | |
| Mondello et al. | Comprehensive two-dimensional gas chromatography–mass spectrometry | |
| Prazen et al. | Second‐order chemometric standardization for high‐speed hyphenated gas chromatography: Analysis of GC/MS and comprehensive GC× GC data | |
| EP0161672B1 (fr) | Système de traitement de données pour chromatographie | |
| Carey et al. | Chemometric analysis of multisensor arrays | |
| EP0851219B1 (fr) | Comparaison de données obtenues par des instruments de mesure | |
| US6944549B2 (en) | Method and apparatus for automated detection of peaks in spectroscopic data | |
| CN118091002A (zh) | Hplc-dad光谱数据库及其构建方法、基于hplc-dad光谱数据库的物质判别方法和搜索方法及其系统 | |
| Purcaro et al. | Performance evaluation of a rapid‐scanning quadrupole mass spectrometer in the comprehensive two‐dimensional gas chromatography analysis of pesticides in water | |
| JPH0245150B2 (fr) | ||
| CN109541100A (zh) | 多通道波长的信号漂移处理方法、装置及多通道检测器 | |
| Castledine et al. | Strategies for peak-purity assessment in liquid chromatography | |
| Cserháti et al. | Hyphenated techniques in thin-layer chromatography | |
| Weismüller et al. | Quantitative multicomponent analysis of complex mixtures by means of Full Spectrum quantitation and principal component analysis | |
| CN113076812A (zh) | 光谱的量子化指纹图谱的处理方法、系统、介质及应用 | |
| Vandeginste et al. | Data handling in HPLC-diode array UV-spectrometry | |
| Webb et al. | Real-time absorbance ratio and absorbance difference measurements using dual-wavelength HPLC detectors | |
| Azarraga et al. | Infrared Fourier Transform Spectrometry of Gas Chromatography Effluents |
Legal Events
| Date | Code | Title | Description |
|---|---|---|---|
| PUAI | Public reference made under article 153(3) epc to a published international application that has entered the european phase |
Free format text: ORIGINAL CODE: 0009012 |
|
| AK | Designated contracting states |
Designated state(s): BE DE FR GB LU NL |
|
| PUAL | Search report despatched |
Free format text: ORIGINAL CODE: 0009013 |
|
| AK | Designated contracting states |
Kind code of ref document: A3 Designated state(s): BE DE FR GB LU NL |
|
| 17P | Request for examination filed |
Effective date: 19870604 |
|
| 17Q | First examination report despatched |
Effective date: 19890222 |
|
| GRAA | (expected) grant |
Free format text: ORIGINAL CODE: 0009210 |
|
| AK | Designated contracting states |
Kind code of ref document: B1 Designated state(s): BE DE FR GB LU NL |
|
| PG25 | Lapsed in a contracting state [announced via postgrant information from national office to epo] |
Ref country code: NL Effective date: 19910306 Ref country code: FR Effective date: 19910306 Ref country code: BE Effective date: 19910306 |
|
| REF | Corresponds to: |
Ref document number: 3484224 Country of ref document: DE Date of ref document: 19910411 |
|
| EN | Fr: translation not filed | ||
| NLV1 | Nl: lapsed or annulled due to failure to fulfill the requirements of art. 29p and 29m of the patents act | ||
| PG25 | Lapsed in a contracting state [announced via postgrant information from national office to epo] |
Ref country code: LU Free format text: LAPSE BECAUSE OF NON-PAYMENT OF DUE FEES Effective date: 19911031 |
|
| PLBE | No opposition filed within time limit |
Free format text: ORIGINAL CODE: 0009261 |
|
| STAA | Information on the status of an ep patent application or granted ep patent |
Free format text: STATUS: NO OPPOSITION FILED WITHIN TIME LIMIT |
|
| 26N | No opposition filed | ||
| PG25 | Lapsed in a contracting state [announced via postgrant information from national office to epo] |
Ref country code: DE Effective date: 19920701 |
|
| PGFP | Annual fee paid to national office [announced via postgrant information from national office to epo] |
Ref country code: GB Payment date: 19940916 Year of fee payment: 11 |
|
| PG25 | Lapsed in a contracting state [announced via postgrant information from national office to epo] |
Ref country code: GB Effective date: 19951004 |
|
| GBPC | Gb: european patent ceased through non-payment of renewal fee |
Effective date: 19951004 |