EP0151974A2 - Quantification de spots - Google Patents
Quantification de spots Download PDFInfo
- Publication number
- EP0151974A2 EP0151974A2 EP85100654A EP85100654A EP0151974A2 EP 0151974 A2 EP0151974 A2 EP 0151974A2 EP 85100654 A EP85100654 A EP 85100654A EP 85100654 A EP85100654 A EP 85100654A EP 0151974 A2 EP0151974 A2 EP 0151974A2
- Authority
- EP
- European Patent Office
- Prior art keywords
- model
- spot
- image
- pixel
- set forth
- Prior art date
- Legal status (The legal status is an assumption and is not a legal conclusion. Google has not performed a legal analysis and makes no representation as to the accuracy of the status listed.)
- Withdrawn
Links
Images


Classifications
-
- G—PHYSICS
- G01—MEASURING; TESTING
- G01N—INVESTIGATING OR ANALYSING MATERIALS BY DETERMINING THEIR CHEMICAL OR PHYSICAL PROPERTIES
- G01N21/00—Investigating or analysing materials by the use of optical means, i.e. using sub-millimetre waves, infrared, visible or ultraviolet light
- G01N21/17—Systems in which incident light is modified in accordance with the properties of the material investigated
- G01N21/59—Transmissivity
- G01N21/5907—Densitometers
- G01N21/5911—Densitometers of the scanning type
-
- G—PHYSICS
- G01—MEASURING; TESTING
- G01N—INVESTIGATING OR ANALYSING MATERIALS BY DETERMINING THEIR CHEMICAL OR PHYSICAL PROPERTIES
- G01N27/00—Investigating or analysing materials by the use of electric, electrochemical, or magnetic means
- G01N27/26—Investigating or analysing materials by the use of electric, electrochemical, or magnetic means by investigating electrochemical variables; by using electrolysis or electrophoresis
- G01N27/416—Systems
- G01N27/447—Systems using electrophoresis
- G01N27/44704—Details; Accessories
- G01N27/44717—Arrangements for investigating the separated zones, e.g. localising zones
- G01N27/44721—Arrangements for investigating the separated zones, e.g. localising zones by optical means
-
- G—PHYSICS
- G01—MEASURING; TESTING
- G01N—INVESTIGATING OR ANALYSING MATERIALS BY DETERMINING THEIR CHEMICAL OR PHYSICAL PROPERTIES
- G01N21/00—Investigating or analysing materials by the use of optical means, i.e. using sub-millimetre waves, infrared, visible or ultraviolet light
- G01N21/17—Systems in which incident light is modified in accordance with the properties of the material investigated
- G01N21/59—Transmissivity
- G01N21/5907—Densitometers
- G01N2021/5915—Processing scan data in densitometry
- G01N2021/5923—Determining zones of density; quantitating spots
-
- G—PHYSICS
- G01—MEASURING; TESTING
- G01N—INVESTIGATING OR ANALYSING MATERIALS BY DETERMINING THEIR CHEMICAL OR PHYSICAL PROPERTIES
- G01N30/00—Investigating or analysing materials by separation into components using adsorption, absorption or similar phenomena or using ion-exchange, e.g. chromatography or field flow fractionation
- G01N30/90—Plate chromatography, e.g. thin layer or paper chromatography
- G01N30/95—Detectors specially adapted therefor; Signal analysis
Definitions
- This invention relates to a method and system for improving the ability to quantitate the amount of flux or material in localized collections of such flux or material typically called a "spot".
- spots encountered in such fields as astronomy, chemistry. biology, and the like, may be distributed in patterns, constellations or other configurations. The problems are essentially the same in all of these fields-each spot must be located, resolved from possible overlapping spots and quantitated.
- a typical gel quantitation system has four principal components: scanner, software, computer and display.
- a scanner typically transmissively or reflectively, converts the image into an array of numerical gray level measurements usually termed pixels, each pixel representing an element of the array, suitable for computer manipulation.
- the proteins to be separated may be radiolabeled.
- the radiation flux from these proteins after separation may be used to expose photographic film, thereby forming an autoradiogram of the gel.
- the proteins may be stained by an optically absorbing material after separation.
- a pattern of optically absorbing spots is produced that may be measured with the aid of a scanner or scanning densitometer.
- the output of such a scanner is typically a series of measurements of the optical density of the stained gel or autoradiogram sample, these measurements being regularly spaced in a rectangular array that covers substantially the entire surface of the sample.
- the software is a collection of computer programs designed to analyze the data supplied by the scanner.
- the computer analyzes the pixel data by executing the instructions provided by the software.
- a display system demonstrates the results of this analysis, and permits the user convenient interaction with data and results if necessary.
- a spot can be considered to be a three-dimensional mountain peak with peak height corresponding to maximum spot density, i.e., quantity of protein, surrounded by neighboring peaks of varying width and amplitude.
- the first approach deals with simple segmentation and contour following: the second approach deals with modeling. Of the two approaches, only modeling can adequately resolve overlapping spots.
- the corrected data now are searched for a maximum value, the tacit assumption being that this value must be at the approximate center of a peak. Once the peak center has been found, inflection points of the peak are sought by scanning the data in all four raster directions away from the maximum found.
- the average height of the four inflection points relative to the peak height is compared to that expected for a true gaussian. If a serious discrepancy is noted, the peak is assumed to be subject to interference from a neighboring peak and a Gaussian estimate is made from the inflection point value and maximum values obtained. Inflection points not lying in a plane, or an inflection point plane that is significantly tilted, are also indications that an estimate is necessary. If, on the other hand, the inflection points are those expected for a single isolated gaussian, a weighted least-squares Gaussian fit is performed over the two-dimensional region bounded by the inflection points in order to obtain the Gaussian parameters.
- the Gaussian parameters are then used to create a gaussian that is subtracted from the surface.
- the data are searched again for a maximum.
- the previously found maximum is, of course, no longer present so a new peak is located. This procedure is continued until the maximum found is below a preset threshold level.
- the first gaussian is regenerated from its parameters, which have been stored in a list.
- This gaussian is then added to the surface. Inflection points are tested as before, and the gaussian is either fitted or estimated, then subtracted again. This time, however, the gaussian is found to be less influenced by neighboring peaks, the largest ones have already been removed, at least to a good approximation.
- the fit or estimate is thus more likely to be accurate.
- one is able to obtain good fits while treating only one gaussian at a time.
- the process is repeated for all gaussians already on the parameter list. After the last gaussian is processed, additional image maxima are determined. Additional gaussians are thus found and subtracted until a lower threshold is reached. Three such passes are made through the list. Each time, the threshold is lowered according to a predetermined sequence of values. After the third pass, a fourth and final pass is made in which estimation is not allowed and a least squares fit is forced for all gaussians.
- This invention directly addresses the problems of accuracy, time efficiency and expense by an improved spot quantitation method and system.
- spatially integrated intensities of individual spots are quantitated.
- the spots are contained in a multiple spot image defined by a discrete pixel-by-pixel representation of the intensities, which establishes a first sense, of the spots. Quantitation of these spots is accomplished by, (a) searching the image for the pixel representing the greatest intensity deviation in the first sense from a reference intensity level, (b) constructing a mathematical three-dimensional model of the spot containing such pixel.
- step (c) compensating the image by subtracting the mathematical model therefrom leaving possible overcompensated regions in the image, which regions together constitute a reduction volume, (d) adjusting the dimensions of the model by the amount necessary to give the model the same volume as the volume removed from the image in step (c) less the reduction volume, (e) restoring all such overcompensated regions to the reference intensity level. (f) quantitating the spot from the adjusted model and (g) repeating steps (a) through (f) for successive pixels each having a lower intensity deviation from the reference level until the image is of substantially constant intensity.
- the model of step (b) is partially defined by searching the image in four orthogonal directions from the greatest deviation pixel to ascertain the extent of the spot along each direction. Models formed in step (b) of adjacent pixels are combined to form composite models of each individual spot.
- the method includes the additional steps of quantitating the spot to obtain its center of mass, adjusting the location of the model for the step (a) pixel according to the alteration of the center of mass caused by the removal of the reduction volume.
- the invention is also a system for quantitating individual spots contained in a multiple spot image defined by a discrete pixel-by-pixel representation of the intensity of the spots, the system including a memory for storing the pixels, means for determining that pixel representing the greatest intensity deviation from a reference intensity level, and means for constructing a mathematical three-dimensional model of the spot containing such pixel.
- This system is improved in accordance with this invention by compensating the image by subtracting the mathematical model therefrom leaving possible overcompensated regions in the stored image which regions together constitute a reduction volume, adjusting the dimensions of the model by the amount necessary to give the model the same volume as the volume removed from the image in step (c) less the reduction volume, restoring all such overcompensated regions to the reference intensity level and for quantitating the spot from the adjusted model.
- This invention directly addresses the problems of accuracy, time efficiency and expense by an improved spot quantitation method and system.
- spatially integrated intensities of individual spots are quantitated.
- the spots are contained in a multiple spot image defined by a discrete pixel-by-pixel representation of the intensities, which establishes a first sense, of the spots.
- Quantitation of these spots is accomplished by, (a) searching the image for the pixel representing the greatest intensity deviation in the first sense from a reference intensity level, (b) constructing a mathematical three-dimensional model of the spot containing such pixel. (c) compensating the image by subtracting the mathematical model therefrom leaving possible overcompensated regions in the image, which regions together constitute a reduction volume.
- step (d) adjusting the dimensions of the model by the amount necessary to give the model the same volume as the volume removed from the image in step (c) less the reduction volume.
- step (e) restoring all such overcompensated regions to the reference intensity level.
- step (f) quantitating the spot from the adjusted model and (g) repeating steps (a) through (f) for successive pixels each having a lower intensity deviation from the reference level until the image is of substantially constant intensity.
- the model of step (b) is partially defined by searching the image in four orthogonal directions from the greatest deviation pixel to ascertain the extent of the spot along each direction. Models formed in step (b) of adjacent pixels are combined to form composite models of each individual spot.
- the method includes the additional steps of quantitating the spot to obtain its center of mass. adjusting the location of the model for the step (a) pixel according to the alteration of the center of mass caused by the removal of the reduction volume.
- the invention is also a system for quantitating individual spots contained in a multiple spot image defined by a discrete pixel-by-pixel representation of the intensity of the spots, the system including a memory for storing the pixels, means for determining that pixel representing the greatest intensity deviation from a reference intensity level, and means for constructing a mathematical three-dimensional model of the spot containing such pixel.
- This system is improved in accordance with this invention by compensating the image by subtracting the mathematical model therefrom leaving possible overcompensated regions in the stored image which regions together constitute a reduction volume, adjusting the dimensions of the model by the amount necessary to give the model the same volume as the volume removed from the image in step (c) less the reduction volume, restoring all such overcompensated regions to the reference intensity level and for quantitating the spot from the adjusted model.
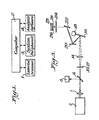
- FIG. 1 there is seen a system that may be used to quantitate spots used in performing the method of this invention.
- the system is described in one of its applications, i.e., quantitating the spots of an electrophoresis gel. It is to be understood, however, that the method and system are equally appliable to quantitating other spot patterns as well, i.e., those encountered in astronomy, as well as in chemistry and biology.
- the method and system of this invention relate to the quantitation of the spots in a spot image, in order to provide a complete disclose of an operative system, a gel scanning system that has been successfully built and operated to scan a spot image and provide a pixel-by-pixel representation thereof is described.
- the system includes a laser gel scanner module 1, a computer module 2, system peripherals 3, and analysis software 4.
- the laser gel scanner 1 digitizes, with high resolution, the two-dimensional optical-density information in 2-D electrophoresis gels.
- the computer system 2 serves many functions. It transmits the scan parameters to the laser scanner's control circuitry. It assists in the transfer of data from the scanner to an image memory. It processes the image data according to specially designed algorithms. And, it helps to effect data movement from various storage systems to a video display device.
- the system peripherals include a CRT terminal. color monitor, printer and floppy disk drive and hard disk drive.
- the method of this invention which overcomes many of the difficulties experienced in the prior art. is a one-pass method that treats each spot or peak once. After each spot has been modeled and the model subtracted from the image, the resultant model parameters are stored and not accessed again until it is time to combine the individual resultant models into spot structures.
- the method begins by loading the individual array of elements or a pixels defining the image from the scanner, disk, or other storage medium into the image random access memory 110 (Fig. 6).
- the image is then pre-processed using known techniques, such as described by Lutin et al., so as to render the background substantially zero, and the volumes to be measured as positive quantities.
- the value of a positive cutoff level is entered. This level represents a surface close to a background reference level of the image. When all of the image, outside the region between this level and the reference level has been modeled, the initial modeling step is completed. It is to be understood that, in its most general form, the method of this invention can deal with both positive and negative images, and with varying backgrounds.
- the optical density samples of the image i.e., pixels will be represented by integer values of z(x.y) where x and y are Cartesian coordinates in the image plane represented as integers.
- the image is searched, starting at the peak pixel position in the four principal orthogonal Cartesian coordinate directions to ascertain the extent of the spot. This extent may differ in all four directions.
- an appropriate model is generated and subtracted from the data. Because of the differing extent measurements, the most accurate model needs to be asymmetric. Because the model is approximate, over-compensation for the image data may occur in certain regions. i.e.. the model value may exceed the surface z(x.y) at certain pixels, resulting in a negative residual in the image array.
- model parameters that are to be stored on a parameter list are to accurately represent the volume under the original surface z(x,y), they must be adjusted so that the model volume equals the volume under the positive z(x,y) that was removed. Model extent and/or position parameters are adjusted accordingly.
- model volume center coordinates and widths are combined to form single spot composite structures that are characterized by like parameters. It is a property of the analogy with mechanics, i.e., the use of center of mass, and moments of inertia, that allows the combination of all these parameters in a way that results in values that are the same as one would obtain if one computed the parameters directly by their definition from the spot image data alone. The latter technique, however, only works for isolated spots. This method and system has the significant advantage of being able to resolve overlapping spots.
- the method and apparatus of the invention can be used in the quantitation of the spot-like representations of many types such as thin layer chromatograms, radio maps of the sky, or astronomical plates, it is herein described as being used for the quantitation of spots on.2-D electrophoresis gels.
- the gel optical densities are digitized by the scanner (as will be described) to a desired precision (typically 1 part in 256, ie., 8-Bit encoding is adequate) over an image format of selected density.
- a 1024 x 1024 pixel array is satisfactory, although higher densities such as 2048 x 2048 pixel array may be used merely by the addition of memory.
- the digital data are corrected to render the spots as positive-going peaks superimposed on a zero-level background.
- the scanned, corrected spots are stored as an array in a random access memory in a manner that is well known in the art.
- a cutoff value is then either read from disk or entered by an operator.
- the cutoff value is chosen to represent a positive value or surface close to zero such that when all volume outside the region between this surface and zero is accounted for by models represented on the parameter list, the gel is considered to be adequately quantitated.
- the mathematical model used may be any model that represents a localized, bounded volume. An asymmetric 4-component gaussian is preferred, although certain other asymmetric models should probably work nearly as well.
- the inflection points of the data are especially convenient as descriptors of extent of each spot. This arises from the fact that, for a Gaussian function. each inflection point occurs precisely one standard deviation from the peak. Thus we obtain four inflection points and generate the mathematical model as will be described.
- the model is subtracted from the image and the Gaussian parameters are adjusted to account for any negative-going overcompensated regions of the image. This, too, will be described in detail under a following heading.
- the negative portions of the image are zeroed, and the max table is updated so that it will contain the most current pixel maxima in the image rows affected by the above described modeling.
- the parameters of the model, adjusted for negative-going regions are placed on a list that may reside on a disk.
- the max table is then searched for the next maximum. As noted previously, the algorithm terminates when the maximum found is below cutoff.
- the various individual models represented by the parameters stored on the parameter list may be combined in appropriate groups representing single spot structures.
- the method by which these models are combined is generally that described in the prior art by Jansson et al. with several improvements. It is a unique property of the Gaussian parameters V A , ⁇ x , ⁇ y , i. and y that they may be easily combined in a sensible way to form overall spot volumes, width parameters and center-of-mass coordinates.
- the virtue of this technique lies in its efficiency and applicability to overlapping spots. Its utility stems from the frequent occurrence of such overlapping spots, and the lack of any other efficient method to sensibly allocate volumes between the spots, accurately determine their positions, and accurately determine their width parameters.
- the speed can be further improved by eliminating the calculation for ⁇ x and ⁇ y .
- the improvement is chiefly a result of eliminating a summation employed in computing I Rx and I RY .
- the principal utility of the parameters obtained is in the recognition of spots by virtue of the shape information thus conveyed. If the analyst is only interested in quantitation of integrated spot density, the faster computation method is preferable.
- appendix 1 there is set forth FORTRAN and assembly language programs and subroutines that together constitute the details of the faster method.
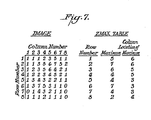
- the table is initialized by a complete search of the image ( Figure 2, Step C) before any model subtractions have been done. Each time a new maximum value is needed, the image maximum is found merely by seeking the largest value in the maximum column of the max table. The numbers adjacent to the largest value in the max table specify the row and column containing the maximum pixel. For a 1024 x 1024 image, only 1024 values in the max table need to be checked, a reduction by a factor of 1024 times in the computation needed for seeking the maximum.
- the max table In order that the max table accurately represent the values in the image, it must be updated every time the image values are altered, that is, every time a mathematical model such as a gaussian is subtracted in Step H. new maximum values and column location values must be placed in the max table in step J for all rows affected in step H.
- Step D the closest inflection points to this maximum in each of the four principal orthogonal coordinate directions are sought: that is, the first inflection points in the +x. -x. +y, and -y directions.
- the determination of inflection points is usually done by finding the pixel location where the second partial derivative vanishes. This approach is similar to that taken in the prior art.
- a finite difference technique is appropriate. Because of the well known propensity for differentiation to emphasize the effects of highfrequency noise in the data, the technique is prone to inaccuracies resulting in the establishment of erroneous locations for the inflection points.
- each pixel along one of the four principal coordinate directions is replaced (for the purpose of inflection-point finding only) by the average of itself and its 6 closest neighbors along a line perpendicular to the principal direction in which the inflection point is sought. This too is described in the prior art. Even this averaging is not sufficient, however, so the prior art stresses the need to filter the entire image before analysis by convolving it with a smoothing function. Unfortunately, these techniques taught by Lutin et al., are a time-consuming procedure.
- inflection points calculated as above do not generally occur at exact pixel locations. i.e., integer values of distance from the maximum point. Therefore, the non-integer inflection points distances used for subsequent modeling are rounded up to the next largest integer.
- this invention employs an asymmetric volume model having four characteristic spatial dimensions.
- each cartesian quadrant of the Gaussian function is identical to a quadrant of the function described in the prior art (Lutin, et al.). If ⁇ x+ . ⁇ x- ⁇ y+ ' and ⁇ y- are the four principal inflection-point distances from the maximum pixel as noted elsewhere, then the model in this invention is, for the first quadrant, in which both x - x and y - y are positive.
- the second quadrant in which x - x o is negative and y - y o is positive.
- the third quadrant in which x - x and y - y o. are negative.
- the fourth quadrant in which x - x o is positive and y - y o is negative.
- z M (x,y) is the value of the model at the pixel located at the gel plane Cartesian coordinates x and y, x o and y0 are the coordinates of the center of the model (which is chosen as the coordinates of the maximum pixel) and A is the amplitude of the model, which is chosen as the value of the maximum pixel.
- the volume of the model is easily obtained by summing the volumes of the four components which. in turn, are easily obtained by either direct integration or from a table of integrals.
- the model falls to a relatively small value within a relatively short distance from its center coordinates of (x o , y o ), the model is evaluated and subtracted from the image only within a rectangle in which this operation would cause significant alteration of the image. Therefore, computation time is greatly reduced as compared with that which would be required to evaluate the model over the entire image plane.
- the boundaries of the rectangle may be usefully specified as the vertical straight lines located at and the horizontal straight lines located at
- the model is computed with the aid of look-up tables, thereby eliminating repeated computation of the exponential expression for each pixel in each model.
- the tables are established before beginning the analysis.
- the two principal computations that are time-consuming in generating the model are the exponential function and the square operation, so two tables are employed.
- the total volume between the negative regions and the zero reference plane V R may be compensated by forming the sum
- the true volume of the positive image data removed by the subtraction process (hence the true volume of protein removed by modeling, in the case of two-D gel electrophoresis) is easily obtained as the adjusted volume.
- the amplitude A may be adjusted so that a 4-compound gaussian having widths ⁇ x+ , ⁇ x- . ⁇ y+ , o and adjusted amplitude would have the adjusted volume V A .
- all the parameters, including both A and a's might be reduced to achieve the same end. Two questions are thus presented: (1) What should be considered to be the center of the adjusted model? and (2) How does one characterize it's width in a simple way such that when multiple models are later combined into single spot entities, the width parameters retain a sensible meaning?
- this spot may be considered as if it had mass, of a uniform density within the volume defined by a local peak of z(x,y).
- z(x,y) is taken to be the image after subtraction of the model.
- the variances of the adjusted model are easily obtained by using the parallel-axis theorem to combine the moments of inertia I x , I of the unad- justed four-component gaussian and the moments of inertia I Ry , I Rx of the negative region.
- I CMx and I CMy are given by I x and I y are given by I Rx and I Ry are given by and x CM and y CM , which locate the adjusted model's center of mass, are given by
- z(x,y) is understood to be the image after subtraction of the model, and the summation is taken to cover the entire region specified by integer values of x and y within the previously described rectangle. Next, as described previously the max table is updated.
- the various single models represented by the parameters stored on the parameter list may be combined in appropriate groups representing single spot structures. It is the unique property of the parameters V A , ⁇ x , ⁇ y , i and y that they too may be easily combined in a sensible way to form overall spot volumes, width parameters, and center of mass coordinates.
- the prior art Jansson et al. describes the preferred human-interactive peak-combining method of selecting gaussians to be included in the composite model for each spot.
- This method employs a digital-refreshed-raster display to represent the models as colored crosses superimposed on the spot pattern image. As the operator selects models to be incorporated into each spot composite, the colors of the crosses are altered to show which model has been selected.
- the parameters for the spot comprising the N adjusted gaussians may then be obtained as follows.
- the volume of the spot is given by
- the center of mass of the spot is given by and respectively.
- the x and y standard deviations of the spot are given by and respectively.
- the results obtained by these formulas are the same as those that would have been obtained by computing the volumes, center of mass coordinates, and standard deviations directly from the spot data, for one isolated spot, by use of their respective definitions.
- spot parameters result from contributions over the entire spot. They are measures of volume, location, and shape, respectively, that draw upon every optical density measurement in the spot. and are, therefore, truly representative. Because they are integral measures, they exhibit the precision and noise-minimizing properties that are characteristic of averaging processes.
- the laser gel scanner that has been used successfully to provide the image data processed by this invention will be described in three parts: The beam focusing and directing optics (Figure 3), the gel scanner mechanical assembly ( Figure 4): and the gel scanner electronics and data interface system ( Figure 5). It is to be understood, however, that any suitable image or radiation scanning system can be used.
- the subject invention is concerned only with the processing of spot image data to quantitate the spots.
- the laser scanner uses a low powered He-Ne laser 5 as the source of a focused laser beam 29 that is swept rapidly in a transverse direction relative to the line of movement of a gel such that the focal line is adjacent to, but not coincidental with, the gel surface. This is done in order to obtain an optimal beam spot size.
- the laser 5 typically a 5 nW He-Ne source, produces a substantially parallel beam 29 which is focused by lens 7 to a point between respective first and second folding mirrors 10, 12.
- a beam splitter 6 is interposed between lens 7 and first folding mirror 10 to direct a portion of the beam to a reference photodiode 8, which in turn, generates a reference signal input for the optical density analyzer.
- the laser beam after being reflected from the second folding mirror 12, passes to a second lens 14, which in turn, brings the beam to a focus at a point near, but not necessarily on, the gel plane 24.
- a scan mirror 16. driven by galvo (galvanometer) scanner 18. scans the focused beam across a third and fourth folding mirrors 20, 22 in series and thence to the long-line photodiode sensor 28, typically a 9" x 1/4" Schottly photodiode manufactured by United Detector Technology.
- the third and fourth folding mirrors 20. 22 have been positioned after the scan mirror 1 6 to lengthen the scan radius sufficiently to maintain (within 2.5 degrees) the perpendicularity of the scan- beam to the gel plane 24 throughout the extent of each scan. This is done so as to avoid the effects of apparent changes in optical density in the plane 24 as the scan is generated.
- a strip of opal glass 26 is positioned adjacent to the photosensitive surface to diffuse the light, thereby averaging and minimizing the effect of any nonuniformities that may be present.
- optical interference may corrupt the data due to the appearance of fringes superimposed on the image.
- the interference arises because the direct beam and the beam internally reflected in the plate and/or gel are coaxial when the beam is perpendicular.
- This interference problem is avoided by adjusting the geometry of the beam deflection so that the beam is not perpendicular at any beam position during the scan. This condition is obtained by inclining the beam slightly in the plane that is perpendicular to both the gel plane and the plane that is defined by the beam sweep.
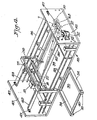
- the optics depicted in Figure 3 are shown in place in the pictorial illustration of Figure 4.
- the laser gel scanner has been designed specifically to digitize the two-dimensional optical density information in 2-D gels. However, it will digitize any substantially transparent object, possibly containing absorbing or light scattering regions, provided that the object dimensionally fits on a gel stage 30. Wet and dry gels as well as autoradiograms may be scanned. The maximum gel size is 200 x 240mm.
- the gel stage 30 is a rectangular-shaped frame that is designed to accomo- date a glass gel holder, typically 200 x 240 x 9mm., and transport it in the gel plane through the scan zone.
- a glass gel holder with a raised lip (not shown) around the edge is typically used to confine the liquid.
- a glass cover plate (not shown) is also often used to flatten the gel surface.
- the gel stage 30 is designed to be introduced into the scanner assembly 39 which includes a base plate 41 and a pair of end plates 43 supported by rods 45. The various components of the optical system are located at various points on this assembly to form the folded beam, compact scanning system.
- the scan zone is defined as that region in the gel plane that lies between the long-line photo sensor 28 and fourth folding mirror 22.
- the gel stage 30 comprises two apertured aluminum support plates 34. 36 that are connected by aluminum support tubes 38, 40.
- the stage 30 is mounted to slide along two steel support rods 42. 44 which define the gel plane so that the stage can be drawn through the scan zone by a continous pulley 47, mounted pull string 46, the ends 6f which are secured to the stage at opposing attachment points 48.
- Pull string 46 is typically a high tensile-strength stainless-steel cable to minimize effects of both thermal and mechanical stresses on its elongation.
- Stage-position detectors 50 comprise pairs of LEDs and photosensors to signal when the stage is in either the "begin-scan". or "end of scan" positions.
- Stage motor 32 typically a 1 RPM instrument gear motor with a constant speed and reversible field. is attached to the exterior surface of one of the two end plates 43 for the scanner assembly and turns drive capstan 52 which is keyed to the motor shaft.
- Pull string 46 is tightly wrapped around capstan 52, at least four times, for positive traction so that as the capstan turns, the stage translates smoothly through the scan zone in the signalled direction, at a constant speed. Simultaneously, it is transversely scanned by the scanning beam which passes through the gel to the diode sensor 28.
- FIGS. 5A and 5B are block diagrams of the gel scanner and data interface system.
- the laser gel scanner system 1 interfaces the computer 2 via a scanner interface 106 which in turn interfaces an LSI-11 Bus 108. All communication to the scanner system is conducted through the scanner interface 106.
- the computer controls the stage motor control 62, a 12-Bit programmable counter 72, an 8-Bit programmable counter 74, a programmable gain circuit 88, and a programmable offset circuit 86. These functions are all interrelated such that the laser scanner precisely scans the gel in a fashion that enables the two-dimensional optical density information to be digitized for use during analysis by the software.
- zero-crossings of the stage motor 32 supply voltage waveform are used to toggle a 6kHz phase-locked loop oscillator 70 which, in turn, clocks a row-spacing 12-Bit programmable counter 72.
- the synchronized periodic start-scan signals produced by the 12-Bit counter 72 are spaced according to instructions programmed by the operator via the scanner interface 106 to establish row spacing, and the separation between successive scan lines.
- start scan signal does the following:
- the last circuit to be described is the OD (Optical Density) analyzer.
- the principal inputs to this circuit are the reference signal and the analytical signal which are obtained from the action of the galvo deflector 18 passing the scanning laser beam through the laser scanner optics 58 through the gel 60 onto the long-line photodector 28.
- programmable gain 88 and programmable offset 86 parameters are input to this circuit from the computer via the scanner interface 106. These parameters are used to optimize the digitization of pixel OD values.
- the reference and analytical signals are separately amplified logarithmically via the operational amplifier 82. 84 in the reference line and 90 , 94 in the analytical line. These signals are then summed with the programmed offset value at a summing junction where the log (A/R) result is formed.
- Manual controls are provided for the operator to make zero- adjust corrections 96 to the analytical signal prior to its appearance at the summing junction. The settings are made based on OD values existing at the outset of each scan in the calibration series.
- the programmable-gain circuit 88 is configured to enable the operator to manually select either high or low OD ranges and make full-scale adjustments for them upon prompting by the computer should the operator know ahead of time what high and low OD limits are needed for the gel to be scanned. This feature is provided in addition to its normal function of automatically applying gain values to the ratio signals present at the summing junction using values transmitted to it from the scanner interface 106.
- the A/D sample/hold circuit 98 samples the scan signals at a programmed rate, and transmits the held voltages directly to the A/D converter 100 for processing into 8-Bit format.
- the output data terminals of the A/D converter are connected to a set of buffer registers for storing each scan's data in 12-Bit format.
- the buffer register output terminals are in turn connected to a lookup table memory 102, which communicates the digitized OD values to the scanner interface 106, the OD values are represented by eight data bits.
- the A/D converter 100 responds to a convert signal that is generated by the scan-length decoder 80 at the end of each scan. Upon its receipt, the A/D converter 100 loads the buffer registers and generates end of convert (E O C) signal pulses to the A/D sample/ hold 98 and strobe-generator circuits 104 to simultaneously load new data into the A/D converter 100 while the preceeding scan's data is entered onto the computer via the scanner interface 106.
- E O C end of convert
- a reference position indicator 66 is positioned at one of the scan extremes to sense the beginning of each scan needed to initiate the operation of the scanner/stage motor controller 62.
- a split photodector 50 has been found useful for this purpose by generating a sharply rising trigger pulse that contributes substantially to the precision of scan direction displacement (column) measurements.
- the last module which will be discussed in detail is the computer system 2 and 3 ( Figure 1) used with the gel scanner. Illustrated in Figure 6 is a detailed block diagram of the computer 2, the interface modules 106. 114, 116. 118. 120 its peripherals and memory module 110. 112.
- the system's peripherals includes blocks 124, 126, 128, 130. the analysis software 4 and the computer memory modules 110, 112.
- the LSI-11 Bus 108 serves as the main communication link to all the major system components.
- the computer serves many functions, several of which are specific to 2-D gel analysis. It transmits the scan parameters to the scanner interface 106 which in turn passes these parameters to the gel scanner 1. It both receives and transmits data from the various peripheral interfaces 114. 116, 118, 120 to the associated system peripherals 124. 126. 128. 130 which are directly accessible by the operator. It processes the 2-D gel data using the analysis software 4 that resides in the main Random-Access Memory 110 and interacts with the image memory 112 during system operation. In addition, the computer controls the movement of data to and from the major components of the system via the LSI-11 data Bus 108. Each of these major components will be described in more detail below.
- the computer 2 is a DEC (Digital Equipment Corporation) LSI-11/23 microcomputer with 256 K bytes of main memory.
- the operating system is DEC's single- user system, RT-11 version 4.
- the computer uses the Random-Access Memory 110 to store both programs and data.
- the LSI-11 Bus 108 serves as the main communication link to all the major system components.
- the image-memory system 112 has been designed to store over four million 8-Bit samples per circuit board with integrated-circuit memories now readily available.
- the amount of data generated by the laser scanner system 1 is relatively large, at present typically over one million samples. These data must be stored in a place where access to them is random and rapid.
- the image memory 112 provides this function as follows.
- the image memory 112 which, consists of commercially available components, utilizes a 2048 word- wide address-window of the DEC LSI-11/23 computer 2 located in the I/O portion of the memory physical address space as the location where the scanned image data are accessed. This section of the I/O memory addresses is used to access a single horizontal line of pixels, all of which are contained in the image memory 112.
- the horizontal line appearing in the 2048 word window is specified by a number in a single register in a neighboring area of the I/O address region. Different lines may be made to appear in the 2048 word window by changing the horizontal line pointer in this register.
- the system peripherals 3 are detailed in Figure 6 as items 124. 126. 128 and 130.
- An interface module 114. 116, 118. and 120 is associated with each peripheral as a means for providing the correct communications link between the computer Bus 108 and the operator.
- the CRT terminal 124 is a conventional terminal used by the operator to control the operation of the laser gel scanner instrument.
- the interface associated with the terminal is an RS-232 serial interface 114 which is linked directly to the LSI-11 Bus 108.
- the RGB monitor 126 is a color display monitor that accepts an RS-170 video signal from the display memory and control interface 116 via the LSI-11 Bus 108.
- the display memory and control interface 116 stores a portion of the gel image which is continuously displayed on the RGB monitor 126.
- the display memory array is arranged as 480 rows with 512 picture elements (pixels) per row. Both the RGB monitor 126 and the display memory and control interface are commercially available.
- the printer 128 and its serial interface 118 both of which are commercially available, are used to generate hard copy information generated as a result of the gel analysis.
- a Winchester DSD 880 Floppy Disk drive 130. a disk interface 120 and the Winchester 30 megabyte disk 122 in combination provide the system with an adequate amount of data mass-storage capability.
- the method and apparatus of this invention are thus seen to provide a rapid, efficient means of resolving and quantitating image spot information from whatever source derived.
Landscapes
- Life Sciences & Earth Sciences (AREA)
- Health & Medical Sciences (AREA)
- Chemical & Material Sciences (AREA)
- Physics & Mathematics (AREA)
- Molecular Biology (AREA)
- Analytical Chemistry (AREA)
- Biochemistry (AREA)
- General Health & Medical Sciences (AREA)
- General Physics & Mathematics (AREA)
- Immunology (AREA)
- Pathology (AREA)
- Chemical Kinetics & Catalysis (AREA)
- Electrochemistry (AREA)
- Image Processing (AREA)
- Investigating, Analyzing Materials By Fluorescence Or Luminescence (AREA)
Applications Claiming Priority (4)
| Application Number | Priority Date | Filing Date | Title |
|---|---|---|---|
| US574712 | 1984-01-27 | ||
| US06/574,712 US4638456A (en) | 1984-01-27 | 1984-01-27 | Spot quantitation |
| US65701384A | 1984-10-02 | 1984-10-02 | |
| US657013 | 1991-02-19 |
Publications (2)
| Publication Number | Publication Date |
|---|---|
| EP0151974A2 true EP0151974A2 (fr) | 1985-08-21 |
| EP0151974A3 EP0151974A3 (fr) | 1987-05-06 |
Family
ID=27076475
Family Applications (1)
| Application Number | Title | Priority Date | Filing Date |
|---|---|---|---|
| EP85100654A Withdrawn EP0151974A3 (fr) | 1984-01-27 | 1985-01-23 | Quantification de spots |
Country Status (4)
| Country | Link |
|---|---|
| EP (1) | EP0151974A3 (fr) |
| CA (1) | CA1231784A (fr) |
| DK (1) | DK36685A (fr) |
| GR (1) | GR850221B (fr) |
Cited By (3)
| Publication number | Priority date | Publication date | Assignee | Title |
|---|---|---|---|---|
| EP0220732A3 (en) * | 1985-10-30 | 1989-07-19 | Hitachi, Ltd. | Method of and apparatus for automatically reading band arrayal pattern |
| EP0746945A4 (fr) * | 1993-02-04 | 1997-08-27 | Res Dev Foundation | Densitometre video permettant de determiner la composition des couleurs |
| EP0893783A1 (fr) * | 1997-07-24 | 1999-01-27 | Alcatel | Procédé de filtrage d'images numériques par convolution avec un noyau déterminé par la méthode de Savitzky et Golay |
Families Citing this family (2)
| Publication number | Priority date | Publication date | Assignee | Title |
|---|---|---|---|---|
| CN112528514B (zh) * | 2020-12-21 | 2024-02-23 | 北京机电工程研究所 | 一种高精度亚像素星斑重塑方法及装置 |
| CN114252414B (zh) * | 2021-11-29 | 2024-07-30 | 歌尔股份有限公司 | 检验胶路状态的装置及其检验方法 |
Family Cites Families (6)
| Publication number | Priority date | Publication date | Assignee | Title |
|---|---|---|---|---|
| US3908078A (en) * | 1971-10-06 | 1975-09-23 | Object Recognition Systems | Method and apparatus for digital recognition of objects particularly biological materials |
| JPS5661650A (en) * | 1979-10-24 | 1981-05-27 | Omron Tateisi Electronics Co | Analyzing device of cell |
| JPS5776662A (en) * | 1980-10-31 | 1982-05-13 | Toshiba Corp | Erasure system for picture information |
| US4481509A (en) * | 1980-12-18 | 1984-11-06 | Rca Corporation | Raster-scanned display system for digitally-encoded graphics |
| ATE41833T1 (de) * | 1981-01-05 | 1989-04-15 | Image Processing Tech | Verfahren und geraet zur umwandlung eines musters in eine binaere form. |
| JPS59106079A (ja) * | 1982-12-10 | 1984-06-19 | Omron Tateisi Electronics Co | 図形照合装置の二値化装置 |
-
1985
- 1985-01-23 EP EP85100654A patent/EP0151974A3/fr not_active Withdrawn
- 1985-01-24 CA CA000472806A patent/CA1231784A/fr not_active Expired
- 1985-01-25 GR GR850221A patent/GR850221B/el active IP Right Revival
- 1985-01-25 DK DK36685A patent/DK36685A/da not_active Application Discontinuation
Cited By (4)
| Publication number | Priority date | Publication date | Assignee | Title |
|---|---|---|---|---|
| EP0220732A3 (en) * | 1985-10-30 | 1989-07-19 | Hitachi, Ltd. | Method of and apparatus for automatically reading band arrayal pattern |
| EP0746945A4 (fr) * | 1993-02-04 | 1997-08-27 | Res Dev Foundation | Densitometre video permettant de determiner la composition des couleurs |
| EP0893783A1 (fr) * | 1997-07-24 | 1999-01-27 | Alcatel | Procédé de filtrage d'images numériques par convolution avec un noyau déterminé par la méthode de Savitzky et Golay |
| FR2766598A1 (fr) * | 1997-07-24 | 1999-01-29 | Alsthom Cge Alcatel | Procede de filtrage d'images numeriques par convolution avec un noyau determine par la methode de savitzky et golay |
Also Published As
| Publication number | Publication date |
|---|---|
| GR850221B (fr) | 1985-05-27 |
| DK36685D0 (da) | 1985-01-25 |
| DK36685A (da) | 1985-07-28 |
| EP0151974A3 (fr) | 1987-05-06 |
| CA1231784A (fr) | 1988-01-19 |
Similar Documents
| Publication | Publication Date | Title |
|---|---|---|
| US5420628A (en) | Video densitometer with determination of color composition | |
| Smolen | Image analytic techniques for quantification of immunohistochemical staining in the nervous system | |
| US4618937A (en) | Spot quantitation | |
| EP0401077A2 (fr) | Méthode et appareil pour l'élimination des bruits parasites d'une image digitalisée | |
| US4638456A (en) | Spot quantitation | |
| US5325217A (en) | Color separation scanner | |
| US4271389A (en) | Method and apparatus for physiologic facsimile imaging of biologic targets without multipath contamination using remote microwave interrogation | |
| US20020027564A1 (en) | Gel electrophoresis image warping | |
| US3938892A (en) | Electronic optical transfer function analyzer | |
| EP0151974A2 (fr) | Quantification de spots | |
| EP0152786A2 (fr) | Quantification de spots | |
| KR20000053124A (ko) | 평면 물체의 시각적 균일성 정량화 방법 | |
| Aycock et al. | Television-based densitometric analysis of proteins separated by two-dimensional gel electrophoresis | |
| Vincens et al. | HERMeS: A second generation approach to the automatic analysis of two‐dimensional electrophoresis gels Part I: Data acquisition | |
| US5194949A (en) | Video densitometer | |
| EP0437968B1 (fr) | Densitomètre vidéo | |
| Haselgrove et al. | A rapid, inexpensive, quantitative, general-purpose densitometer and its application to one-dimensional gel electrophoretograms | |
| Hruschka et al. | Computerized analysis of two-dimensional electrophoretograms | |
| Jansson et al. | Implementation and application of a method to quantitate 2‐D gel electrophoresis patterns | |
| HK1006747B (en) | Video densitometer | |
| US4244797A (en) | Quantitative protein analysis by immunodiffusion | |
| AU685087B2 (en) | Video densitometer with determination of color composition | |
| EP0288132B1 (fr) | Système pour numériser la trajectoire d'un point cible d'un faisceau en mouvement | |
| CN117213367B (zh) | 线光谱共聚焦高精度标定方法、系统、设备及存储介质 | |
| Ledley et al. | SPIDAC: specimen input to digital automatic computer |
Legal Events
| Date | Code | Title | Description |
|---|---|---|---|
| PUAI | Public reference made under article 153(3) epc to a published international application that has entered the european phase |
Free format text: ORIGINAL CODE: 0009012 |
|
| AK | Designated contracting states |
Designated state(s): BE DE FR GB IT LU NL |
|
| PUAL | Search report despatched |
Free format text: ORIGINAL CODE: 0009013 |
|
| AK | Designated contracting states |
Kind code of ref document: A3 Designated state(s): BE DE FR GB IT LU NL |
|
| 17P | Request for examination filed |
Effective date: 19870423 |
|
| 17Q | First examination report despatched |
Effective date: 19890823 |
|
| STAA | Information on the status of an ep patent application or granted ep patent |
Free format text: STATUS: THE APPLICATION IS DEEMED TO BE WITHDRAWN |
|
| 18D | Application deemed to be withdrawn |
Effective date: 19900320 |
|
| RIN1 | Information on inventor provided before grant (corrected) |
Inventor name: ELIAS, JOHN GREER Inventor name: JANSSON, PETER ALLAN |