EP0186732B1 - Appareil ultrasonique pour la détermination du comportement du flux sanguin périphérique - Google Patents
Appareil ultrasonique pour la détermination du comportement du flux sanguin périphérique Download PDFInfo
- Publication number
- EP0186732B1 EP0186732B1 EP85111379A EP85111379A EP0186732B1 EP 0186732 B1 EP0186732 B1 EP 0186732B1 EP 85111379 A EP85111379 A EP 85111379A EP 85111379 A EP85111379 A EP 85111379A EP 0186732 B1 EP0186732 B1 EP 0186732B1
- Authority
- EP
- European Patent Office
- Prior art keywords
- ultrasonic
- frequency
- signal
- output
- memory
- Prior art date
- Legal status (The legal status is an assumption and is not a legal conclusion. Google has not performed a legal analysis and makes no representation as to the accuracy of the status listed.)
- Expired - Lifetime
Links
- 230000017531 blood circulation Effects 0.000 title claims description 16
- 210000005259 peripheral blood Anatomy 0.000 title description 2
- 239000011886 peripheral blood Substances 0.000 title description 2
- 210000003743 erythrocyte Anatomy 0.000 claims abstract description 29
- 230000002123 temporal effect Effects 0.000 claims abstract description 11
- 238000009826 distribution Methods 0.000 claims description 54
- 230000003595 spectral effect Effects 0.000 claims description 49
- 230000000694 effects Effects 0.000 claims description 18
- 239000000523 sample Substances 0.000 claims description 16
- 230000000747 cardiac effect Effects 0.000 claims description 14
- 238000001228 spectrum Methods 0.000 claims description 13
- 238000003745 diagnosis Methods 0.000 claims description 12
- 238000001914 filtration Methods 0.000 claims description 8
- 230000001360 synchronised effect Effects 0.000 claims description 8
- 230000003111 delayed effect Effects 0.000 claims description 4
- 230000001960 triggered effect Effects 0.000 claims description 4
- 230000002792 vascular Effects 0.000 claims description 4
- 230000003993 interaction Effects 0.000 claims description 3
- 230000004075 alteration Effects 0.000 claims 1
- 230000002035 prolonged effect Effects 0.000 claims 1
- 238000012163 sequencing technique Methods 0.000 claims 1
- 239000013598 vector Substances 0.000 abstract description 14
- 230000000638 stimulation Effects 0.000 abstract description 12
- 230000008859 change Effects 0.000 abstract description 11
- 230000000763 evoking effect Effects 0.000 abstract description 9
- 230000037361 pathway Effects 0.000 abstract description 3
- 238000001514 detection method Methods 0.000 abstract description 2
- 238000002604 ultrasonography Methods 0.000 description 73
- 238000006073 displacement reaction Methods 0.000 description 42
- 230000005540 biological transmission Effects 0.000 description 15
- 238000004458 analytical method Methods 0.000 description 10
- 238000005259 measurement Methods 0.000 description 10
- 230000006399 behavior Effects 0.000 description 8
- 210000002321 radial artery Anatomy 0.000 description 8
- 238000010586 diagram Methods 0.000 description 6
- 239000000203 mixture Substances 0.000 description 6
- 230000005855 radiation Effects 0.000 description 5
- 210000004204 blood vessel Anatomy 0.000 description 4
- 230000008878 coupling Effects 0.000 description 4
- 238000010168 coupling process Methods 0.000 description 4
- 238000005859 coupling reaction Methods 0.000 description 4
- 230000006870 function Effects 0.000 description 4
- 230000010363 phase shift Effects 0.000 description 4
- 238000012545 processing Methods 0.000 description 4
- 238000000034 method Methods 0.000 description 3
- 230000008901 benefit Effects 0.000 description 2
- 230000015572 biosynthetic process Effects 0.000 description 2
- 210000004369 blood Anatomy 0.000 description 2
- 239000008280 blood Substances 0.000 description 2
- 238000011161 development Methods 0.000 description 2
- 238000011156 evaluation Methods 0.000 description 2
- 230000000004 hemodynamic effect Effects 0.000 description 2
- 230000007246 mechanism Effects 0.000 description 2
- 230000000630 rising effect Effects 0.000 description 2
- 206010013710 Drug interaction Diseases 0.000 description 1
- 206010020565 Hyperaemia Diseases 0.000 description 1
- 238000010521 absorption reaction Methods 0.000 description 1
- 230000006978 adaptation Effects 0.000 description 1
- 239000000654 additive Substances 0.000 description 1
- 230000000996 additive effect Effects 0.000 description 1
- 238000007707 calorimetry Methods 0.000 description 1
- 238000006243 chemical reaction Methods 0.000 description 1
- 230000003750 conditioning effect Effects 0.000 description 1
- 230000001419 dependent effect Effects 0.000 description 1
- 238000013461 design Methods 0.000 description 1
- 238000007435 diagnostic evaluation Methods 0.000 description 1
- 230000003205 diastolic effect Effects 0.000 description 1
- 210000003414 extremity Anatomy 0.000 description 1
- 239000012530 fluid Substances 0.000 description 1
- 230000010354 integration Effects 0.000 description 1
- 230000002452 interceptive effect Effects 0.000 description 1
- 238000011835 investigation Methods 0.000 description 1
- HFGPZNIAWCZYJU-UHFFFAOYSA-N lead zirconate titanate Chemical compound [O-2].[O-2].[O-2].[O-2].[O-2].[Ti+4].[Zr+4].[Pb+2] HFGPZNIAWCZYJU-UHFFFAOYSA-N 0.000 description 1
- 229910052451 lead zirconate titanate Inorganic materials 0.000 description 1
- 238000000691 measurement method Methods 0.000 description 1
- 230000002503 metabolic effect Effects 0.000 description 1
- 230000004089 microcirculation Effects 0.000 description 1
- 238000012544 monitoring process Methods 0.000 description 1
- 230000000737 periodic effect Effects 0.000 description 1
- 230000035479 physiological effects, processes and functions Effects 0.000 description 1
- 230000008569 process Effects 0.000 description 1
- 230000001737 promoting effect Effects 0.000 description 1
- 230000000541 pulsatile effect Effects 0.000 description 1
- 238000000718 qrs complex Methods 0.000 description 1
- 230000011514 reflex Effects 0.000 description 1
- 230000008844 regulatory mechanism Effects 0.000 description 1
- 230000035945 sensitivity Effects 0.000 description 1
- 238000012360 testing method Methods 0.000 description 1
- 210000001364 upper extremity Anatomy 0.000 description 1
- 230000000283 vasomotion Effects 0.000 description 1
- 230000000007 visual effect Effects 0.000 description 1
Images





Classifications
-
- A—HUMAN NECESSITIES
- A61—MEDICAL OR VETERINARY SCIENCE; HYGIENE
- A61B—DIAGNOSIS; SURGERY; IDENTIFICATION
- A61B8/00—Diagnosis using ultrasonic, sonic or infrasonic waves
- A61B8/06—Measuring blood flow
Definitions
- This diagnostic device allows the detection of a vascular autonomous signal, by means of which the peripheral blood flow behavior, in particular in the pre-terminal and terminal current path of the fingertip, can be recorded as an extremely sensitive parameter for describing the circulatory situation of a person, in particular a patient.
- a diagnostic device of the above-mentioned basic type is known from DE-A-3 325 453, namely this diagnostic device has a device for measuring the temporal change in the flow vectors of erythrocytes in the bloodstream and can in principle be used for pre-terminal and / or terminal blood streams. Only one spot in the blood vessel is observed in smaller blood vessels, and it is suitable for determining changes in blood flow due to evoked extracorporeal stimulation.
- the object of the invention is in particular to provide a diagnostic device of the above type which makes it possible to instantly and quantitatively detect the RAC or VAS effect.
- This diagnostic device works according to a measuring method, the blood flow velocity and its vectorial Flow behavior in the radial artery determined under the influence of extracoporal stimulation.
- the signal registered at the measurement location results from the changes in resistance in the pre-terminal and terminal current paths of the fingertip and can be interpreted diagnostically on the basis of appropriate knowledge of physiology and hemodynamics.
- the extraordinarily complicated control mechanism of the microcirculation and the individual and optimal adaptation to the respective metabolic requirement preclude a generally valid description of this section of the vessel from the outset.
- the measurements to be carried out with the diagnostic device according to the invention preferably relate to the distal upper extremities.
- EVI effect EVI being the abbreviation for the English term “evoked velocity interference”, ie “evoked velocity interference”.
- This EVI effect is detected with the diagnostic device according to the invention in that the temporal change in the flow vectors of erythrocytes due to evoked extracorporeal stimulation is measured as an EVI signal.
- the frequencies from 8 to 25 MHz preferably from 10 to 25 MHz, particularly preferably from 15 to 25 MHz, are used as ultrasound frequencies.
- the device for removing the turbulent flow portion of the erythrocytes which is also referred to here as a device for removing the portion caused by the rotation of the erythrocytes from the ultrasound displacement frequency spectrum determined by the ultrasound displacement frequency measuring device, and the filter device for filtering out a predetermined ultrasound Shift frequency range from the ultrasound shift frequency spectrum serve to eliminate all frequencies interfering with the resolution, ie for the optimal determination of the temporal change in the flow vectors of the erythrocytes, from the ultrasound displacement frequencies detected by the ultrasound displacement frequency measuring device.
- a monitor for reproducing the temporal profile of the difference between the integrals of the spectral distribution density of the ultrasound displacement frequencies of the predetermined ultrasound displacement frequency range is coupled to the integrating and comparing device.
- the user can track the occurrence and the exact course of the diagnostic signal on the monitor, the monitor preferably being a television or picture tube monitor or a curve recorder, but can also be another curve display device.
- the diagnostic device equipped with a monitor in the above-mentioned manner is further designed such that the monitor is also connected to a spectral distribution density determination device for, preferably simultaneously, displaying the time profile of the spectral distribution density of the ultrasound displacement frequencies of the predetermined ultrasound displacement frequency range averaged over time is which is coupled with its input to the output of the filter device and with its output to the input of the integrating device.
- a spectral distribution density determination device for, preferably simultaneously, displaying the time profile of the spectral distribution density of the ultrasound displacement frequencies of the predetermined ultrasound displacement frequency range averaged over time is which is coupled with its input to the output of the filter device and with its output to the input of the integrating device.
- both the temporal profile of the difference of the integrals of the spectral distribution density of the ultrasound displacement frequencies and the temporal profile of the spectral distribution density of these ultrasound displacement frequencies averaged over time can be displayed synchronously, for example one above the other, so that the time display axes match and one of these two curves appears in the upper part of the monitor curve display area, while the other curve appears in the lower part of the monitor curve display area.
- the reproduction of the temporal curve of the spectral distribution density averaged over time in particular in the form of a so-called envelope curve, in addition to the reproduction of the time course of the difference of the integrals of the spectral distribution density, has the advantage above all that that the representation of the spectral distribution density averaged over time enables a visual check as to whether there is a hemodynamically acceptable ultrasound shift frequency signal, which is also referred to below as the ⁇ f signal, and whether the probe has been applied to the patient in such a way that the blood vessel to be detected is accurate is hit by the probe.
- ⁇ f signal hemodynamically acceptable ultrasound shift frequency signal
- the diagnostic device can advantageously be designed such that the filter device is coupled both directly and via a first memory to the spectral density distribution determination device, and that the spectral density distribution determination device is coupled via a second memory to the integrating and comparing device and the monitor.
- This configuration enables a reference value of the ⁇ f signal, that is to say reference ultrasound displacement frequencies, in the first memory to store, as obtained for example during a heartbeat of the patient when no extracorporeal stimulation has yet been evoked, so that the spectral density distribution determination device can on the one hand calculate a spectral reference distribution density averaged over time on the basis of the memory content of the first memory and enter it in the second memory, and that the spectral density distribution determination device also continuously determines current spectral density distributions averaged over time for a certain time, which may comprise a plurality of heartbeats, and likewise enters them into the second memory, from which the current and the reference values can be taken and processed by the integrating device. In addition, the corresponding current values for the representation of the spectral density distribution averaged over time can be fed to the monitor.
- a reference value of the ⁇ f signal that is to say reference ultrasound displacement frequencies
- the integrating and comparing device may take the reference value from the first memory and to receive the current values from the second memory, for which purpose the integrating and comparing device then still receives the reference value from the first memory would have to convert into a spectral distribution density averaged over time.
- the ultrasound displacement frequencies obtained from the filter device could in principle be processed and stored in an analog manner, it is preferred, apart from a preferably analog display on the monitor, the ultrasound displacement frequencies up to and including the integration of the spectral distribution density averaged over time
- an analog-to-digital converter is inserted, and for what purpose, ie for the purpose of analog display on the monitor in the connection between the second memory and the monitor and in the connection between the integrating and comparing device and the Monitor a digital-to-analog converter is inserted.
- the diagnostic device can have a control device which generates cardiac cycle-synchronous trigger pulses, which is coupled to the integrating and comparing device, the memory and the spectral density distribution determination device and in each case causes periodic operation of these structural units, as is explained in more detail below, for example.
- the diagnostic device according to the invention can be supplemented by a frequency analysis device which determines the spectral distribution density of the ultrasound displacement frequencies.
- This frequency analysis device makes it possible to determine the frequency range of interest in the respective case that is to be passed through the filter device.
- this frequency analysis device is characterized by a gate circuit which links the output of the ultrasound displacement frequency measuring device to the output of a control device for generating a cardiac cycle-synchronous trigger pulse of variable duration, and a multi-channel analyzer coupled to the gate circuit for multi-channel analysis of the frequency range passed through the gate circuit Ultrasonic shift frequencies. In this way it is possible to select a specific desired area from the cardiac cycle.
- the measuring method and diagnostic device shown in the figures and based on high-frequency ultrasound detects, using the Doppler effect, the flow vector changes in the erythrocytes that arise due to an evoked change in the pre-terminal and terminal current path.
- the radial artery was chosen as the measurement site, the elasticity of which, if intact, results in an additive and agglomerative inversion of the erythrocyte flow vectors under the influence of stimulation, for example in the area of the concha.
- the actual location of the event is distal in the pre-terminal Current path of the fingertips and should theoretically also be measured there.
- FIG. 1 shows the transducer configuration of a preferred ultrasound probe for the diagnostic device.
- the axes 1 and 2 of the two piezoelectric transducer elements 3 and 4 are arranged at an angle ⁇ of preferably 45 °.
- the piezoelectric transducer elements 3 and 4 have such a curved radiation or reception surface 5 or 6 that their radiation or reception area is focusing along the axis 1 or 2.
- One of the two piezoelectric transducer elements 3 or 4 is optionally used as an ultrasonic transmitter, while the other of these two piezoelectric transducer elements 4 or 3 is used as an ultrasonic receiver.
- the two axes 1 and 2 intersect in the sample volume 7, which is indicated schematically by an imaginary cube, through which the blood vessel to be examined, in this case the radial artery 8, passes.
- the piezoelectric transducer elements 3 and 4 can be interchanged in their ultrasound transmission and reception function, it is assumed here that the piezoelectric transducer element 3 is the ultrasound transmitter and the piezoelectric transducer element 4 is the ultrasound receiver Arrow the main flow vector facing away from the ultrasound receiver the erythrocytes flowing in the radial artery represent 8, while the arrow labeled 10 represents the main flow vector of these erythrocytes directed towards the ultrasound receiver (TOWARDS or AWAY vector).
- FIG. 2 shows a section through the entire ultrasonic measuring head.
- the piezoelectric transducer elements 3 and 4 are mounted in an ultrasound head housing 12 on a carrier 13 which, as indicated by the double arrow 14, can be displaced perpendicularly to the surface of the skin 11 and is therefore adjustable.
- a coupling medium 15, for example a coupling gel, is located between the skin 11 and the carrier 13 or the piezoelectric transducer elements 3 and 4.
- the average distance D2 between the axis of the radial artery and the center points of the radiation or reception surfaces 5 and 6 of the piezoelectric transducer elements 3 and 4 being approximately 5 mm in practice and the cubic sample volume 7 (see FIG. 1) is preferably chosen to be about 2 mm 3.
- the intersection of the two axes 1 and 2 can be adjusted on the ultrasound head axis 16, which runs perpendicular to the surface of the skin 11, by adjusting the carrier 13 by a certain adjustment distance of preferably ⁇ 3 mm, i.e. to the distances D1 and D3 in FIG. 2.
- these ultrasound radiation or reception lobes After passing through the ultrasound radiation or reception lobe of the piezoelectric transducer element 3 or 4, these ultrasound radiation or reception lobes are divergent, and the absorption of the ultrasound increases quadratically with the distance.
- the sinusoidal application frequency of the ultrasound in the present embodiment is approximately 15 MHz converted into longitudinal waves of the same frequency by means of a piezoelectric transducer element made of lead zirconate titanate and irradiated into the examination area 17 with an average power of 4 mW / cm 2 (calorimetrically measured).
- the ultrasound frequency used is generally in the range from 8 to 25 MHz, preferably in the range from 10 to 25 MHz, and particularly preferably in the range from 15 to 25 MHz.
- the average irradiated ultrasound power should be as small as possible to exclude biological damage, so it should not exceed 50 mW / cm2 (measured by calorimetry).
- this diagnostic device essentially consists of a device for measuring the temporal change in the flow vectors of erythrocytes in pre-terminal and / or terminal blood flow paths due to evoked extracorporeal stimulation.
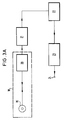
- the basic diagnostic device shown in FIG. 3A has the following: an ultrasound displacement frequency measuring device 18 for measuring ultrasound displacement frequencies which are caused by interaction of the erythrocytes with an ultrasound field.
- this ultrasound displacement frequency measuring device 18 comprises an ultrasound probe or an ultrasound head 19, for example as shown in FIGS. 1 and 2, as well as a high-frequency transmission and reception device 20 which is connected to the ultrasound probe 19 and operates it.
- This high-frequency transmitting and receiving device 20 is connected to a device 21 for removing the portion caused by the rotation of the erythrocytes from the ultrasound displacement frequency spectrum determined by the ultrasound displacement frequency measuring device 18.
- This device is explained in more detail below and in particular contains a demodulator device for demodulating the input high-frequency signals.
- the device 21 is followed by a filter device 22 for filtering out a predetermined ultrasound displacement frequency range from the ultrasound displacement frequency spectrum.
- the filter device 22 can consist of a filter and the shift frequency signals to be finally processed, the so-called ⁇ f signals, can be routed in front of or behind the filter device 22 on a common line.
- the filter device 22 is followed by an integrating and comparing device 23, which integrates the integral of the spectral distribution density averaged over time Forms ultrasound displacement frequencies of the predetermined ultrasound displacement frequency range passed through the filter device 22 and performs a size comparison of the integrals formed on the basis of two ultrasound displacement frequency spectra determined in succession and outputs a diagnostic signal representing the result of this comparison at its output 24.
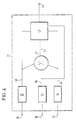
- a device 21 for removing the portion caused by the rotation of the erythrocytes from the ultrasound displacement frequency spectrum determined by the ultrasound displacement frequency measuring device 18, which is shown in FIG. 4, comprises a first demodulator 32, a second demodulator 33 and a third demodulator 34 , which receive the transmission frequency signal f0 and the reception frequency signal f0 + ⁇ f in electrical form at their inputs 35, 36 and 37, for which purpose the inputs 35, 36 and 37 each consist of two lines.
- the received signal f0 + ⁇ f which is proportional to the blood velocity
- ⁇ f represents a large number of shift frequencies.
- This received signal is processed in a broadband amplifier and supplied to the demodulators in addition to the transmission signal f0.
- the outputs 38, 39 and 40 of the demodulators 32, 33 and 34 are connected to a summing device 41 which sums the demodulation signals emitted by the demodulators and sends the sum signal via its output 43 to a comparison device 43, which is preferably a computer and also is directly coupled to the outputs 38, 39 and 40 of the demodulators 32, 33 and 34.
- the filter device 22 comprises a high-pass filter, the quality Q and the frequency f c of which are preferably programmable by keys using a binary-coded signal.
- a fixed program with an upper cut-off frequency F HI of 480 Hz or a time constant v of 0.00208 sec or with an upper cut-off frequency of 960 Hz or a time constant ⁇ of 0.00104 sec of the high-pass filter is preferably provided.
- a low-pass filter is connected downstream of the high-pass filter, in which, according to the intended fixed program, all frequency components are separated either or half of 1250 Hz corresponding to a time constant ⁇ of 0.0008 sec or above 2100 Hz corresponding to a time constant ⁇ of 0.00047 sec.
- four preferred frequency windows or passbands of the filter device 22 can be selected, namely 480 to 1250 Hz, 480 to 2100 Hz, 960 to 1250 Hz and 960 to 2100 Hz.
- other frequency passbands of the filter device 22 can preferably be manually or by other programs can be set.
- these cut-off frequencies or time constants of the filter device 22 are directly related to the rotational behavior of the erythrocytes in the case of manipulated vasomotion of the preterminal blood flow path, and the above-mentioned switchable filter device 22 provides four autonomous frequency windows for arithmetic test evaluation .
- the selection of the frequency range used for the calculation, i.e. further processing, is primarily dependent on the current circulatory situation of the patient as well as on his vascular and blood flow status and must be carried out individually from case to case.
- the criterion for this can be the ⁇ f envelope curve, which is explained in more detail below and indicated on the lower part of the monitor in FIG.
- the programming of the filter device 22 should be changed until the diastolic / end-diastolic flow velocity has the smallest value.
- the shift frequency mixture appearing within the selected frequency band is obtained from the different shift frequencies ⁇ f, which is then obtained from the integrating and comparing device 23, one embodiment of which is described in more detail below in connection with the explanation of FIG. 3B. is fed.
- FIG. 3B The embodiment of a diagnostic device shown in FIG. 3B in a more detailed block diagram will now be explained:
- the embodiment of FIG. 3B also includes, as shown in this figure, the ultrasound probe 19, the high-frequency transmitting and receiving device 20, a device 21 for removing the portion caused by the rotation of the erythrocytes from the portion of the ultrasound displacement frequency measuring device 19, 20 determined ultrasound displacement frequency spectrum, which can be designed, for example, according to FIG. 4A or FIG. 4B, and the integrating and comparing device 23, at the output 24 of which the diagnostic signal is obtained.
- this embodiment also includes the structural units described in more detail below in addition to FIG.
- a low-frequency signal conditioning device 45 is provided, which can be connected between the device 21 and the filter device 22 if a device 21 according to FIG. 4 is used, as shown in FIG. 3B.
- a control amplifier 46 is connected downstream of the output of the filter device 22 and serves to normalize the amplitude of the frequency mixture occurring within the frequency band passed by the filter device 22. However, this control amplifier can also be connected between the low-frequency signal processing device 45 and the filter device 22, specifically before the branch 47, on which a line 48 branches off, which goes to the input of a control unit 49, in which case no separate control amplifier is required for the control unit 49.
- a monitor 50 for displaying the time profile of the difference between the integrals the spectral distribution density of the ultrasound displacement frequencies of the predetermined ultrasound displacement frequency range let through by the filter device 22 is connected to the output 24 of the integrating and comparing device.
- This aforementioned difference in integrals is also referred to below as ⁇ f signal, while the individual integrals are also referred to as ⁇ f signals.
- the ⁇ f signal is reproduced in the present example on the upper half of the monitor 50 designed as a television screen monitor, as shown at 65.
- the monitor 50 is also connected to a spectral distribution density determination device 51 for simultaneous reproduction of the time profile of the spectral distribution density of the ultrasound displacement frequencies averaged over the time of the predetermined ultrasound displacement frequency range passed through by the filter device 22.
- This is coupled with its input 52 or 53 to the output of the filter device 22 via components explained below and optionally the control amplifier 46.
- the output 54 or 55 is coupled via a memory 56 to the input 57 or 58 of the integrating and comparing device 23.
- the coupling of the filter device 22 to the spectral distribution density determination device 51 comprises an analog-to-digital converter 59, the output signal of which is fed directly via the input 52 into a first computer 60 of the spectral distribution density determination device 51.
- the output of the analog-to-digital converter 59 is connected via a memory 61 and the input 53 to a second computer 62 of the spectral distribution density determination device 51.
- the output of the memory 56 is connected to the monitor 50 via a digital-to-analog converter 63 in order to display the spectral distribution density averaged over time on the monitor.
- This spectral distribution density averaged over time is shown here in the lower part of the monitor screen as an envelope, as indicated at 64.
- the signal entered into the monitor for this purpose is also referred to below as the ⁇ f envelope signal and in the present case is shown on the monitor screen in synchronism with the ⁇ f signal.
- the ⁇ f signal normalized with the control amplifier is converted in the control unit 49 into a pulse width modulated signal via a zero crossing detector.
- the resulting analog signal is differentiated the first mathematical derivative (first differential quotient) is determined and a trigger signal S t is generated, which is obtained at the output 66 of the control unit 49.
- This trigger signal is fed to the integrating and comparing device 23, the computers 60 and 62 and the memory 61 and is used to effect a time-synchronous sequence control of these components.
- a low-frequency amplifier 67 is coupled to the output of the filter device 22, to the output of which a headphone or loudspeaker 68 is connected, as a result of which the acoustic representation of the blood flow rate and the displacement frequency proportional to its behavior can take place.
- the acoustic representation can be stereophonic in accordance with the flow vectors 9 and 10 (see FIGS. 1 and 2).
- the frequency band transmitted in this case corresponds to that of the four frequency windows of the filter device 22 mentioned above, provided that their fixed program is used.
- an oscillator 69 is coupled to the output 24 of the integrating and comparing device 23 and connected to the low-frequency amplifier 67, so that when a diagnostic signal occurs, which is also referred to here as an EVI signal, and sets the oscillator 69 in motion, that in the headphones or loudspeaker 68 audible flow signal, a continuous tone is superimposed, which signals an effect detected by a diagnostic signal.
- a diagnostic signal which is also referred to here as an EVI signal
- a reference ⁇ f signal is stored in the memory 61 on the basis of a manual command, which can take place, for example, at the beginning of a measuring cycle, this reference ⁇ f signal corresponding, for example, to any blow that is still unaffected by evoked extracorporeal stimulation.
- This reference ⁇ f signal previously digitized by the analog-to-digital converter 59, is available to the computer 62, which calculates a reference value of the time-averaged spectral distribution density of the shift frequencies and inputs this reference value into the memory 56.
- All of the ⁇ f signals arriving in the subsequent measurement period of, for example, 90 seconds per heartbeat, after digitization in the analog-to-digital converter 59, are continuously supplied as current ⁇ f signals to the computer 60, which calculates the current spectral distribution densities of the shift frequencies averaged over time calculated and also entered into the memory 56.
- both computers 60 and 62 create the time-averaged spectral distribution density curve of the shift frequencies, with computer 60 creating the current distribution density curve and computer 62 creating a reference distribution density curve.
- the distribution density curves created by the computer 60 are taken from the memory 56 via the output 70, then digitized by means of the digital-to-analog converter 63 and then displayed on the screen of the monitor 50 as an envelope 64, which extends over the measurement period of 90 seconds in the present case as indicated on the screen in Figure 3B.
- both the current spectral distribution density curve of the shift frequencies averaged over time Via the output 70 of the memory 56 and the spectral reference distribution density curve of the shift frequencies averaged over time, the outputs 57 of the memory 56 are fed to the inputs 57 and 58 of the integrating and comparing device 23, which integrates these two distribution density curves, that is to say continuously current integral ⁇ f signals and a reference integral ⁇ f signal created during the measurement period and continuously forms the difference between the current integral ⁇ f signal and the reference integral ⁇ f signal during the measurement period, so that continuously current ⁇ Receives ⁇ f signals that result in a total of ⁇ f curve 65 on the screen of monitor 50 over the measurement period.
- the monitor can also be another display and / or recording device, for example a two-channel recorder. Both the ⁇ f envelope signals and the ⁇ f signals are preferably additionally displayed on two mutually independent LED bar graph displays as oscillating bars or dots, so that this enables inertial monitoring of the blood flow behavior.
- the calculation of one of the two flow vectors 9 or 10 can, moreover, be initiated by the preferred embodiment using a key.
- a particularly preferred embodiment of the integrating and comparing device 23 has the following structure: It essentially consists of a voltage-frequency converter with a large bandwidth, a start-stop unit and a bit counter with memory, in particular a 4 ⁇ 4 bit counter.
- the pulsatile ⁇ f envelope signal is converted via the voltage frequency converter into an amplitude-constant square wave signal, the frequency of which is higher the greater the amplitude of the envelope (du / df).
- the values present in the 4 ⁇ 4 bit counter of the integrating and comparing device 23 are deleted via the start-stop unit, and the counter input is cleared for a predetermined period of time, which is preferably 450 msec , released for data reading. After this data read-in period has elapsed, data is transferred to the memory of the integrating and comparing device 23 and the 4 ⁇ 4 bit counter is cleared.
- the dimensionless storage value represents the area integral of the ⁇ f envelope and is used as a reference value. In this case, since the calculation of the current ⁇ f signal is preferably carried out from heartbeat to heartbeat, the result is displayed shifted by one heart cycle.
- the calculation of the ⁇ f values must taking into account a polarity sign.
- the baseline of the monitor for example a recorder, is therefore in the middle and has a graduated range of, for example, 25 degrees for 250 Hz of the calculated ⁇ f values in both directions.
- the computer of the integrating and comparing device 23 is entered, for example corresponding to 250 Hz of the calculated ⁇ f values, and a subtraction is carried out with respect to the display. This means that regardless of the autonomous instantaneous calculation, the display can be influenced in such a way that the entered value is subtracted from the calculated value and is only displayed when it is exceeded.
- a jump function in the amount of the entered value is performed when the preselected value is exceeded on the monitor or recorder.
- the flow rate continues to increase, the value displayed on the monitor or recorder continues to be analog until the setpoint is undershot and returns to the baseline with a jump function.
- the sign of the EVI or diagnostic signal can be shown on an LED display.
- the ⁇ f signal shown on the bar graph display is not subject to this arithmetic operation and therefore shows every change with the corresponding polarity sign, insofar as there is a deviation from the stored reference value.
- the current path still has a changed flow behavior in the form of after-fluctuations, which result in a surface integral that is different from the initial value. If this counter-regulation, which can last up to one minute, has dropped to ⁇ 10% compared to the stored value, a green LED display, for example, can signal that a new reference value can now be stored in the memory 61. If a new reference value was entered before this time, the subsequent calculation would necessarily be false positive.
- the individual computer data can be called up via a digital video monitor with image memory and can be displayed on a television monitor with the interposition of a modulator.
- FIG. 5 shows a block diagram of a preferred frequency analysis device for determining the spectral distribution density of the ultrasound shift frequencies, which makes it possible to determine the frequency range of interest to which the filter device 22 is to be set.
- the complete ⁇ f signal which is picked up in front of the filter device 22, can be examined for spectral frequency distribution in a frequency range of preferably 0 to 3 kHz, that is to say the entire shift frequency range, in a plurality of channels, for example in 256 channels.
- This spectral frequency distribution can be represented, for example, by a histogram of Blaken or dots.
- the values determined in the individual channels, for example in the 256 channels are preferably digitized in a memory.
- the frequency analyzer according to FIG. 5 is constructed as follows:
- the ⁇ f signal comes from the ultrasonic displacement frequency measuring device 20 either directly or via the device 21 and / or 45 (see in particular FIG. 3B) and is linked via a gate circuit 72 to the output signal of a control device 73, which receives its input signal from an electrocardiogram unit 74 receives.
- the control device 73 is used to generate a variable cardiac cycle-synchronous trigger pulse and comprises the following components in series: a trigger pulse generation circuit 75 for generating a cardiac cycle-synchronous trigger pulse of a predetermined duration, as well as a trigger pulse delay or extension circuit 76 and a delayed trigger pulse by the delayed trigger pulse or the falling edge generating device 77, which generates adjustable length pulses.
- the part of the frequency analysis device coupled to the output of the gate circuit 72 comprises the following, as shown in FIG. 5: An analog-to-digital converter 78 connected between the output of gate 72 and the parallel inputs of a reference memory 79 and a latch 80. Both the reference memory 79 and the signal memory 80 are connected to the inputs of a computer 81, the outputs 82 and 83 of which are connected to the input of a multiplexer.
- the multiplexer 84 is followed by a multi-channel filter 85, which can be a 256-channel filter, for example.
- This multichannel filter 85 is followed by a video converter 86, which is followed by a monitor 87. With the multi-channel filter 85 and the video converter 86 and to the connection between the multi-channel filter and the video converter 86, a point histogram calculator 88 can be connected.
- FIG. 6 shows some curves to explain the mode of operation of the input part of the frequency analyzer according to FIG. 5, namely curve I represents the time course of the ⁇ f signal, while curve II shows the course of an electrocardiogram synchronously in time; curve III shows a trigger pulse obtained in the trigger pulse generation circuit 75; curve IV shows the trigger pulse extended by the trigger pulse delay circuit 76; and curve V shows the pulse triggered by the rising edge of the extended trigger pulse, which pulse is emitted by the pulse generating device 77 and whose length is adjustable.
- the control device 73 of FIG. 5 operates as follows:
- the trigger pulse generation circuit 75 derives a cardiac cycle synchronous trigger pulse 89 from the EKG signal of the cardiac systole, namely the QRS complex.
- the downstream trigger pulse delay or extension circuit 76 extends the trigger pulse 89 in a variably adjustable manner over the entire range of the diastole, so that the pulse 90 in FIG. 6 results.
- the pulse generation circuit 77 can be, for example, a monostable gate circuit which opens the pulse 90 with the falling edge 91 and emits a high-lying signal in the range of a time length from 0 to 450 msec, ie up to the entire length of the hemodynamic phase. This length is adjustable and the pulse 92 in FIG. 6 is obtained.
- the output signal of the control device 73 opens the gate circuit 21, so that a certain frequency range from the total ⁇ f range is let through for the evaluation, or, if the control pulse is at a maximum length, also the total ⁇ f range.
- These transmitted frequencies are digitized in the analog-to-digital converter 78, and a representative cardiac cycle without stimulation of the patient is stored in the reference memory 79, while the ⁇ f signal of the same changed due to stimulation, provocation, evocation is stored in the signal memory 80 Time range (positional and lengthwise), as it is the ⁇ f signal of the reference memory 79, is entered.
- the computer 81 calculates the difference from the frequencies corresponding to the individual frequencies.
- One output 82 of the computer makes it possible to selectively enter the content of the reference memory 79 or the signal memory 80 into the multiplexer 84, while the aforementioned differences are input into the multiplexer 84 via the output 83 of the computer.
- the multiplexer 84 switches through the input frequencies in a synchronized manner, so that 85 weighted channels are obtained at the output of the downstream multi-channel filter (frequency-weighted).
- the point histogram calculator 88 uses a cursor to selectively display a recorded spectral distribution, so that either a point display or a histographic display is obtained, either over the full ⁇ f range or over a section of the total ⁇ f range.
- the line drawn in from the connection point between the multi-channel filter 85 and the video converter 86 to the point histogram computer 88 in FIG. 5 feeds the required control signal to the cursor.
- frequency ranges of interest can be determined by this frequency analysis device and be programmed into the filter device 22 of FIGS. 3A and 3B.
Landscapes
- Health & Medical Sciences (AREA)
- Life Sciences & Earth Sciences (AREA)
- Heart & Thoracic Surgery (AREA)
- Medical Informatics (AREA)
- Biophysics (AREA)
- Nuclear Medicine, Radiotherapy & Molecular Imaging (AREA)
- Pathology (AREA)
- Radiology & Medical Imaging (AREA)
- Engineering & Computer Science (AREA)
- Biomedical Technology (AREA)
- Hematology (AREA)
- Physics & Mathematics (AREA)
- Molecular Biology (AREA)
- Surgery (AREA)
- Animal Behavior & Ethology (AREA)
- General Health & Medical Sciences (AREA)
- Public Health (AREA)
- Veterinary Medicine (AREA)
- Ultra Sonic Daignosis Equipment (AREA)
- Measuring Pulse, Heart Rate, Blood Pressure Or Blood Flow (AREA)
Claims (10)
- Appareil de diagnostic pour détecter un signal de débit sanguin en mesurant la modification dans le temps du débit de globules rouges dans les voies préterminales et/ou terminales d'écoulement du sang, comprenant :(a) un dispositif de mesure de fréquences de déplacement ultrasonores (19, 20), pour mesurer des fréquences de déplacement ultrasonores qui sont produites par l'interaction des globules rouges avec un champ ultrasonore ;(b) un dispositif (21) pour supprimer, du spectre de fréquences de déplacement ultrasonores déterminé par le dispositif de mesure de fréquences de déplacement ultrasonores (19, 20), la part d'écoulement turbulent des globules rouges, dispositif qui présente un premier et un deuxième démodulateurs (32, 33), le premier démodulateur (32) démodulant les signaux électriques de fréquences de déplacement, présents à la sortie d'une sonde émettrice et réceptrice d'ultrasons (29), en présence d'un premier déphasage, de préférence de 0°, par rapport au signal électrique de fréquence d'émission, tandis que le deuxième démodulateur (33) démodule les signaux électriques de fréquences de déplacement, présents à la sortie de la sonde émettrice et réceptrice d'ultrasons (29), en présence d'un deuxième déphasage par rapport au signal électrique de fréquence d'émission qui est de préférence égal à 90° ;(c) un dispositif de filtrage (22) pour supprimer par filtration, du spectre de fréquences de déplacement ultrasonores, une plage prédéterminée de fréquences de déplacement ultrasonores ; et(d) un dispositif intégrateur et comparateur (23), pour former l'intégrale de la densité de répartition spectrale des fréquences de déplacement ultrasonores de la plage prédéterminée de fréquences de déplacement ultrasonores, et pour comparer quantitativement les intégrales formées par le dispositif intégrateur et comparateur (23) sur la base de deux spectres de fréquences de déplacement ultrasonores déterminés successivement dans le temps, et délivrer un signal de diagnostic représentant le résultat de la comparaison ;caractérisé en ce que le dispositif (21) pour supprimer la part d'écoulement turbulent des globules rouges comprend les éléments suivants :(1) un troisième démodulateur (34), qui démodule les signaux de fréquences de déplacement, présents à la sortie de la sonde émettrice et réceptrice d'ultrasons (29), en présence d'un troisième déphasage par rapport au signal électrique de fréquence d'émission qui est de préférence égal à 180° ;(2) un dispositif totalisateur (41), qui additionne les signaux de démodulation délivrés par les démodulateurs (32, 33, 34) ; et(3) un dispositif comparateur (43), qui forme des signaux différentiels à partir des sommes des signaux de démodulation et des différences des signaux de démodulation, et qui délivre à sa sortie (42) celui de ces signaux différentiels qui est chaque fois le plus grand.
- Appareil de diagnostic selon la revendication 1, caractérisé en ce que le dispositif comparateur (43) est un calculateur.
- Appareil de diagnostic selon la revendication 1 ou 2, caractérisé par un écran de contrôle (50), qui est couplé au dispositif intégrateur et comparateur (23) afin de reproduire l'allure dans le temps de la différence des intégrales de la densité de répartition spectrale des fréquences de déplacement ultrasonores de la plage prédéterminée de fréquences de déplacement ultrasonores
- Appareil de diagnostic selon la revendication 3, caractérisé en ce que l'écran de contrôle (50) est en outre, afin de reproduire de préférence simultanément l'allure dans le temps de la moyenne dans le temps des densités de répartition spectrale des fréquences de déplacement ultrasonores de la plage prédéterminée de fréquences de déplacement ultrasonores, relié à un dispositif de détermination de densité de répartition spectrale (51) qui comprend deux calculateurs (60, 62), qui sont couplés par leur entrée (52, 53) à la sortie du dispositif de filtrage (22) et par leur sortie (54, 55) à l'entrée (57, 58) du dispositif intégrateur et comparateur (23).
- Appareil de diagnostic selon la revendication 4, caractérisé en ce que le dispositif de filtrage (22) est couplé au dispositif de détermination de densité de répartition spectrale (51) à la fois directement et par l'intermédiaire d'une première mémoire (61), et en ce que le dispositif de détermination de densité de répartition spectrale (51) est couplé au dispositif intégrateur et comparateur (23) et à l'écran de contrôle (50) par l'intermédiaire d'une seconde mémoire (56).
- Appareil de diagnostic selon la revendication 5, caractérisé en ce qu'un convertisseur analogique-numérique (59) est intercalé dans la liaison entre le dispositif de filtrage (22) d'une part et la première mémoire (61) ainsi que le dispositif de détermination de densité de répartition spectrale (51) d'autre part, et en ce qu'un convertisseur numérique-analogique (63) est de préférence intercalé dans la liaison entre la seconde mémoire (56) et l'écran de contrôle (50).
- Appareil de diagnostic selon l'une quelconque des revendications 1 à 6, caractérisé par un dispositif de commande (49), qui produit des impulsions de déclenchement synchrones du rythme cardiaque et dont la sortie (66) est couplée au dispositif intégrateur (23), au dispositif de détermination de densité de répartition spectrale (51) et à la première mémoire (61), les impulsions de déclenchement produisant la commande séquentielle, synchrone dans le temps, du dispositif intégrateur (23), du dispositif de détermination de densité de répartition spectrale (51) et de la première mémoire (61).
- Appareil de diagnostic selon l'une quelconque des revendications 1 à 7, caractérisé par un analyseur de fréquences, qui détermine la densité de réparation spectrale des fréquences de déplacement ultrasonores (figure 5).
- Appareil de diagnostic selon la revendication 8, caractérisé par un circuit porte (72) qui combine la sortie du dispositif de mesure de fréquences de déplacement ultrasonores (19, 20) avec la sortie d'un dispositif de commande (73) pour produire une impulsion de déclenchement (92) synchrone du rythme cardiaque, et par un analyseur multicanal (78 à 88), couplé au circuit porte (72) et destiné à l'analyse multicanal de la plage de fréquences de déplacement ultrasonores que laisse passer le circuit porte (72).
- Appareil de diagnostic selon la revendication 9, caractérisé en ce que le dispositif de commande (73) est couplé à une unité d'électrocardiogramme (74) et présente les éléments suivants, montés en série :(a) un montage générateur d'impulsions de déclenchement (75), pour produire une impulsion de déclenchement (89), synchrone du rythme cardiaque, de durée prédéterminée ;(b) un montage retardateur ou prolongateur d'impulsions de déclenchement (76), à durée de retardement ou de prolongement réglable ; et(c) un dispositif générateur d'impulsions (77), qui est déclenché par l'impulsion de déclenchement retardée (90) ou par le flanc de descente (91) de l'impulsion de déclenchement prolongée (90), et qui produit des impulsions (92) de longueur réglable.
Priority Applications (1)
| Application Number | Priority Date | Filing Date | Title |
|---|---|---|---|
| AT85111379T ATE85199T1 (de) | 1984-09-21 | 1985-09-09 | Ultraschall-geraet zur determination des peripheren blutstroemungsverhaltens. |
Applications Claiming Priority (2)
| Application Number | Priority Date | Filing Date | Title |
|---|---|---|---|
| DE19843434740 DE3434740A1 (de) | 1984-09-21 | 1984-09-21 | Diagnosegeraet |
| DE3434740 | 1984-09-21 |
Publications (3)
| Publication Number | Publication Date |
|---|---|
| EP0186732A2 EP0186732A2 (fr) | 1986-07-09 |
| EP0186732A3 EP0186732A3 (en) | 1988-09-21 |
| EP0186732B1 true EP0186732B1 (fr) | 1993-02-03 |
Family
ID=6246017
Family Applications (1)
| Application Number | Title | Priority Date | Filing Date |
|---|---|---|---|
| EP85111379A Expired - Lifetime EP0186732B1 (fr) | 1984-09-21 | 1985-09-09 | Appareil ultrasonique pour la détermination du comportement du flux sanguin périphérique |
Country Status (3)
| Country | Link |
|---|---|
| EP (1) | EP0186732B1 (fr) |
| AT (1) | ATE85199T1 (fr) |
| DE (2) | DE3434740A1 (fr) |
Cited By (1)
| Publication number | Priority date | Publication date | Assignee | Title |
|---|---|---|---|---|
| CN111757769A (zh) * | 2018-01-05 | 2020-10-09 | 医视特有限公司 | 多频超声换能器 |
Families Citing this family (1)
| Publication number | Priority date | Publication date | Assignee | Title |
|---|---|---|---|---|
| CN106456118B (zh) * | 2013-11-19 | 2019-12-31 | 港大科桥有限公司 | 超声流体向量成像装置及其方法 |
Family Cites Families (8)
| Publication number | Priority date | Publication date | Assignee | Title |
|---|---|---|---|---|
| CA1021052A (en) * | 1973-02-16 | 1977-11-15 | Pierre-Andre Grandchamp | Method and apparatus for the measurement of a fluid-flow velocity profile |
| AT343265B (de) * | 1973-08-16 | 1978-05-26 | Siemens Ag | Gerat fur die messung der geschwindigkeit von insbesondere in leitungen stromenden medien |
| DE2461264C3 (de) * | 1974-12-23 | 1978-06-01 | Siemens Ag, 1000 Berlin Und 8000 Muenchen | Vorrichtung für die Messung des Volumenstroms strömender Medien |
| DE2911258C2 (de) * | 1979-03-22 | 1982-09-23 | Chmiel, Horst, Prof. Dr.-Ing., 7250 Leonberg | Vorrichtung zum noninvasiven Messen der Blutströmungsgeschwindigkeit nach der Ultraschall-Doppler-Effekt-Methode |
| JPS5849137A (ja) * | 1981-09-18 | 1983-03-23 | 株式会社東芝 | 超音波血流測定装置 |
| JPS5911835A (ja) * | 1982-07-14 | 1984-01-21 | 松下電器産業株式会社 | 超音波ドプラ装置 |
| JPS5920149A (ja) * | 1982-07-28 | 1984-02-01 | 富士通株式会社 | 超音波パルスドプラ血流計 |
| US4472972A (en) * | 1982-10-27 | 1984-09-25 | General Electric Company | Ultrasound imaging system employing operator controlled filter for reflected signal attenuation compensation |
-
1984
- 1984-09-21 DE DE19843434740 patent/DE3434740A1/de not_active Withdrawn
-
1985
- 1985-09-09 DE DE8585111379T patent/DE3587069D1/de not_active Expired - Fee Related
- 1985-09-09 AT AT85111379T patent/ATE85199T1/de active
- 1985-09-09 EP EP85111379A patent/EP0186732B1/fr not_active Expired - Lifetime
Cited By (2)
| Publication number | Priority date | Publication date | Assignee | Title |
|---|---|---|---|---|
| CN111757769A (zh) * | 2018-01-05 | 2020-10-09 | 医视特有限公司 | 多频超声换能器 |
| CN111757769B (zh) * | 2018-01-05 | 2022-08-09 | 医视特有限公司 | 多频超声换能器 |
Also Published As
| Publication number | Publication date |
|---|---|
| DE3587069D1 (de) | 1993-03-18 |
| DE3434740A1 (de) | 1986-04-03 |
| EP0186732A2 (fr) | 1986-07-09 |
| ATE85199T1 (de) | 1993-02-15 |
| EP0186732A3 (en) | 1988-09-21 |
Similar Documents
| Publication | Publication Date | Title |
|---|---|---|
| DE69530207T2 (de) | Vorrichtung zur impedanz-kardiographie | |
| DE19827697B4 (de) | Verfahren und System zum Bestimmen der Qualität von Signalen, die die Herzfunktion anzeigen | |
| DE3625041C2 (fr) | ||
| DE69838533T2 (de) | Verfahren und Gerät für Strahlungstomographie | |
| DE10248745B4 (de) | Verfahren zur Verwendung von Ultraschall zum Analysieren von interessierenden Medien und Ultraschallanalysesystem | |
| DE69313280T3 (de) | Erzeugung von spektraldarstellungen der herztöne | |
| EP0027215B1 (fr) | Cardiotachomètre | |
| DE19548988C2 (de) | Ultraschall-Diagnosesystem | |
| DE2546856C3 (de) | Verfahren und Vorrichtung zum Messen der Frequenz bzw. Periodendauer eines Signals | |
| DE69115275T2 (de) | Anlage der elektrischen impedanztomographie in echtzeit. | |
| DE10085086B4 (de) | Medizinisches Diagnose-Ultraschallsystem und -verfahren mit automatisch ausgelösten Intervallen | |
| DE60300629T2 (de) | Bildverarbeitungsgerät und Ultraschalldiagnosegerät | |
| DE69232267T2 (de) | Verfahren zur impedanz-kardiographie und zur bestimmung des herz-rhythmus sowie apparat zu deren implementierung | |
| DE10039346B4 (de) | Verfahren und Vorrichtung zur dynamischen Rauschverringerung für ein Doppler-Audioausgangssignal | |
| DE2716739B2 (de) | Verfahren zur Detektion von Signalen | |
| DE69329192T2 (de) | Anordnung und verfahren zur untersuchung der hörfähigkeit beim menschen | |
| DE2737519A1 (de) | Verfahren und schaltungsanordnung zur raschen, eingriffsfreien bestimmung der systolischen zeitintervalle | |
| DE2215543A1 (de) | Vorrichtung zum Erfassen von Kreislauftonsignalen | |
| DE3012554A1 (de) | Verfahren zum kombinieren elektrisch sowie mechanisch gewonnener kardiographischer signale und vorrichtung zum durchfuehren des verfahrens | |
| CH625409A5 (fr) | ||
| DE69937789T2 (de) | Verfahren und vorrichtung zur bestimmung des rhythmus bei auskultationssignalen | |
| DE10246404A1 (de) | Verfahren & System zur Messung von T-Wellen-Alternationen durch eine Ausrichtung von alternierenden in der Mitte befindlichen Schlägen zu einem kubischen Spline | |
| DE2851262A1 (de) | Verfahren zum charakterisieren der durch das herz durchtretenden blutstroemung und vorrichtung zum durchfuehren dieses verfahrens | |
| DE102019009382B4 (de) | Atmung aus einem photoplethysmogramm (ppg) unter verwendung fester und adaptiver filterung | |
| EP0186732B1 (fr) | Appareil ultrasonique pour la détermination du comportement du flux sanguin périphérique |
Legal Events
| Date | Code | Title | Description |
|---|---|---|---|
| PUAI | Public reference made under article 153(3) epc to a published international application that has entered the european phase |
Free format text: ORIGINAL CODE: 0009012 |
|
| AK | Designated contracting states |
Kind code of ref document: A2 Designated state(s): AT BE CH DE FR GB IT LI LU NL SE |
|
| PUAL | Search report despatched |
Free format text: ORIGINAL CODE: 0009013 |
|
| AK | Designated contracting states |
Kind code of ref document: A3 Designated state(s): AT BE CH DE FR GB IT LI LU NL SE |
|
| 17P | Request for examination filed |
Effective date: 19890222 |
|
| 17Q | First examination report despatched |
Effective date: 19910304 |
|
| GRAA | (expected) grant |
Free format text: ORIGINAL CODE: 0009210 |
|
| AK | Designated contracting states |
Kind code of ref document: B1 Designated state(s): AT BE CH DE FR GB IT LI LU NL SE |
|
| PG25 | Lapsed in a contracting state [announced via postgrant information from national office to epo] |
Ref country code: SE Effective date: 19930203 Ref country code: NL Effective date: 19930203 Ref country code: IT Free format text: LAPSE BECAUSE OF FAILURE TO SUBMIT A TRANSLATION OF THE DESCRIPTION OR TO PAY THE FEE WITHIN THE PRESCRIBED TIME-LIMIT;WARNING: LAPSES OF ITALIAN PATENTS WITH EFFECTIVE DATE BEFORE 2007 MAY HAVE OCCURRED AT ANY TIME BEFORE 2007. THE CORRECT EFFECTIVE DATE MAY BE DIFFERENT FROM THE ONE RECORDED. Effective date: 19930203 Ref country code: GB Effective date: 19930203 Ref country code: FR Effective date: 19930203 Ref country code: BE Effective date: 19930203 |
|
| REF | Corresponds to: |
Ref document number: 85199 Country of ref document: AT Date of ref document: 19930215 Kind code of ref document: T |
|
| REF | Corresponds to: |
Ref document number: 3587069 Country of ref document: DE Date of ref document: 19930318 |
|
| EN | Fr: translation not filed | ||
| NLV1 | Nl: lapsed or annulled due to failure to fulfill the requirements of art. 29p and 29m of the patents act | ||
| GBV | Gb: ep patent (uk) treated as always having been void in accordance with gb section 77(7)/1977 [no translation filed] |
Effective date: 19930203 |
|
| PG25 | Lapsed in a contracting state [announced via postgrant information from national office to epo] |
Ref country code: AT Effective date: 19930909 |
|
| PG25 | Lapsed in a contracting state [announced via postgrant information from national office to epo] |
Ref country code: LU Free format text: LAPSE BECAUSE OF NON-PAYMENT OF DUE FEES Effective date: 19930930 Ref country code: LI Effective date: 19930930 Ref country code: CH Effective date: 19930930 |
|
| PLBE | No opposition filed within time limit |
Free format text: ORIGINAL CODE: 0009261 |
|
| STAA | Information on the status of an ep patent application or granted ep patent |
Free format text: STATUS: NO OPPOSITION FILED WITHIN TIME LIMIT |
|
| 26N | No opposition filed | ||
| PGFP | Annual fee paid to national office [announced via postgrant information from national office to epo] |
Ref country code: DE Payment date: 19940324 Year of fee payment: 9 |
|
| REG | Reference to a national code |
Ref country code: CH Ref legal event code: PL |
|
| PG25 | Lapsed in a contracting state [announced via postgrant information from national office to epo] |
Ref country code: DE Effective date: 19950601 |