EP0186936A1 - Method and apparatus for evaluating auditory distortions of an audio system - Google Patents
Method and apparatus for evaluating auditory distortions of an audio system Download PDFInfo
- Publication number
- EP0186936A1 EP0186936A1 EP85306211A EP85306211A EP0186936A1 EP 0186936 A1 EP0186936 A1 EP 0186936A1 EP 85306211 A EP85306211 A EP 85306211A EP 85306211 A EP85306211 A EP 85306211A EP 0186936 A1 EP0186936 A1 EP 0186936A1
- Authority
- EP
- European Patent Office
- Prior art keywords
- signal
- produce
- weighting
- series
- weighting means
- Prior art date
- Legal status (The legal status is an assumption and is not a legal conclusion. Google has not performed a legal analysis and makes no representation as to the accuracy of the status listed.)
- Withdrawn
Links
- 238000000034 method Methods 0.000 title claims abstract description 21
- 230000005236 sound signal Effects 0.000 claims abstract description 15
- 238000001914 filtration Methods 0.000 claims description 15
- 238000010586 diagram Methods 0.000 description 12
- 238000002474 experimental method Methods 0.000 description 11
- 238000005259 measurement Methods 0.000 description 11
- 238000011156 evaluation Methods 0.000 description 9
- 239000002131 composite material Substances 0.000 description 6
- 239000003990 capacitor Substances 0.000 description 4
- 230000002238 attenuated effect Effects 0.000 description 3
- 238000012545 processing Methods 0.000 description 3
- 238000012360 testing method Methods 0.000 description 3
- 238000006243 chemical reaction Methods 0.000 description 2
- 238000010348 incorporation Methods 0.000 description 2
- 238000001228 spectrum Methods 0.000 description 2
- 230000003321 amplification Effects 0.000 description 1
- 238000013459 approach Methods 0.000 description 1
- 238000010276 construction Methods 0.000 description 1
- 238000007796 conventional method Methods 0.000 description 1
- 238000013016 damping Methods 0.000 description 1
- 230000007423 decrease Effects 0.000 description 1
- 238000009795 derivation Methods 0.000 description 1
- 238000001514 detection method Methods 0.000 description 1
- 239000000428 dust Substances 0.000 description 1
- 210000005069 ears Anatomy 0.000 description 1
- 230000000694 effects Effects 0.000 description 1
- 238000003780 insertion Methods 0.000 description 1
- 230000037431 insertion Effects 0.000 description 1
- 238000004519 manufacturing process Methods 0.000 description 1
- 238000003199 nucleic acid amplification method Methods 0.000 description 1
- 230000010355 oscillation Effects 0.000 description 1
- 238000000053 physical method Methods 0.000 description 1
- 238000011160 research Methods 0.000 description 1
- 239000004576 sand Substances 0.000 description 1
- 230000035945 sensitivity Effects 0.000 description 1
- 238000010408 sweeping Methods 0.000 description 1
- 230000001360 synchronised effect Effects 0.000 description 1
Images




Classifications
-
- A—HUMAN NECESSITIES
- A61—MEDICAL OR VETERINARY SCIENCE; HYGIENE
- A61B—DIAGNOSIS; SURGERY; IDENTIFICATION
- A61B5/00—Measuring for diagnostic purposes; Identification of persons
- A61B5/12—Audiometering
-
- G—PHYSICS
- G01—MEASURING; TESTING
- G01R—MEASURING ELECTRIC VARIABLES; MEASURING MAGNETIC VARIABLES
- G01R23/00—Arrangements for measuring frequencies; Arrangements for analysing frequency spectra
- G01R23/16—Spectrum analysis; Fourier analysis
- G01R23/20—Measurement of non-linear distortion
Definitions
- the performance, or quality, of an audio system is generally evaluated in terms of “distortions.”
- disortions the “distortions” of an audio system measured by conventional methods such as a “total harmonic distortion”, for example, are typically not consistent with actual human auditory appreciation. It often happens that a listener judges a sound produced by an audio system having greater “total harmonic distortion” to be less distorted than one having less “total harmonic distortion”.
- the apparatus according to this invention also includes a weighting network for the measurement of loudspeaker subharmonics so that the results obtained will best reflect human auditory faculties.
- the quality of a soun, good or bad, has traditionally been represented by the measurement of THD (Total Harmonic Distortion) and/or IMD (Intermodulation Distortion).
- THD and/or IMD measurements are at best mere physical measurements without any human auditory meaning whatsoever; this is because the sensitivity of human auditory faculties increases in response to the number of "orders" of harmonic components.
- THD and/or IMD measurements are at best mere physical measurements without any human auditory meaning whatsoever; this is because the sensitivity of human auditory faculties increases in response to the number of "orders" of harmonic components.
- a further object of this invention is to develop a method for measuring such spurious noises as buzzes or rattles that are inherent in a loudspeaker, and which arises out of deviations, typically thos beyond tolerances, in the production procedure, these spurious noises being an essential item on Q. C. check lists. Traditionally such checking is done by skilled professional workers listening to the sweeping sinusoidal sound waves produced from a loudspeaker. Obviously, however, measurements or evaluations made by an individual listening with bare ears adds a subjective taint to the results, easily making them subject to such dispute that an objective standard cannot be established and automatic measurement operations cannot be instituted.
- This invention offers a novel method and appartus for evaluating the auditory distortion of an audio system, wherein an audio signal, whose auditory distortions are to be evaluated, is filtered by a notch filter to remove its fundamental frequency, and is then fed through a primary weighting network comprising three high pass filters followed by a secondary weighting network.
- the filtered, weighted signal is then amplified, rectified, further filtered, compared by taking the ratio with the magnitude of original signal and finally fed to a display unit to show a figure that represents auditory distortion characteristics consistent with what is actually appreciated by human auditory faculties.
- a loudspeaker 2 rotatable by 180 degrees, is arranged at distance dl from standard microphone 3.
- a human tester 5 stands at distance d2 facing loudspeaker 2, the distance d2 being equal to distance dl, which may be 50 cm.
- Loudspeaker 2 is provided with a harmonic control circuit 4 and standard microphone 3 is provided with sound analyzer 6 including sound pressure level meter 62 and a spectrum analyzer 61, as shown.
- Harmonic control circuit 4 comprises a first frequency synthesizer 41 connected to a first band pass filter 42 for feeding a signal having a fundamental frequency to a mixer 44 through a first variable resistor VR1, or first volume control 43; and a second frequency synthesizer 45 connected to a second band pass filter 46 for feeding a signal having harmonic frequencies to mixer 44 through a second variable resistor VR2 or second volume control 47.
- a power amplifier 48 is provided to amplify the mixed signal produced by mixer 44, and the mixed, amplified signal is then fed to loudspeaker 2 to produce a sound.
- second volume control 47 is set at that point and loudspeaker 2 is again turned to face standard microphone 3, which picks up the sound, including its fundamental and harmonic component, which is then fed to sound analyzer 6 consisting of a spectrum analyzer 61 and a sound pressure level meter 62, so that the contents of the mininal harmonic sound can be measured by spectum analyzer 61.
- the harmonic sound measured is 40 dB SPL (Sound Pressure Level)
- Such an ability can be referred to as the threshold of audition, the point at which a sound, typically the minimum sound of a harmonic component, begins to be detected aurally.
- a circuit which consists of a primary weighting network 20 and a secondary weighting network 24, wherein primary weighting network 20 comprises three high pass filtering units 20A having a filtering circuit composed of a capacitor 21 having a capacitance C and a resister 22 having a resistance R, and an amplifier 23.
- a signal having a frequency fl + 2:fn is applied to the first unit of the three high pass filtering units 20A, 20A, 20A, wherein OR
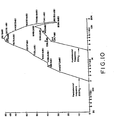
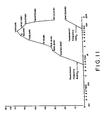
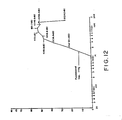
- the circuit shown in Fig. 2 makes a composite weighting network having a composite frequency response which closely matches the frequency response shown in Fig. 8 through Fig. 12. For instance, 50 Hz, the frequency response as a composite result of the circuit shown in Fig. 2 should be the same as or very similar to that of the solid line in Fig. 8.
- the characteristics of each frequency response, as illustrated in Figs. 8 through Figs. 12, resembles the characteristics of the band pass filter; thus enabling one to combine one set of high pass filters with another set of low pass filters, to yield the frequency response response characteristics, as shown in Figs. 8 through Figs. 12.
- the primary weighting network 20 as shown in Fig. 2 therefore essentially consists of the high pass filters mentioned above, while the secondary weighting network 24 in the same illustration is composed of the low pass filters.
- the -3 dB cutoff frequency for such a low pass filter lies between 2 KHz and 12 KHz, preferably of the range of 4.5 KHz through 6 KHz, the relevant roll-off slope being situated between 18 dB/oct. and 150 dB/oct., preferably at 60 dB/oct.
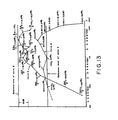
- FIG. 8 A careful study of Figs. 8 through Figs. 12 shows that close conformity with human auditory appreciation is obtained when the frequency response characteristics of the secondary weighting network, as illustrated in Fig. 2, is identical to curve A of Fig. 13.
- the vital point lies in the low pass filter of the secondary weighting network, of which, one embodiment is shown in Fig. 6, whose frequency response corresponds to curve A, of which, the details will be given in a later page.
- the secondary weighting network 24 as shown in Fig. 2 has frequency response characteristics resembling the reverse of the equal-loudness-level contours (Robinson D. W. and R. S. Dadson, Br. J. Applied Physics, 1956, Vo.7, Page 166), like what is shown in Curve A of Fig. 13.
- the signals having been filtered by a circuit exhibited in Fig. 2, will yield an auditory distortion of a magnitude compatible with that of human auditory appreciation.
- Fig. 3 shows a circuit comprising a band pass filter (hereinafter as BPF) 31 and a weighting network, 32. This circuit weights the subharmonic compnent of audio signal to be evaluated.
- BPF band pass filter
- the fundamental frequency of the signal fed to BPF 31 as shown in Fig. 3 is fl, which contains a subharmonic component with its frequency one half of fl, the resonant frequency of BPF 31 has to be exactly one half of fl in order that passage will be permitted to those subharmonic components in the input signal, only whilst ample attenuation is imposed upon all other frequencies.
- the subharmonics thus obtained will be weighted by the weighting filter 32, as shown in Fig. 3.
- the weighting filter 32 in Fig. 3 shall comprise of at least a low pass filter and a high pass filter.
- the frequency response characteristics to be expected of Weighting Filter 32 is best represented in Curve B, of Fig. 13.
- Curve B shows the average outcome of tests taken on 18 individuals with respect to the subharmonic components, and, this is based on the experiments shown in Fig. 1.
- the average of the threshold values of the 18 tested individuals are as follows:
- Fig. 4 shows a block diagram of a first embodiment of the aditory distortion evaluation device of this invention.
- the device comprises a notch filter 401, a primary weighting network 402, a secondary weighting network 403, an amplifier 404, a first rectifier and ripple filter 405, a ratio circuitry 406, a display unit (or meter) 407, and a second rectifier and ripple filter 408.
- the cutoff frequency of -3 dB cause by the value of CR in each segment is 12 times the fundamental frequency fl.
- the secondary weighting network 403 provides for a characteristic frequency response which is virtually a reversal of the above mentioned equal-loudness-level contours, like what is shown in Curve A of Fig. 13.
- an input signal (fl +Hfn) which is to be measured by having its fundamental frequency fl attenuated at Notch Filter 401, the output at the output point, which is for filter 401, point K, which all consist of harmonics alone and is to be weighted for the first time by a primary weighting network, comprising a series of three high pass filters 402, before going to secondary weighting network 403 for a secondary weighting, and then amplified by amplifier 404, rectified by first rectifier 405 for a true r.m.s.
- ratio circuitry 406 AC/DC conversion and further filtered as inputs to the right side terminal of ratio circuitry 406, such a ratio circuitry can be composed of a logarithmic converter, for which the reference input can be considered as the input to the left side terminal of ratio circuity 406, as illustrated in Fig. 4, or else as an input to an analogue divider, by considering the input at the left end of ratio circuitry 406, as the denominator and the other input, at the right end thereof, as the numerator.
- the input signal fl + Lfn is also applied to second rectifier 408 whereby the input signal undergoes a true r.m.s. AC/DC conversion and is filtered before being fed to an input point at the left end of ratio circuitry 406.
- Ratio circuitry 406 will take the ratio of two signals fed into the left and the right ends with the results fed tthe display unit 407 for demonstration, which will be of a truly reflective value to human auditory appreciation, in response to audio distortions, and which is to be referred to as "auditory distortion", according to the present invention, which can be expressed in terms of % or dB.
- the reference value 0 dB of the auditory distortion is defined as follows:
- notch filter 401 as shown in Fig. 4, is not absolutely necessary, except when it is desirous to determine auditory distortion of a level that is lower than 10 dB, bereft of that, the margin of error will become large.
- Fig. 5 shows a block diagram of a second embodiment of the device of this invention, which comprises a level control circuit 504, a notch filter 501, a primary weighting filter 502, a secondary filter 503, an complifier 505, a rectifier 506, and a display unit 507.
- Level control circuit 504 can be of the manual level control mode or automatic level control mode, both meant to convert the level of the input signal fl + ' 1: fn into a constant value.
- the signal voltage at point P would then be a constant value, and, then the rectifier and filter 506 and display unit 507, as shown in Fig. 5, will obtain the same function as do units 408, 405, 406, 407 as shown in Fig. 4 respectively; 402 and 403 shown in Fig. 4, being identical to 502 and 503 shown in Fig. 5; and therefore, as shown in illustrations in Fig. 4 and Fig. 5, will both share like performances, in all respects.
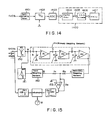
- Fig. 4 and Fig. 5 are most noticeably distinguished from conventional distortion meters in the filtering and weighting of harmonic components, the weighting can be accomplished alternatively by the method of digital procession, for which a block diagram is shown in Fig. 14.
- FIG. 14 The illustrations of Fig. 14 include an anti- aliasing filter 1401, a sample/hold circuitry S/H 1402, an analogue to digital converter 1403 and a data processing unit 1400 embodying both hardward and softward which include digital filter 1404, r.m.s. converter program 1406 and display unit 1407.
- the incoming signal fl + rfn will go through anti- aliasing filter 1401, S/H 1402 and ADC 1403 for digitization, to be further subject to treatment by digital filter 1404, that is, weighting processing, to yield a weighted data 1405, prior to being converted by said r.m.s. converter program to yield corresponding r.m.s. value and to be demonstrated by display unit 1407.
- the frequency response from the digital filter 1404, as shown in Fig. 14, shall be identical to a composite frequency response that is a combination of the output from the primary weighting network 20 and the secondary weighting network 24 as shown in Fig. 2, but if the signals to be evaluated contains subharmonic components, then digital filter 1404's performance shall correspond to that of BPF 31, as shown in Fig. 3 and get the. subharmonic components, then, such subharmonic components will be weighted, by means of the frequency response characteristics, produce from the third weighting network 32 as shown in Fig. 3.
- the circuit serves as a means of weighting the subharmonic component, so by connecting the circuit shown in Fig. 3 to the circuit shown in Fig. 4, one will get a circuit that is capable of determing a subharmonic component, as well as harmonic components of higher orders; an example of this is shown in Fig. 15.
- Fig. 15 illustrates a circuit that is entirely identical to that circuit shown in Fig. 4, with the additional incorporation of a band pass filter 151, a third weighting network 152 and a summing amplifier 153.
- incoming signal fl + ⁇ fn will have its fundamental frequency fl amply attenuated by notch filter 150 before being fed to the Band pass filter 151 where only the subharmonic component will be fed through; and higher order harmonic components will be attenuated, the resonate frequency of the Band pass filter 151 should be exactly half of fl.
- the subharmonic component will be weighted by weighting filter 152, before being fed to Summing amplifier 153 via Rl for amplification.
- the frequency response curve of the weighting filter 152 should be the same as curve B, shown in Fig. 13.
- the summation of the rejection ratio of both notch filter 150 and band pass filter 151 relative to the fundamental frequency fl is preferable to set the summation of the rejection ratio of both notch filter 150 and band pass filter 151 relative to the fundamental frequency fl, individually and severally, to be of a value that is greater than -80 dB.
- the primary weighting network invariably adopted a three-order RC high pass filter arrangent.
- a four-order or even five-order high pass filter for instance, a four-order stage can be comprised of two cascaded state variable filters, where it is intended to determine spurious noises produced by a loudspeaker, this is because a loudspeaker will usually suffer ample distortions for harmonics of the second or even third order, especially in frequencies lower than its natural resonant frequency; but, as a matter of fact, distortion of that nature is used to be tolerated by loudspeaker manufacturers, whereas spurious noises, owing to sand or dust that are carried into the gap of a voice coil, are typically of harmonics of higher orders, which would be less tolerable so it has been proposed to employ high pass flters of the fourth or fifth order, with a view to attenuate amply harmonic components of lower orders, while attenuating much less harmonics of higher orders, such a
- the high pass filters that is employed in the illustrations of Fig. 4, Fig. 5 or Fig. 15 are alike, and all of the RC mode through manual tuning, and employment of a synchronous tracking filter will permit continuous measurement of auditory distortion for the entire audio frequency range, and also a recording of the curve of variation of auditory distortion, by means of a level recorder, using the frequency as the abscissa.
- the notch filter 150, band pass filter 151 and high pass filter, as illustrated in Fig. 15 must all be of type VCF (Voltage Controlled Filter), a typical instance for the execution of such a VCF is an embodiment using state variable filters, having three outputs each for the high pass filter, low pass filter and the band pass filter respectively; but if the high pass and low pass output are summed together by a summing amplifier, then the output of the summing amplifier will account for a notch filter.
- the state variable filter there are incorporated two integrators, each provided with a pair of RC combinations to serve to determine the resonant frequency. It is permissible to replace both resistors in such RC combinations with two analogue multipliers to constitute for a voltage controld filter.
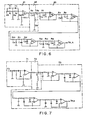
- FIG. 6 What is shown in Fig. 6 is one embodiment of the secondary weighting network, as illustrated in Fig. 2, Fig. 4, Fig. 5, or Fig. 15.
- High pass filter 81 comprises capacitors Cl and C2, resisters Rl --- R4 and an amplifier Al; and band dip filter 82 comprises resisters R5 and Rs, a capacitor C3, and an inductor Ll; and low pass filter 83 comprises resisters R6 --- R15, capacitors C4 to C13, and amplifiers A2 --- A5.
- the purpose of the circuit, as shown in Fig. 6, is to produce a composite frequency response that will best correspond to the Curve A, as shown in Fig. 13.
- frequency response for frequencies lower than 4 KHz are achieved by high pass filters 81, whilst the dip in frequency response for frequency ranging from 500 Hz through 3 KHz are achieved through band dip filter 82, and that frequency response for frequencies higher than 4 KHz are achieved through low pass filters 83.
- the frequency response remains free from any substantial variation whatsoever, for frequencies lower than 4 KHz, but will decline sharply, which means a dractic attenuation.
- the roll-off namely, the sharp declination that is the frequency response for frequencies higher than 4 KHz, should deserve much considerations, and the reasons are as follows:
- the low pass filters 83 serves to cause roll-offs in'the frequency responses for frequencies higher than 4 KHz, so that low pass filters 83 are of prime interest, in the circuit represented in Fig. 6, and if both high pass filter 81 and band dip filter 82 are removed so that low pass filters 83 alone are left, and would but incur an additional tolerance of plus/minus 4.5 dB in the frequency response for frequencies ranging from 100 Hz through 6.6 KHz, as described above.
- t is preferable to employ the circuit, as illustrated in Fig. 6, in order to obtain the frequency response exactly as depicted in Curve A of Fig. 13; by doing so, a weighting performance that can best match human auditory appreciation, will be effected.
- the secondary weighting network as described above, is adapted for weighting harmonic components of higher orders.
- a third weighting network serving as a weighting network for subharmonic components exclusively, which is another embodiment provided for, according to the invention, it is, as shown in Fig. 7.
- the third weighting network comprises of a series of high pass filters 71, a band dip filter 72 and a series of low pass filters 73, which, on the whole, resembles very much what is shown in Fig. 6.
- the frequency response of the circuit, as shown in Fig. 7, must correspond closely to the Curve B, as shown in Fig. 13.
- the low pass filters 71, as shown in Fig. 7, the -3 dB cutoff frequency lies between 800 Hz and 3 KHz, from which the frequency response for low frequency band, that is, frequencies lower than 1 KHz, as represented in Curve B of Fig.
- Band dip filter 72 serves to produce such a form of frequency response, in which a dip prevails, for frequencies of 1 KHz through 4 KHz, like what is shown in Curve B, and that low pass filters 73 are accountable for the frequency response for frequencies higher than 5 KHz, as covered in Curve B; while it has to be stressed that the -3 dB cutoff frequency for low pass filters 73 should be somewhere beten 3 KHz and 14 KHz.
- the band dip filter 72 as seen in Fig. 7, is not absolutely indispensable, which, if eliminated so that high pass filters 71 and low pass filters 73 remain in the circuit, then the composite frequency response to result therefrom, would be as if resulting from one band pass filter only. That is admittedly less than the precision requirement, but, when carefully designed, the result of a maximum tolerance of plus/minus 5 dB would be obtained, and that, will nevertheless be acceptable for usage.
- the device for measuring auditory distortions may be used to evaluate preamplifiers, loudspeakers, headphones, power amplifiers, equalizers etc., so as to further improve on the accuracy of the evaluation.
- the magnitude of the auditory distortion data, measured or evaluated, thereby, will truly serve as an index representative of the amplitudes of distortions, as it is apprehended by human auditory faculties, and is distinguished from conventional approaches, regarding the evaluation of audio distortions, which can only yield results bearing physical meaning, without being representative of the true feelings apprehended by human auditory faculties.
Landscapes
- Physics & Mathematics (AREA)
- Health & Medical Sciences (AREA)
- Life Sciences & Earth Sciences (AREA)
- Engineering & Computer Science (AREA)
- Heart & Thoracic Surgery (AREA)
- Surgery (AREA)
- Audiology, Speech & Language Pathology (AREA)
- Biophysics (AREA)
- Pathology (AREA)
- Biomedical Technology (AREA)
- Acoustics & Sound (AREA)
- Medical Informatics (AREA)
- Molecular Biology (AREA)
- Multimedia (AREA)
- Animal Behavior & Ethology (AREA)
- General Health & Medical Sciences (AREA)
- Public Health (AREA)
- Veterinary Medicine (AREA)
- Nonlinear Science (AREA)
- Mathematical Physics (AREA)
- General Physics & Mathematics (AREA)
- Tone Control, Compression And Expansion, Limiting Amplitude (AREA)
- Measurement Of Mechanical Vibrations Or Ultrasonic Waves (AREA)
Applications Claiming Priority (2)
| Application Number | Priority Date | Filing Date | Title |
|---|---|---|---|
| GB8425829 | 1984-10-12 | ||
| GB08425829A GB2165654B (en) | 1984-10-12 | 1984-10-12 | Method and apparatus for evaluating auditory distortions of an audio system |
Publications (1)
| Publication Number | Publication Date |
|---|---|
| EP0186936A1 true EP0186936A1 (en) | 1986-07-09 |
Family
ID=10568096
Family Applications (1)
| Application Number | Title | Priority Date | Filing Date |
|---|---|---|---|
| EP85306211A Withdrawn EP0186936A1 (en) | 1984-10-12 | 1985-09-02 | Method and apparatus for evaluating auditory distortions of an audio system |
Country Status (4)
| Country | Link |
|---|---|
| US (1) | US4706290A (da) |
| EP (1) | EP0186936A1 (da) |
| DK (1) | DK392385A (da) |
| GB (1) | GB2165654B (da) |
Cited By (4)
| Publication number | Priority date | Publication date | Assignee | Title |
|---|---|---|---|---|
| DE4008298A1 (de) * | 1990-03-15 | 1991-09-19 | Veba Kraftwerke Ruhr | Oberschwingungsindikator |
| DE10043894A1 (de) * | 2000-07-28 | 2002-02-07 | Rohde & Schwarz | Verfahren und Messvorrichtung zur Messung des Spektrums in Nachbarkanälen |
| US6744247B2 (en) | 2000-07-28 | 2004-06-01 | Rohde & Schwarz Gmbh & Co. Kg | Method and measuring device for measuring the spectra in adjacent channels |
| RU2615016C2 (ru) * | 2015-09-07 | 2017-04-03 | Федеральное государственное бюджетное образовательное учреждение высшего образования "Санкт-Петербургский государственный институт кино и телевидения" (СПбГУКиТ) | Устройство для измерения слухоадаптированных гармонических искажений электрического сигнала |
Families Citing this family (13)
| Publication number | Priority date | Publication date | Assignee | Title |
|---|---|---|---|---|
| US5247458A (en) * | 1990-09-11 | 1993-09-21 | Audio Precision, Inc. | Method and apparatus for testing a digital system for the occurrence of errors |
| KR950010340B1 (ko) * | 1993-08-25 | 1995-09-14 | 대우전자주식회사 | 시간 매스킹 현상을 이용한 오디오 신호의 왜곡 측정장치 |
| KR970005131B1 (ko) * | 1994-01-18 | 1997-04-12 | 대우전자 주식회사 | 인간의 청각특성에 적응적인 디지탈 오디오 부호화장치 |
| US7577263B2 (en) * | 2004-01-19 | 2009-08-18 | Nxp B.V. | System for audio signal processing |
| RU2274868C2 (ru) * | 2004-05-19 | 2006-04-20 | Гарри Романович Аванесян | Способ и устройство для оценки и индикации искажений выходного сигнала усилителей звуковой частоты (индикация перегрузки) |
| JP2009044268A (ja) * | 2007-08-06 | 2009-02-26 | Sharp Corp | 音声信号処理装置、音声信号処理方法、音声信号処理プログラム、及び、記録媒体 |
| BR112013011312A2 (pt) * | 2010-11-10 | 2019-09-24 | Koninl Philips Electronics Nv | método para estimar um padrão em um sinal (s) tendo um componente periódico, semiperiódico ou virtualmente periódico, dispositivo para estimar um padrão em um sinal (s) tendo um componente periódico, semiperiódico ou virtualmente periódico e programa de computador |
| US8712066B1 (en) | 2013-03-14 | 2014-04-29 | Rockford Corporation | Audio signal clip detection |
| GB201518240D0 (en) | 2015-10-15 | 2015-12-02 | Rolls Royce Plc | A method of performing real time decomposition of a signal into components |
| US10397692B2 (en) * | 2017-03-08 | 2019-08-27 | Thomas A. Janes | Multi-driver array audio speaker system |
| US10524052B2 (en) * | 2018-05-04 | 2019-12-31 | Hewlett-Packard Development Company, L.P. | Dominant sub-band determination |
| JP7379988B2 (ja) * | 2019-09-20 | 2023-11-15 | 株式会社ソシオネクスト | 基音周波数決定装置、疑似低音処理装置、基音周波数決定方法および音響処理方法 |
| CN112133328B (zh) * | 2020-08-03 | 2023-07-25 | 北京百度网讯科技有限公司 | 音频数据的测评信息生成方法和装置 |
Citations (1)
| Publication number | Priority date | Publication date | Assignee | Title |
|---|---|---|---|---|
| DD152425A1 (de) * | 1980-07-28 | 1981-11-25 | Bernhard Mueller | Einrichtung zur messung von strom-und spannungsoberschwingungen in elektroenergieversorgungsnetzen |
Family Cites Families (4)
| Publication number | Priority date | Publication date | Assignee | Title |
|---|---|---|---|---|
| GB1169706A (en) * | 1966-09-29 | 1969-11-05 | English Electric Co Ltd | An Electrical Fault Detector |
| US3594506A (en) * | 1968-04-01 | 1971-07-20 | Columbia Broadcasting Systems | Loudness level indicator |
| US3696206A (en) * | 1970-11-27 | 1972-10-03 | Du Pont | Audio dosimeter |
| US4307385A (en) * | 1978-11-22 | 1981-12-22 | Sue Ann Evans | Noise monitoring apparatus |
-
1984
- 1984-10-12 GB GB08425829A patent/GB2165654B/en not_active Expired
-
1985
- 1985-08-29 DK DK392385A patent/DK392385A/da not_active Application Discontinuation
- 1985-09-02 EP EP85306211A patent/EP0186936A1/en not_active Withdrawn
- 1985-09-04 US US06/772,457 patent/US4706290A/en not_active Expired - Fee Related
Patent Citations (1)
| Publication number | Priority date | Publication date | Assignee | Title |
|---|---|---|---|---|
| DD152425A1 (de) * | 1980-07-28 | 1981-11-25 | Bernhard Mueller | Einrichtung zur messung von strom-und spannungsoberschwingungen in elektroenergieversorgungsnetzen |
Cited By (4)
| Publication number | Priority date | Publication date | Assignee | Title |
|---|---|---|---|---|
| DE4008298A1 (de) * | 1990-03-15 | 1991-09-19 | Veba Kraftwerke Ruhr | Oberschwingungsindikator |
| DE10043894A1 (de) * | 2000-07-28 | 2002-02-07 | Rohde & Schwarz | Verfahren und Messvorrichtung zur Messung des Spektrums in Nachbarkanälen |
| US6744247B2 (en) | 2000-07-28 | 2004-06-01 | Rohde & Schwarz Gmbh & Co. Kg | Method and measuring device for measuring the spectra in adjacent channels |
| RU2615016C2 (ru) * | 2015-09-07 | 2017-04-03 | Федеральное государственное бюджетное образовательное учреждение высшего образования "Санкт-Петербургский государственный институт кино и телевидения" (СПбГУКиТ) | Устройство для измерения слухоадаптированных гармонических искажений электрического сигнала |
Also Published As
| Publication number | Publication date |
|---|---|
| DK392385D0 (da) | 1985-08-29 |
| GB2165654B (en) | 1988-05-25 |
| US4706290A (en) | 1987-11-10 |
| DK392385A (da) | 1986-04-13 |
| GB8425829D0 (en) | 1984-11-21 |
| GB2165654A (en) | 1986-04-16 |
Similar Documents
| Publication | Publication Date | Title |
|---|---|---|
| US4706290A (en) | Method and apparatus evaluating auditory distortions of an audio system | |
| Churcher et al. | The performance of noise meters in terms of the primary standard | |
| US11528558B2 (en) | Method and an audio processing unit for detecting a tone | |
| JPH03500583A (ja) | オーディオ信号処理システムを点検する装置 | |
| Katalin | Studying noise measurement and analysis | |
| Aarts | A comparison of some loudness measures for loudspeaker listening tests | |
| Cabrera et al. | Increasing robustness in the calculation of the speech transmission index from impulse responses | |
| Michael et al. | Noise measurement | |
| US4344028A (en) | Testing device for low-frequency amplifiers | |
| CN118243214A (zh) | 一种测量环境噪音中可听音调的测试方法 | |
| Ballou | A Sound Engineers Guide to Audio Test and Measurement | |
| Bodlund | On the use of the integrated impulse response method for laboratory reverberation measurements | |
| JPS61107900A (ja) | オ−デイオシステムの可聴歪みを評価するための方法および装置 | |
| Bauer et al. | A loudness-level monitor for broadcasting | |
| US3621404A (en) | Signal level control instrument for sound transmission systems | |
| US5134657A (en) | Vocal demodulator | |
| Kalbitz | Effect of material changes on the total harmonic distortions caused by aluminum electrolytic capacitors | |
| Morrical et al. | The electrical and acoustical performance of some commercial audiometers | |
| Burnett | A new method for the measurement of nonlinear distortion using a random noise test signal | |
| JP2963030B2 (ja) | オーディオアンプのスイッチングノイズ測定装置 | |
| Townsend et al. | Comparison of Total Harmonic Distortion Measures among Hearing Aid Test Systems | |
| Tachibana et al. | A method of evaluating the loudness of isolated impulsive sounds with narrow frequency components | |
| Lin | Measurement of auditory distortion with relation between harmonic distortion and human auditory sensation | |
| Berth-Jones | Intermodulation distortion—its significance | |
| SCHWEITZER et al. | Nonlinear distortion in hearing aids: the need for reevaluation of measurement philosophy and technique |
Legal Events
| Date | Code | Title | Description |
|---|---|---|---|
| PUAI | Public reference made under article 153(3) epc to a published international application that has entered the european phase |
Free format text: ORIGINAL CODE: 0009012 |
|
| AK | Designated contracting states |
Kind code of ref document: A1 Designated state(s): AT DE FR IT NL |
|
| 17P | Request for examination filed |
Effective date: 19860704 |
|
| 17Q | First examination report despatched |
Effective date: 19880321 |
|
| STAA | Information on the status of an ep patent application or granted ep patent |
Free format text: STATUS: THE APPLICATION IS DEEMED TO BE WITHDRAWN |
|
| 18D | Application deemed to be withdrawn |
Effective date: 19880802 |