EP0254380A2 - Méthode d'analyse pour une distribution de tailles de particules - Google Patents
Méthode d'analyse pour une distribution de tailles de particules Download PDFInfo
- Publication number
- EP0254380A2 EP0254380A2 EP87301393A EP87301393A EP0254380A2 EP 0254380 A2 EP0254380 A2 EP 0254380A2 EP 87301393 A EP87301393 A EP 87301393A EP 87301393 A EP87301393 A EP 87301393A EP 0254380 A2 EP0254380 A2 EP 0254380A2
- Authority
- EP
- European Patent Office
- Prior art keywords
- particle size
- distribution
- size distribution
- estimated
- analyzing
- Prior art date
- Legal status (The legal status is an assumption and is not a legal conclusion. Google has not performed a legal analysis and makes no representation as to the accuracy of the status listed.)
- Granted
Links
Images





Classifications
-
- G—PHYSICS
- G01—MEASURING; TESTING
- G01N—INVESTIGATING OR ANALYSING MATERIALS BY DETERMINING THEIR CHEMICAL OR PHYSICAL PROPERTIES
- G01N15/00—Investigating characteristics of particles; Investigating permeability, pore-volume or surface-area of porous materials
- G01N15/10—Investigating individual particles
-
- G—PHYSICS
- G01—MEASURING; TESTING
- G01N—INVESTIGATING OR ANALYSING MATERIALS BY DETERMINING THEIR CHEMICAL OR PHYSICAL PROPERTIES
- G01N15/00—Investigating characteristics of particles; Investigating permeability, pore-volume or surface-area of porous materials
- G01N15/01—Investigating characteristics of particles; Investigating permeability, pore-volume or surface-area of porous materials specially adapted for biological cells, e.g. blood cells
-
- G—PHYSICS
- G01—MEASURING; TESTING
- G01N—INVESTIGATING OR ANALYSING MATERIALS BY DETERMINING THEIR CHEMICAL OR PHYSICAL PROPERTIES
- G01N15/00—Investigating characteristics of particles; Investigating permeability, pore-volume or surface-area of porous materials
- G01N15/02—Investigating particle size or size distribution
Definitions
- the present invention relates to a method for measuring and analyzing particle size distributions, wherein the particles include blood corpuscles, various cells, latex particles or any other fine particles.
- the blood platelets are in a log-normal distribution, and then those which are not in agreement with the presumption are considered as abnormal, which is commonly called a 'Curve Fit' method.
- the feature of the first-mentioned prior art method for red blood cells resides in the indication of the width of the distribution on presumption that the particle size distribution of red blood cells is constantly uniform.
- the blood corpuscles are readily affected by dirt and dead cells. For these reasons the inaccurate measurement may result.
- the blood corpuscles unavoidably contain noise components, so that the thresholds are used to count the number of corpuscles. Nevertheless, when a noise component and a corpuscle overlap or two or more corpuscles overlap each other, the resulting measurement may be inaccurate.
- the 'Curve Fit' method determines the abnormality of blood platelets on presumption that they are in the log-normal distribution but does not represent the degree of abnormality numerically, that is, in an objective manner.
- a method for measuring and analyzing particle size distribution comprising: collecting an analyzing particle size distribution from a particle size measuring instrument; setting up an estimated particle size distribution as a theoretical distribution; comparing between the analyzing distribution and the estimated distribution so as to obtain the difference therebetween; and making the difference a characteristic parameter for the analyzing particle size distribution.
- a method for measuring and analyzing particle size distribution comprising: collecting an analyzing particle size distribution from a particle size measuring instrument; setting up an estimated particle size distribution as a theoretical distribution; comparing between the analyzing distribution and the estimated distribution so as to set up a characteristic parameter representing the difference therebetween; and classifying the analyzing particle size distribution depending upon both the characteristic parameter and the type of the estimated distribution or else either of them.
- a method for measuring and analyzing particle size distribution comprising: collecting an analyzing particle size distribution from a particle size measuring instrument; setting up the logarithm of the frequency of the distribution so as to determine the difference between the adjacent values thereof; providing a window so as to find out an area within the window in which the difference becomes linear; calculating a mean value and a standard deviation from the linear portion for an estimated particle size distribution; and introducing the calculated mean value and standard deviation into an expression for a theoretical distribution so as to determine the estimated particle size distribution.
- a preferred embodiment provides a system for measuring and analyzing particle size distribution accurately and readily so as to serve the practical purposes, such as clinical diagnosis.
- a preferred embodiment provides a system for measuring and analyzing particle size distribution, the system being carried out in a limited space without employing a large-size instrumental aid.
- the instrument referred to herein is a device which allows a suspension containing fine particles to pass through the minute pores produced therein, detects the particles by electric or optical differences between the liquid and the particles, generates pules in proportion to the amplitude (volume) of the particles, and converts the signals into a particle size distribution.
- X and g(x) are substituted by nx and n f(x), respectively.
- g(x) is expressed by a quadratic expression with respect to X.
- g(x) is differentiated as follows:
- g ⁇ (x) is expressed by a linear expression which intersects the X axis at ⁇ - ⁇ 2 and which is inclined thereto at - . From this the value of g ⁇ (x) is obtained, on the basis of which the mean value ⁇ and the standard deviation ⁇ are calculated. In this way the log-normal distribution curve is estimated.
- D ⁇ (
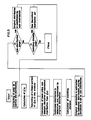
- the blood corpuscle pulses proportional to the volume are converted into a volume distribution by a comparator, the result of which is stored in a memory.
- the stored data is smoothed, which means that the noises contained in the particle size distribution are removed so as to facilitate the analysis of particle size.
- the natural logarithm is obtained for the particle size distribution, and the balance between the adjacent values is calculated to determine the value of g ⁇ (x).
- a window (a range in which a treatment is applied to the X axis) is set so as to find a main portion of the given particle size distribution, and in this window a point where the g ⁇ (x) becomes linear or approximately linear is determined.
- the value of the linear portion of g ⁇ (x) is expressed by a regression line equation, and from the inclination and segment of the equation the mean value of the estimated particle size distribution and the standard deviation are calculated. These values obtained are introduced in the log-normal distribution, and the maximum value thereof is normalized by the original particle size distribution; that is, the maximum values of the original particle size distribution and estimated distribution are equalized, thereby facilitating the comparison therebetween. Then the difference in area between the two distributions is calculated to determine the matching distance (D).
- the original particle size distribution is balanced by the estimated distribution to form a sub-distribution. If this sub-distribution has a sufficiently large area to allow another estimated distribution to be determined, the sub-distribution can be employed as the fresh original particle size distribution. This procedure is repeated.
- the dotted lines show the estimated particle size distribution.
- the graph shows a relationship between the matching distance (D) and the number of specimens with respect to red blood cells, wherein the particle size distribution is a log-normal distribution.
- the estimated particle size distribution is other than a log-normal distribution.
- the difference between the original particle size distribution and the estimated one can be represented by several parameters obtained from the following equation, wherein P is a matching ratio:
- Example 2 the method of the present invention was applied to the analysis of particle size distributions of red blood cells, employing a normal distribution and a log-normal distribution.
- the normal distribution is given by the following equation: wherein ⁇ is a mean value, and ⁇ a standard deviation g(x) is substituted by n f(x).
- g ⁇ (x) is expressed by a linear expression which intersects the X axis at ⁇ 2, and which is inclined thereto at - . From this the mean value ⁇ and standard deviation ⁇ are calculated. In this way the normal log-distribution curve is estimated:
- blood corpuscles pulses proportional to the volumes are converted into volume distributions by using a comparator, and stored in a memory. Then the data stored therein is smoothed so as to facilitate the analysis of particle size distribution. The smoothing is intended to remove noise components from the particle size distribution. Then the natural logarithm of each distribution is obtained so as to calculate the difference between the adjacent values. In this way g ⁇ (x) is calculated.
- a suitable window is set to find a main portion of the given distribution, and in this window a point where g ⁇ (x) becomes linear or almost linear is determined. This point is the part of the particle size distribution which is identical with the normal distribution.
- a regression line equation of this linear portion of g ⁇ (x) is formulated, and from the inclination and segment of the curve the mean value and standard deviation of the estimated distribution are calculated. Then the mean value and standard deviation are introduced in the normal distribution, and the maximum value obtained is normalized by the original particle size distribution; that is, the maximum values of the original particle size distribution and estimated distribution are equalized, thereby facilitating the comparison therebetween. Then the difference in area between the two distributions is calculated to obtain a matching distance (D).
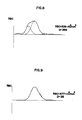
- Figures 6, 7 and 8 show various types of graphs obtained when normal distributions are theoretically applied to analyze red blood cells; hereinafter these types will be referred to as Type I, Type II and Type III, respectivley.
- the graph shown in Figure 6 almost overlaps the normal distribution.
- the dotted lines show the estimated particle size distribution which overlaps the original distribution to an undiscernible extent.
- the graph shown in Figure 7 shows a relatively large matching distance (D) and also shows that the distribution (indicated by the dotted lines) estimated from the normal distribution does not overlap the original distribution.
- the graph shown in Figure 9 has been obtained to estimate a particle size distribution by the use of a log-normal distribution as a theoretical distribution.
- This graph shows that the estimted distribution (incidated by the dotted lines) and the log-normal distribution almost exactly overlap each other. It will be appreciated that the matching distance (D) is about 1/6 as short as in the case of the normal distribution.
- Figure 8 shows an example where there is a large space remaining after the estimation was made by a single normal distribution, thereby allowing of a further estimation by the use of normal distribution.
- two normal distributions are allowed to estimate the distributions. This type of distribution is normally formed by the addition of the two normal distributions.
- the particle size distribution is classified by a theoretical distribution or else by a matching distance (D), which means that they can be useful as new parameters for diagnosing blood.
- the matching ratio (P) is expressed by the following equation:
- X and g(x) are substituted by nX and nf(x), respectively.
- g(x) is expressed by a quadratic expression with respect to X.
- g(x) is differentiated as follows:
- g ⁇ (x) is expressed by a linear expression which intersects the X-axis at ⁇ - ⁇ 2 and is inclined thereto at - .
- the mean value ⁇ and the standard deviation ⁇ are calculated, thereby estimating a log-normal distribution.
- blood corpuscle pulses proportional to the volumes are converted into volume distribution by a comparator, and stored in a memory.
- the particle size distribution data stored therein are smoothed so as to facilitate the analysis of particle size distribution, which means that the noise components in the distribution are removed.
- the natural logarithm of the frequencies of particle size distribution, and the difference between the adjacent distributions is calculated.
- the calculated differences are divided by a balance between the logarithms of the corresponding ranks.
- the quotients are plotted against the logarithm of each rank, which is shown in Figure 11. In this way g ⁇ (x) is calculated.
- Figure 12 shows an example in which g ⁇ (x) has several linear portions.
- g ⁇ (x) has several linear portions.
- To determine the linear portions of g ⁇ (x) a window is provided and shifted along the X-axis. In this way linear or approximately linear portions are extrapolated, and from the intersections of the X- and Y-axis the mean value and standard deviation are calculated. Then these values are introduced in the log-normal distribution and the maximum value is normalized by the original particle size distribution; that is, the maximum value is equalized to that of the original particle size distribution, thereby facilitating the comparison between the original particle size distribution and the estimated one. Then the frequence of the estimated particle size distribution is determined.
- the plurality of linear portions of g ⁇ (x) leads to a plurality of theoretical distrubutions. Therefore, on the basis of each linear portion an estimated distribution and the frequency are obtained. The obtained data is output to a CRT, printer or host
- the graph of Figure 13 shows an example where a red blood cell portion overlaps a blood platelet (PLT).
- the left-hand section shows the PLT portion, and the theoretical distribution is indicated by dotted lines.
- the right-hand section is the red blood cell portion, whose graph looks like a straight line because of the curve being cut away at a certain value.
- the measured value obtained from the theoretical distribution was 163,000 PLTs, whereas that obtained by an ordinary threshold was 217,000 PTLs.
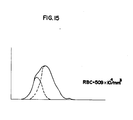
- the blood in this example contained different sizes of blood corpuscles because of transfusion, having 5,090,000 red blood cells (RBC), wherein the larger section had 3,660,000 RBCs and the smaller section had 1,420,000 RBCs.
- RBC red blood cells
- the theoretical distribution can be a normal distribution or other.
- the method of the present invention can be equally applied to the analysis of latex particles, many kinds of cells or any other extremely fine particles.
Landscapes
- Chemical & Material Sciences (AREA)
- Dispersion Chemistry (AREA)
- Physics & Mathematics (AREA)
- Health & Medical Sciences (AREA)
- Life Sciences & Earth Sciences (AREA)
- Analytical Chemistry (AREA)
- Biochemistry (AREA)
- General Health & Medical Sciences (AREA)
- General Physics & Mathematics (AREA)
- Immunology (AREA)
- Pathology (AREA)
- Investigating Or Analysing Biological Materials (AREA)
Applications Claiming Priority (6)
| Application Number | Priority Date | Filing Date | Title |
|---|---|---|---|
| JP17642386A JPH0629838B2 (ja) | 1986-07-25 | 1986-07-25 | 粒度分布解析法 |
| JP176425/86 | 1986-07-25 | ||
| JP17642586A JPH0629840B2 (ja) | 1986-07-25 | 1986-07-25 | 粒度分布解析法 |
| JP176423/86 | 1986-07-25 | ||
| JP176424/86 | 1986-07-25 | ||
| JP17642486A JPH0629839B2 (ja) | 1986-07-25 | 1986-07-25 | 粒度分布解析法 |
Publications (3)
| Publication Number | Publication Date |
|---|---|
| EP0254380A2 true EP0254380A2 (fr) | 1988-01-27 |
| EP0254380A3 EP0254380A3 (en) | 1989-11-29 |
| EP0254380B1 EP0254380B1 (fr) | 1994-05-04 |
Family
ID=27324258
Family Applications (1)
| Application Number | Title | Priority Date | Filing Date |
|---|---|---|---|
| EP87301393A Expired - Lifetime EP0254380B1 (fr) | 1986-07-25 | 1987-02-18 | Méthode d'analyse pour une distribution de tailles de particules |
Country Status (4)
| Country | Link |
|---|---|
| US (1) | US4817446A (fr) |
| EP (1) | EP0254380B1 (fr) |
| CA (1) | CA1276299C (fr) |
| DE (1) | DE3789736T2 (fr) |
Cited By (2)
| Publication number | Priority date | Publication date | Assignee | Title |
|---|---|---|---|---|
| EP0512664A3 (en) * | 1991-05-09 | 1993-04-28 | Toa Medical Electronics Co., Ltd. | Method of partitioning particle size distribution datum |
| US7043394B2 (en) | 2002-04-25 | 2006-05-09 | Nomura Micro Science Co., Ltd. | Method and device for measuring fine particles in ultrapure water |
Families Citing this family (10)
| Publication number | Priority date | Publication date | Assignee | Title |
|---|---|---|---|---|
| US5187673A (en) * | 1991-02-05 | 1993-02-16 | Edward L. Carver, Jr. | Method and apparatus for determining the distribution of constituent subpopulations within a population of particles having overlapping subpopulations |
| US5452237A (en) * | 1994-02-28 | 1995-09-19 | Abbott Laboratories | Coincidence error correction system for particle counters |
| JPH08266887A (ja) * | 1995-03-31 | 1996-10-15 | Fuji Photo Film Co Ltd | マイクロカプセルの製造における粒径の自動測定制御方法およびその装置 |
| US6535836B1 (en) | 2000-09-29 | 2003-03-18 | Coulter International Corp. | Method for the analysis of abnormal particle populations |
| US6873725B2 (en) * | 2002-09-09 | 2005-03-29 | Coulter International Corp. | Simultaneous measurement and display of 3-D size distributions of particulate materials in suspensions |
| EP1618414A2 (fr) * | 2003-03-13 | 2006-01-25 | ExxonMobil Upstream Research Company | Procede de prediction de la granulometrie a partir de l'epaisseur d'un gisement |
| US20070054797A1 (en) * | 2003-08-09 | 2007-03-08 | Thomas Ronald J | Siliceous clay slurry |
| US7091148B2 (en) * | 2003-08-09 | 2006-08-15 | H.C. Spinks Clay Company, Inc. | Silicious clay slurry |
| US7105466B2 (en) * | 2003-08-09 | 2006-09-12 | H.C. Spinks Clay Company, Inc. | Siliceous clay slurry |
| CN113241177B (zh) * | 2021-05-19 | 2024-05-10 | 上海宝藤生物医药科技股份有限公司 | 一种评估免疫力水平的方法、装置、设备及存储介质 |
Family Cites Families (15)
| Publication number | Priority date | Publication date | Assignee | Title |
|---|---|---|---|---|
| US3449567A (en) * | 1967-01-23 | 1969-06-10 | Freeport Sulphur Co | Apparatus and process for determining particle size by x-ray absorption analysis |
| US3812335A (en) * | 1970-12-02 | 1974-05-21 | Coulter Electronics | Apparatus for obtaining statistical indices and analyzing the same and method |
| US3779070A (en) * | 1971-11-23 | 1973-12-18 | Autometrics Co | Particle size and percent solids monitor |
| US3877311A (en) * | 1973-10-19 | 1975-04-15 | Nippon Steel Corp | Method for sieving a sample of particulate materials from a sintering charge |
| US3944797A (en) * | 1974-08-06 | 1976-03-16 | Coulter Electronics, Inc. | Method and apparatus for determining the correct percentiles of the size distribution of a particulate system |
| US4329053A (en) * | 1975-02-26 | 1982-05-11 | Nasa | Frequency-scanning particle size spectrometer |
| GB1538225A (en) * | 1975-02-28 | 1979-01-10 | Nat Res Dev | Methods and apparatus for analysing frequency distributions |
| DE2812470A1 (de) * | 1977-09-15 | 1979-03-22 | Becton Dickinson Co | Verfahren und vorrichtung zur genauen zaehlung von blutkoerperchen o.dgl. |
| ES485470A1 (es) * | 1978-12-19 | 1980-09-01 | Contraves Ag | Procedimiento para establecer un umbral de separacion para separar por lo menos dos clases de senales para analizar particulas y usos similares |
| US4288162A (en) * | 1979-02-27 | 1981-09-08 | Sumitomo Kinzoku Kogyo Kabushiki Kaisha | Measuring particle size distribution |
| US4488248A (en) * | 1980-12-05 | 1984-12-11 | Toa Medical Electronics Co., Ltd. | Particle size distribution analyzer |
| US4453226A (en) * | 1981-07-15 | 1984-06-05 | United Technologies Corporation | Method and apparatus for particle size determination in a host material |
| GB8309716D0 (en) * | 1983-04-11 | 1983-05-18 | Starnes P E | Particle size analysis |
| US4706207A (en) * | 1985-06-24 | 1987-11-10 | Nova Celltrak, Inc. | Count accuracy control means for a blood analyses system |
| US4676641A (en) * | 1986-01-08 | 1987-06-30 | Coulter Electronics Of New England, Inc. | System for measuring the size distribution of particles dispersed in a fluid |
-
1987
- 1987-02-13 US US07/014,770 patent/US4817446A/en not_active Expired - Fee Related
- 1987-02-17 CA CA000529906A patent/CA1276299C/fr not_active Expired - Fee Related
- 1987-02-18 DE DE3789736T patent/DE3789736T2/de not_active Expired - Fee Related
- 1987-02-18 EP EP87301393A patent/EP0254380B1/fr not_active Expired - Lifetime
Cited By (2)
| Publication number | Priority date | Publication date | Assignee | Title |
|---|---|---|---|---|
| EP0512664A3 (en) * | 1991-05-09 | 1993-04-28 | Toa Medical Electronics Co., Ltd. | Method of partitioning particle size distribution datum |
| US7043394B2 (en) | 2002-04-25 | 2006-05-09 | Nomura Micro Science Co., Ltd. | Method and device for measuring fine particles in ultrapure water |
Also Published As
| Publication number | Publication date |
|---|---|
| US4817446A (en) | 1989-04-04 |
| DE3789736D1 (de) | 1994-06-09 |
| EP0254380A3 (en) | 1989-11-29 |
| EP0254380B1 (fr) | 1994-05-04 |
| DE3789736T2 (de) | 1994-08-18 |
| CA1276299C (fr) | 1990-11-13 |
Similar Documents
| Publication | Publication Date | Title |
|---|---|---|
| JP2667867B2 (ja) | 粒子解析装置 | |
| US6630990B2 (en) | Optical method and apparatus for red blood cell differentiation on a cell-by-cell basis, and simultaneous analysis of white blood cell differentiation | |
| EP0361503B1 (fr) | Appareil d'analyse de particules et procédé pour déterminer un indice de changement nucléaire | |
| Klee et al. | Routine erythrocyte measurements in diagnosis of iron-deficiency anemia and thalassemia minor | |
| EP0361504B1 (fr) | Appareil pour l'analyse de particules et méthode pour déterminer l'indice de décalage nucléaire | |
| Aune et al. | Automated flow cytometric analysis of blood cells in cerebrospinal fluid: analytic performance | |
| EP0254380B1 (fr) | Méthode d'analyse pour une distribution de tailles de particules | |
| JP3213097B2 (ja) | 粒子分析装置及び方法 | |
| JPH05149863A (ja) | 粒子計数方法 | |
| IL119904A0 (en) | An automated method for discriminating platelets from cells and apparatus for carrying out same | |
| EP1859377A2 (fr) | Systeme, methode, et article de detection de cellules anormales par analyse pluridimentionnelle | |
| Longanbach et al. | Automated blood cell analysis | |
| EP4397978A1 (fr) | Méthode de détection d'anomalie de réaction de coagulation sanguine | |
| US6662117B2 (en) | Particle analyzer and particle classifying method | |
| JP2004510974A (ja) | 異常な粒子集団を分析する為の方法 | |
| US8512977B2 (en) | Analyzing reticulocytes | |
| EP0368462A1 (fr) | Méthode d'immuno-analyse | |
| US6030838A (en) | Hematological parameter | |
| JPS60107565A (ja) | 赤血球異常のスクリ−ニング方法 | |
| Drewinko et al. | Eight-parameter automated hematology analyzers: Comparison of two flow cytometric systems | |
| Groner et al. | Characterizing blood cells by biophysical measurements in flow | |
| JPH0225134B2 (fr) | ||
| JPH0629838B2 (ja) | 粒度分布解析法 | |
| JPH0629839B2 (ja) | 粒度分布解析法 | |
| JPH0629840B2 (ja) | 粒度分布解析法 |
Legal Events
| Date | Code | Title | Description |
|---|---|---|---|
| PUAI | Public reference made under article 153(3) epc to a published international application that has entered the european phase |
Free format text: ORIGINAL CODE: 0009012 |
|
| AK | Designated contracting states |
Kind code of ref document: A2 Designated state(s): DE FR GB IT NL |
|
| PUAL | Search report despatched |
Free format text: ORIGINAL CODE: 0009013 |
|
| AK | Designated contracting states |
Kind code of ref document: A3 Designated state(s): DE FR GB IT NL |
|
| 17P | Request for examination filed |
Effective date: 19900503 |
|
| 17Q | First examination report despatched |
Effective date: 19910702 |
|
| RAP1 | Party data changed (applicant data changed or rights of an application transferred) |
Owner name: TOA MEDICAL ELECTRONICS CO., LTD. |
|
| GRAA | (expected) grant |
Free format text: ORIGINAL CODE: 0009210 |
|
| AK | Designated contracting states |
Kind code of ref document: B1 Designated state(s): DE FR GB IT NL |
|
| REF | Corresponds to: |
Ref document number: 3789736 Country of ref document: DE Date of ref document: 19940609 |
|
| ET | Fr: translation filed | ||
| ITF | It: translation for a ep patent filed | ||
| PLBE | No opposition filed within time limit |
Free format text: ORIGINAL CODE: 0009261 |
|
| STAA | Information on the status of an ep patent application or granted ep patent |
Free format text: STATUS: NO OPPOSITION FILED WITHIN TIME LIMIT |
|
| 26N | No opposition filed | ||
| PGFP | Annual fee paid to national office [announced via postgrant information from national office to epo] |
Ref country code: DE Payment date: 19991231 Year of fee payment: 14 |
|
| PGFP | Annual fee paid to national office [announced via postgrant information from national office to epo] |
Ref country code: FR Payment date: 20000210 Year of fee payment: 14 |
|
| PGFP | Annual fee paid to national office [announced via postgrant information from national office to epo] |
Ref country code: GB Payment date: 20000216 Year of fee payment: 14 |
|
| PGFP | Annual fee paid to national office [announced via postgrant information from national office to epo] |
Ref country code: NL Payment date: 20000228 Year of fee payment: 14 |
|
| PG25 | Lapsed in a contracting state [announced via postgrant information from national office to epo] |
Ref country code: GB Free format text: LAPSE BECAUSE OF NON-PAYMENT OF DUE FEES Effective date: 20010218 |
|
| PG25 | Lapsed in a contracting state [announced via postgrant information from national office to epo] |
Ref country code: NL Free format text: LAPSE BECAUSE OF NON-PAYMENT OF DUE FEES Effective date: 20010901 |
|
| GBPC | Gb: european patent ceased through non-payment of renewal fee |
Effective date: 20010218 |
|
| PG25 | Lapsed in a contracting state [announced via postgrant information from national office to epo] |
Ref country code: FR Free format text: LAPSE BECAUSE OF NON-PAYMENT OF DUE FEES Effective date: 20011031 |
|
| NLV4 | Nl: lapsed or anulled due to non-payment of the annual fee |
Effective date: 20010901 |
|
| REG | Reference to a national code |
Ref country code: FR Ref legal event code: ST |
|
| PG25 | Lapsed in a contracting state [announced via postgrant information from national office to epo] |
Ref country code: DE Free format text: LAPSE BECAUSE OF NON-PAYMENT OF DUE FEES Effective date: 20011201 |
|
| PG25 | Lapsed in a contracting state [announced via postgrant information from national office to epo] |
Ref country code: IT Free format text: LAPSE BECAUSE OF NON-PAYMENT OF DUE FEES;WARNING: LAPSES OF ITALIAN PATENTS WITH EFFECTIVE DATE BEFORE 2007 MAY HAVE OCCURRED AT ANY TIME BEFORE 2007. THE CORRECT EFFECTIVE DATE MAY BE DIFFERENT FROM THE ONE RECORDED. Effective date: 20050218 |