EP0289360A2 - Calibration en fréquence RF d'un scanner à résonance magnétique - Google Patents
Calibration en fréquence RF d'un scanner à résonance magnétique Download PDFInfo
- Publication number
- EP0289360A2 EP0289360A2 EP88303960A EP88303960A EP0289360A2 EP 0289360 A2 EP0289360 A2 EP 0289360A2 EP 88303960 A EP88303960 A EP 88303960A EP 88303960 A EP88303960 A EP 88303960A EP 0289360 A2 EP0289360 A2 EP 0289360A2
- Authority
- EP
- European Patent Office
- Prior art keywords
- frequency
- signal
- transformed
- larmor
- fat
- Prior art date
- Legal status (The legal status is an assumption and is not a legal conclusion. Google has not performed a legal analysis and makes no representation as to the accuracy of the status listed.)
- Withdrawn
Links
Images




Classifications
-
- H—ELECTRICITY
- H03—ELECTRONIC CIRCUITRY
- H03L—AUTOMATIC CONTROL, STARTING, SYNCHRONISATION OR STABILISATION OF GENERATORS OF ELECTRONIC OSCILLATIONS OR PULSES
- H03L7/00—Automatic control of frequency or phase; Synchronisation
-
- G—PHYSICS
- G01—MEASURING; TESTING
- G01R—MEASURING ELECTRIC VARIABLES; MEASURING MAGNETIC VARIABLES
- G01R33/00—Arrangements or instruments for measuring magnetic variables
- G01R33/20—Arrangements or instruments for measuring magnetic variables involving magnetic resonance
- G01R33/44—Arrangements or instruments for measuring magnetic variables involving magnetic resonance using nuclear magnetic resonance [NMR]
- G01R33/48—NMR imaging systems
- G01R33/483—NMR imaging systems with selection of signals or spectra from particular regions of the volume, e.g. in vivo spectroscopy
- G01R33/4833—NMR imaging systems with selection of signals or spectra from particular regions of the volume, e.g. in vivo spectroscopy using spatially selective excitation of the volume of interest, e.g. selecting non-orthogonal or inclined slices
-
- G—PHYSICS
- G01—MEASURING; TESTING
- G01R—MEASURING ELECTRIC VARIABLES; MEASURING MAGNETIC VARIABLES
- G01R33/00—Arrangements or instruments for measuring magnetic variables
- G01R33/20—Arrangements or instruments for measuring magnetic variables involving magnetic resonance
- G01R33/44—Arrangements or instruments for measuring magnetic variables involving magnetic resonance using nuclear magnetic resonance [NMR]
- G01R33/48—NMR imaging systems
- G01R33/58—Calibration of imaging systems, e.g. using test probes, Phantoms; Calibration objects or fiducial markers such as active or passive RF coils surrounding an MR active material
- G01R33/583—Calibration of signal excitation or detection systems, e.g. for optimal RF excitation power or frequency
Definitions
- This invention relates to magnetic resonance (MR) techniques. More specifically, this invention relates to the adjustment of the frequency of the RF transmitter and receiver. The invention is particularly applicable to magnetic resonance imaging, but is not limited thereto.
- the magnetic resonance phenomenon has been utilized in the past in high resolution magnetic resonance spectroscopy instruments by structural chemists to analyze the structure of chemical compositions. More recently, MR has been developed as a medical diagnostic modality having applications in imaging the anatomy, as well as in performing in vivo, noninvasive spectroscopic analysis. As is now well known, the MR phenomenon can be excited within a sample object, such as a human patient, positioned in a homogeneous polarizing magnetic field, B o , by irradiating the object with radio frequency (RF) energy at the Larmor frequency.
- RF radio frequency
- this is typically accomplished by positioning the patient to be examined in the field of an RF coil having a cylindrical geometry, and energizing the RF coil with an RF power amplifier. Upon cessation of the RF excitation, the same or a different RF coil is used to detect the MR signals, frequently in the form of spin echoes, emanating from the patient lying within the field of the RF coil. In the course of a complete MR scan, a plurality of MR signals are typically observed. The MR signals are used to derive MR imaging or spectroscopic information about the patient being imaged or studied.
- the frequency of the RF transmitter and receiver is adjusted to insure that the excitation field is as the optimal Larmor frequency. This is necessary to produce the desired image contrast effects in certain MR measurements and to insure the accuracy of slice selection location.
- the MR signal is produced primarily by the protons in water and fat molecules.
- the Larmor frequency of the protons in these two substances is slightly different and the Larmor frequency of both will vary slightly from patient to patient and at different locations within a patient due to inhomogeneities.
- the MR signal is processed to produce on a CRT screen a picture of signal amplitude versus RF frequency. The operator then examines this picture and manually adjusts the frequency of the RF receiver to a desired value.
- the displayed MR signal may show two peaks, one at the Larmor frequency for fat protons and one at the Larmor frequency for water protons. The operator may choose either frequency, or a frequency therebetween, depending on the particular MR measurement to be conducted.
- the adjustment of the RF frequency of an MR scanner is made automatically during a sequence performed just prior to each MR scan. More specifically, the MR scanner performs a first, wideband MR measurement in which the frequency of the highest peak in the MR signal is determined at the region of interest in the subject, the RF transmit and receive frequencies are set to this determined frequency, a second, narrowband MR measurement is made to obtain a second MR signal from the region of interest, the MR signal is analyzed to determine the frequencies of the fat and water peaks therein, and the frequency of the RF transmitter and RF receiver is set with respect to these determined frequencies.
- the first and second MR measurements are performed in response to a stored program which carries out a number of other prescan calibration and adjustment functions.
- the MR signal from the second, narrowband MR measurement is processed and analyzed automatically under the direction of the same stored program and signals are output to the RF transmitter and RF receiver which control their frequency.
- the only operator input is an indication in the form of a manual selection of where with respect to the measured peak frequencies the transmitter and receiver frequencies are to be set.
- Embodiments of the invention may help to increase patient thru-put and decrease operator error.
- the measurement and adjustment sequence is performed quickly with little judgement or manually input information from the operator.
- the operator need only select whether the RF frequency is to be set to the resonant frequency of fat or water, to the midpoint or centroid frequency, or to the highest of the peak frequencies. The rest is performed automatically.
- Embodiments of the invention may also help to improve the quality of images produced by an MR scanner by enabling the desired RF frequency to be determined more accurately and the frequency to be tuned precisely for the particular region of interest in the patient to obtain the desired image contrast effects in that particular region.
- Embodiments of the invention may also improve the accuracy of slice selection position within the region of interest.
- the location of the slice depends on the accuracy of the RF frequency, and by calibrating the RF frequency, the position of the slice is also calibrated.
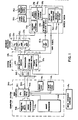
- a host computer system generally designated 100 which includes a main computer 101 (such as a Data General MV4000).
- the computer has associated therewith an interface 102 through which a plurality of computer peripheral devices and other MR system components are coupled.
- a magnetic tape drive 104 which may be utilized under the direction of the main computer for archiving patient data and images to tape.
- Processed patient data may also be stored in an image disc storage device designated 110.
- An array processor 106 is utilized for preprocessing data and for image reconstruction.
- image processor 108 The function of image processor 108 is to provide interactive image display manipulation such as magnification, image comparison, gray-scale adjustment and realtime data display.
- the computer system is provided with a means to store raw data (i.e. before image construction) utilizing a disc data storage system designated 112.
- An operator console 116 is also coupled to the computer by means of interface 102 and provides the operator with the means to input data pertinent to a patient study as well as additional data necessary for proper MR system operation, such as calibrating, initiating and terminating scans.
- the operator console is also used to display images stored on discs or magnetic tape.
- the computer system exercises control over the MR system by means of system control 118 and gradient amplifier system 128.
- the computer 100 communicates with system control 118 by means of a serial digital communication network 103 (such as the Ethernet network) in a manner well known to those skilled in the art.
- the system control 118 includes several subsystems such as the pulse control module (PCM) 120, a radio frequency transceiver 122, a status control module (SCM) 124, and the power supplies generally designated 126 necessary to energize the components.
- the PCM 120 utilizes control signals provided by main computer 101 to generate digital timing and control signals such as the digital waveforms which control gradient coil excitation, as well as RF envelope waveforms utilized in the transceiver 122 for modulating the RF excitation pulses.
- the gradient waveforms are applied to the gradient amplifier system 128 generally composed of G x , G y and G z amplifiers 130, 132 and 134, respectively.
- Each amplifier 130, 132 and 134 is utilized to excite a corresponding gradient coil in an assembly generally designated 136 and which is part of a magnet assembly 146.
- the gradient coils When energized, the gradient coils generate magnetic field gradients G x , G y and G z of the magnetic field in the same direction as the main polarizing magnetic field, wherein the gradients are directed in mutually orthogonal X-, Y- and Z-axis directions of a Cartesian coordinate system.
- the gradient magnetic fields are utilized in combination with radio frequency pulses generated by transceiver 122, RF amp 128 and RF coil 138 to encode spatial information into the MR signals emanating from the region of the patient being studied.
- Waveforms and control signals provided by the pulse control module 120 are utilized by the transceiver subsystem 122 for RF carrier modulation and mode control.
- the transmitter In the transmit mode, the transmitter provides a radio frequency waveform modulated in accordance with the control signals to an RF power amplifier 123 which then energizes RF coils 138 which are situated within main magnet assembly 146.
- the NMR signals radiated by the excited nuclei in the patient are sensed by the same or a different RF coil than is used for transmitting.
- the signals are detected, amplified, demodulated, filtered, and digitized in the receiver section of the transceiver 122.
- the processed signals are transmitted to the main computer 101 for processing by means of a dedicated, unidirectional, high-speed digital link 105 which links interface 102 and transceiver 122.
- the PCM 120 and SCM 124 are independent subsystems both of which communicate with main computer 101, peripheral systems, such as patient positioning system 152, as well as to one another by means of serial communications link 103.
- the PCM 120 and SCM 124 are each comprised of a 16-bit microprocessor (such as an Intel 8086) for processing commands from the main computer 101.
- the SCM 124 includes means for acquiring information regarding patient cradle position, and the position of the moveable patient alignment light fan beam (not shown). This information is used by main computer 101 to modify image display and reconstruction parameters.
- the SCM 124 also initiates functions such as actuation of the patient transport and alignment systems.
- the gradient coil assembly 136 and the RF transmit and receiver coils 138 are mounted within the bore of the magnet utilized to produce the polarizing magnetic field.
- the magnet forms a part of the main magnet assembly which includes the patient alignment system 148, a shim coil power supply 140, and a main magnet power supply 142.
- the shim power supply 140 is utilized to energize shim coils associated with the main magnet and which are used to correct inhomogeneities in the polarizing magnetic field.
- main magnet power supply 142 is utilized to continuously energize the magnet.
- the main magnet power supply 142 is utilized to bring the polarizing field produced by the magnet to the proper operating strength and is then disconnected.
- the patient alignment system 148 operates in combination with a patient cradle and transport system 150 and patient positioning system 152.
- the MR system components comprised of the main magnet assembly, the gradient coil assembly, and the RF transmit and receiver coils, as well as the patient-handling devices, are enclosed in an RF-shielded room generally designated 144.
- the shielding is generally provided by a copper or aluminum screen network which encloses the entire room.
- the screen network serves to contain the RF signals generated by the system, while shielding the system from RF signals generated outside the room.
- a bi-directional attentuation of approximately 100 db. is typical in the 63 MHz to 64 MHz frequency range of operation.
- the transceiver 122 includes components which produce the RF excitation field B1 through power amplifier 123 at a coil 138A and components which receive the resulting MR signal induced in a coil 138B.
- the base, or carrier, frequency of the RF excitation field is produced by a frequency synthesizer 200 which receives a set of digital signals (CF) through the communications link 103 from the main computer 101. These digital signals indicate the frequency which is to be produced at an output 201 at a resolution of one Hertz.
- the commanded RF carrier is applied to a modulator 202 where it is frequency and amplitude modulated in response to signals received through line 203, and the resulting RF excitation signal is turned on and off in response to a control signal from the PCM 120 received through line 204.
- the magnitude of the RF excitation pulse output through line 205 is attenuated by a transmit attenuator circuit 206 which receives a digital signal, TA, from the main computer 101 through communications link 103.
- the attenuated RF excitation pulses are applied to the power amplifier 123 that drives the RF transmitter coil 138A.
- the MR signal produced by the subject is picked up by the receiver coil 138B and applied to the input of a receiver 207.
- the receiver 207 amplifies the MR signal and this then attenuated by an amount determined by a digital attenuation signal (RA) received from the main computer 101 through link 103.
- the receiver 207 is also turned on and off by a signal through line 208 from the PCM 120 such that the MR signal is acquired only over the time intervals required by the particular acquisition being performed.
- the received MR signal is demodulated by a quadrature detector 209 to produce two signals I and Q that are coupled through filters to a pair of analog to digital converters indicated collectively at 215.
- These A/D converters are enabled by the control line 208 to produce digitized MR data only when a valid signal is present. This data is output to the main computer 101 through line 105.
- the filters at the inputs to the A/D converters are controlled by the main computer 101 to limit the bandwidth of I and Q.
- the quadrature detector 209 also receives an RF reference signal from a second frequency synthesizer 210 and this is employed by the quadrature detector 209 to sense the amplitude of that component of the MR signal which is in phase with the transmitter RF carrier and the amplitude of that component of the MR signal which is in quadrature therewith.
- the frequency synthesizer 210 receives digital signals (CF) through the link 103 which determine the frequency of the demodulation signal.
- CF digital signals
- the phase of the two synthesizers 200 and 210 is locked together through a line 211, and in most measurements, the frequency of the two synthesizers is the same.
- the present invention is embodied in the automatic adjustment of the RF carrier frequency produced by the synthesizers 200 and 210 in the transceiver 122.
- This RF frequency must be precisely set in order to provide optimal results from the MR scanner.
- the optimal RF frequency usually changes from scan to scan, and the frequency is adjusted routinely at the beginning of each scan as part of a "prescan" sequence in which other system parameters are also adjusted, or calibrated.
- the prescan sequence is executed by the main computer 101 in response to a set of stored program instructions and it produces the digital signals CF, TA and RA which are employed to operate the transceiver 122 as described above.
- the prescan sequence is entered and the various data structures which it requires are initialized as indicated at process block 250.
- a loop is then entered at process block 251 in which the prescan waits for a call from the main scan program.
- the main scan program provides data to the prescan, such as, the location of the center of the region of interest where the scan is to acquire MR data.
- a test is then made at decision block 252 to determine if the operator has chosen the automatic frequency adjust mode of operation. If not, the prescan continues to perform its other functions and it is presumed that the operator is satisfied with the current frequency setting or intends to manually adjust the RF frequency after the automatic prescan and prior to the scan.
- a first, broadband, MR measurement is performed to coarsely determine the proper RF frequency as indicated by process block 253.
- this measurement employs the MR signal to detect the frequency of its peak amplitude and this frequency is output (CF1) to the transceiver 122.
- the optimal transmitter attenuation (TA) is then calculated at process block 254. If either the carrier frequency (CF1) or the transmitter attenuation (TA) cannot be determined automatically, this is detected at decision block 255 and the process branches to log the error at 256 for display to the operator.
- the system branches at decision block 251 and a second, narrowband, MR measurement is performed at process block 258 to determine the exact RF frequency setting (CF2).
- CF2 the exact RF frequency setting
- the RF frequency may be set to any one of the following frequencies: WATER - the Larmor frequency of the nuclei associated with water molecules; FAT - the Larmor frequency of the nuclei associated with fat molecules; MIDPOINT - a frequency midway between the WATER and FAT Larmor frequencies; PEAK - the frequency which produces the largest peak in the transformed MR signal; and CENTROID - weighted center frequency of the transformed MR signal.
- the prescan process determines at process block 259 the receiver attenuation setting (RA). IF either CF2 or RA cannot be determined, the system branches at decision block 260 to indicate an error. Otherwise, the main computer 101 outputs the calculated values CF2, TA and RA to the transceiver 122 as indicated at 261. The pre-scan process then loops back to block 251 and waits for another call from the main scan program. Of course, the main scan program now proceeds to perform the programmed scan with the transceiver 122 finely tuned to the selected RF frequency.
- RA receiver attenuation setting
- the determination of the optimal RF frequency for the particular scan to be performed requires the execution of two MR measurements.
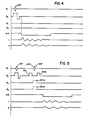
- the first of these is illustrated by the pulse sequence in Fig. 4 which is executed as part of the procedure for finding the coarse frequency CF1.
- the second MR measurement is illustrated by the pulse sequence in Fig. 5 which is executed as part of the procedure for finding the exact RF frequency CF2.
- These pulse sequences are orchestrated in the standard manner by the pulse control module 120 (Fig. 1) under the direction of the prescan program as described above.
- the file S(t) is then transformed to the frequency domain using a fast-Fourier transformation of the complex data.
- the magnitude of the transformed signal F f is then calculated: and the resulting transformed signal
- This transformed signal is graphically represented in Fig. 6, although it can be appreciated that the precise shape of this waveform will differ with each MR measurement.
- the transformed MR signal is now analyzed to determine the frequency of the highest peak. This is accomplished by taking the derivative of transformed MR signal and identifying those frequencies at which the derivative changes from a positive to negative sign. The magnitude of the signal is then measured at each of these frequencies to determine the frequency of the highest peak. This frequency is returned as the first pass, or coarse, RF frequency CF1 which is output to the transceiver 122. The RF frequency has now been set so that a higher resolution MR measurement can be performed during the second pass.
- the pulse sequence for the second MR measurement which is performed during the second pass adjustment of the RF frequency is shown in Fig. 5.
- a number of other differences exist in this second MR measurement.
- the excited spins are tipped 180° by a second excitation pulse 300 which is produced midway between two G z gradient pulses 301 and 302.
- the A/D converter is subsequently turned on the MR signal which is acquired is an echo pulse.
- this MR signal can be further position encoded to a specific region within the selected slice. This is particularly useful where there is considerable tissue in the selected slice along one of these axes, but outside the region of interest. If not eliminated by position encoding, such tissue will effect the MR signal and may result in a less than optimal RF frequency for the MR scan of the region of interest. Because these position encoding gradient pulses are optional, they are indicated by dashed lines in Fig. 5, however, the system does automatically apply position encoding gradient pulses along the dimension thought to have the most tissue.
- the I and Q signals which are output by the quadrature detector 209 are sampled and digitized at a 1kHz sample rate. Two hundred and fifty-six such digitized samples are obtained and are processed as described above to produce a file
- the graphic representation of this transformed MR signal is shown in Fig. 7 and it can be seen that because of the lower sampling rate a much narrower frequency range is covered.
- the transformed MR signal is now analyzed to determine the optimal, selected RF frequency.
- the peaks in the waveform are found by taking the derivative of the stored signal
- the maximum amplitude peak is then found by examining the amplitude at each frequency where a peak was found as indicated at process block 272.
- the other peak in the transformed MR signal due to fat or water nuclei is located. This is accomplished at process block 273 by identifying all substantial peaks which lie within the range of 180 Hz to 240 Hz to either side of the maximum peak. This range is indicated in Fig. 7 by the cross-hatched areas 310 and 311. To be considered substantial, a peak must have a significant amplitude (at least 10% to 20% of the amplitude of the maximum). In the example of Fig. 7, two peaks 312 and 313 satisfy this criteria, however, if none are found, the system branches at decision block 274.
- the choice is made at process block 276 by selecting the peak 313 which has a higher amplitude. Having identified the two peaks, the peak with the higher frequency is assumed to be WATER and the other peak is assumed to be FAT. If a valid peak pair is not found, the process returns the frequency of the maximum peak and it produces a message for the operator at 277.
- the selected RF frequency is determined and returned as CF2. If the operator has selected FAT or WATER, then no further calculation is required at respective process blocks 278 or 279. If MIDPOINT has been selected, then the frequency half way between the frequency of the FAT and WATER peaks is calculated and output at process block 280. If PEAK has been selected, then the magnitudes of the FAT and WATER peaks are compared and the frequency of the larger peak is returned as indicated at process block 281.
- a more complex computation is required at process block 282. More specifically, the waveform of the transformed MR signal in Fig. 7 is viewed as a function F(f), where f is the frequency and it ranges from -500 to +500. Then the centroid frequency f c is calculated as follows: This calculated frequency f c is returned as the optimal RF frequency CF2.
- the transceiver RF frequency may be controlled either manually or by digital command signals from the main computer 101.
- This capability is exploited by performing an automatic prescan sequence prior to each scan of a patient.
- This prescan determines the optimal RF frequency for the scan and outputs a digital command CF2 to set the RF frequency of the transceiver.
- the operator maintains control over this automatic frequency calibration by selecting any one of four automatic frequency settings at the main operator console 116. Of course, the operator can also disable the automatic mode and set the RF frequency manually as has been done in the past.
- the operator can elect to perform a semi-automatic calibration of the RF frequency in which the broadband MR measurement is performed and the transformed MR signal is displayed on the operator console 116.
- the operator manually sets CF1 and the second, narrowband MR measurement is run using this RF frequency.
- the transformed MR data from the second measurement is displayed on the operator console 116 and the operator manually selects the desired RF frequency CF2.
- each MR measurement may, in fact, be comprised of two pulse sequences as shown and described herein.
- the ninety degree excitation pulses in the two sequences may be out of phase 180 degrees and the two MR signals subtracted from each other to eliminate baseline errors in the system.
- a ninety degree excitation pulse is employed in the preferred embodiment, this is not critical. Any amount of transverse magnetization which will produce an MR signal is satisfactory, and excitation pulses ranging from thirty to one hundred and fifty degrees will operate satisfactorily.
- the 180 degree echo pulse 300 must be of sufficient accuracy to produce an echo signal as is well known in the art.
Landscapes
- Physics & Mathematics (AREA)
- High Energy & Nuclear Physics (AREA)
- Condensed Matter Physics & Semiconductors (AREA)
- General Physics & Mathematics (AREA)
- Optics & Photonics (AREA)
- Spectroscopy & Molecular Physics (AREA)
- Magnetic Resonance Imaging Apparatus (AREA)
Applications Claiming Priority (2)
| Application Number | Priority Date | Filing Date | Title |
|---|---|---|---|
| US07/043,862 US4806866A (en) | 1987-04-29 | 1987-04-29 | Automatic RF frequency adjustment for magnetic resonance scanner |
| US43862 | 1987-04-29 |
Publications (2)
| Publication Number | Publication Date |
|---|---|
| EP0289360A2 true EP0289360A2 (fr) | 1988-11-02 |
| EP0289360A3 EP0289360A3 (fr) | 1990-04-25 |
Family
ID=21929258
Family Applications (1)
| Application Number | Title | Priority Date | Filing Date |
|---|---|---|---|
| EP88303960A Withdrawn EP0289360A3 (fr) | 1987-04-29 | 1988-04-29 | Calibration en fréquence RF d'un scanner à résonance magnétique |
Country Status (6)
| Country | Link |
|---|---|
| US (1) | US4806866A (fr) |
| EP (1) | EP0289360A3 (fr) |
| JP (1) | JPH0664131B2 (fr) |
| KR (1) | KR910004654B1 (fr) |
| FI (1) | FI881301L (fr) |
| IL (1) | IL85683A (fr) |
Cited By (1)
| Publication number | Priority date | Publication date | Assignee | Title |
|---|---|---|---|---|
| WO1994027159A1 (fr) * | 1993-05-07 | 1994-11-24 | General Electric Company | Etalonnage de frequence pour scanner mri |
Families Citing this family (22)
| Publication number | Priority date | Publication date | Assignee | Title |
|---|---|---|---|---|
| IL82030A (en) * | 1987-03-27 | 1990-11-05 | Elscint Ltd | Separation of spectral components |
| US4885538A (en) * | 1988-08-19 | 1989-12-05 | The Regents Of The University Of California | Low data rate low noise serial digital communication link for magnetic resonance imaging systems |
| JPH0412734A (ja) * | 1990-05-07 | 1992-01-17 | Hitachi Ltd | 磁気共鳴イメージングの方法および装置 |
| US5107215A (en) * | 1990-06-25 | 1992-04-21 | General Electric | Rf power calibration for an nmr scanner |
| US5451876A (en) * | 1993-10-18 | 1995-09-19 | General Electric Company | MRI system with dynamic receiver gain |
| US5912558A (en) * | 1997-11-14 | 1999-06-15 | Picker International, Inc. | Automatic frequency tuning for MR scanners |
| US6025718A (en) * | 1998-04-07 | 2000-02-15 | Hushek; Stephen G. | RF power calibration for an MRI system using local coils |
| US6111411A (en) * | 1998-04-07 | 2000-08-29 | Generalelectric Company | RF power calibration for an MRI system using multiple axis projections |
| DE10055417C2 (de) * | 2000-11-09 | 2002-10-24 | Siemens Ag | Verfahren zum Erzeugen von Magnetresonanzbildern mit optimaler Einstellung von Sequenzparametern |
| US6621433B1 (en) | 2001-06-22 | 2003-09-16 | Fonar Corporation | Adaptive dynamic range receiver for MRI |
| US6943548B1 (en) | 2001-06-22 | 2005-09-13 | Fonar Corporation | Adaptive dynamic range receiver for MRI |
| JP3753668B2 (ja) * | 2002-03-12 | 2006-03-08 | ジーイー・メディカル・システムズ・グローバル・テクノロジー・カンパニー・エルエルシー | Rfパルスチューニング装置 |
| US6977502B1 (en) | 2002-11-04 | 2005-12-20 | Fonar Corporation | Configurable matrix receiver for MRI |
| JP3802891B2 (ja) * | 2003-07-02 | 2006-07-26 | ジーイー・メディカル・システムズ・グローバル・テクノロジー・カンパニー・エルエルシー | ゲイン調節方法および磁気共鳴撮影装置 |
| CN101322647B (zh) * | 2007-06-15 | 2010-09-29 | Ge医疗系统环球技术有限公司 | 磁共振成像设备和射频发射增益设置方法 |
| US9097769B2 (en) * | 2011-02-28 | 2015-08-04 | Life Services, LLC | Simultaneous TX-RX for MRI systems and other antenna devices |
| CA2886775A1 (fr) | 2012-10-04 | 2014-04-10 | Halliburton Energy Services, Inc. | Appareil, procedes, et systemes de localisation par la frequence |
| US9261470B2 (en) * | 2014-03-07 | 2016-02-16 | One Resonance Sensors, Llc | High precision elemental composition determination |
| TWI685668B (zh) * | 2016-09-29 | 2020-02-21 | 美商超精細研究股份有限公司 | 磁共振成像系統,以及搭配該磁共振成像系統使用之調諧系統 |
| DE102017201074A1 (de) * | 2017-01-24 | 2018-07-26 | Siemens Healthcare Gmbh | Verfahren zur Aufnahme von Magnetresonanzdaten, Magnetresonanzeinrichtung, Computerprogramm und Datenträger |
| US12007458B2 (en) * | 2019-07-08 | 2024-06-11 | Canon Medical Systems Corporation | Magnetic resonance imaging apparatus and magnetic resonance imaging method |
| US10969451B1 (en) | 2019-09-23 | 2021-04-06 | GE Precision Healthcare LLC | Systems and methods for in-phase zero echo time magnetic resonance imaging |
Family Cites Families (8)
| Publication number | Priority date | Publication date | Assignee | Title |
|---|---|---|---|---|
| US3873909A (en) * | 1967-08-21 | 1975-03-25 | Varian Associates | Gyromagnetic apparatus employing computer means for correcting its operating parameters |
| US3609519A (en) * | 1967-11-22 | 1971-09-28 | Jeol Ltd | Apparatus for maintaining field frequency control in a gyromagnetic instrument |
| FR2205199A5 (fr) * | 1972-10-02 | 1974-05-24 | Sp Konstruktors | |
| US4171511A (en) * | 1978-04-14 | 1979-10-16 | Varian Associates, Inc. | Automatic field-frequency lock in an NMR spectrometer |
| US4411270A (en) * | 1978-11-20 | 1983-10-25 | Damadian Raymond V | Apparatus and method for nuclear magnetic resonance scanning and mapping |
| US4543529A (en) * | 1983-01-04 | 1985-09-24 | Nmr Imaging, Inc. | Method of tuning an NMR apparatus |
| US4585993A (en) * | 1983-12-14 | 1986-04-29 | General Electric Company | Method for selective NMR imaging of chemically-shifted nuclei |
| JPS6123953A (ja) * | 1984-07-11 | 1986-02-01 | Jeol Ltd | 核磁気共鳴装置 |
-
1987
- 1987-04-29 US US07/043,862 patent/US4806866A/en not_active Expired - Lifetime
-
1988
- 1988-03-10 IL IL85683A patent/IL85683A/xx not_active IP Right Cessation
- 1988-03-18 FI FI881301A patent/FI881301L/fi not_active Application Discontinuation
- 1988-04-28 JP JP63104458A patent/JPH0664131B2/ja not_active Expired - Lifetime
- 1988-04-29 KR KR1019880004890A patent/KR910004654B1/ko not_active Expired
- 1988-04-29 EP EP88303960A patent/EP0289360A3/fr not_active Withdrawn
Cited By (1)
| Publication number | Priority date | Publication date | Assignee | Title |
|---|---|---|---|---|
| WO1994027159A1 (fr) * | 1993-05-07 | 1994-11-24 | General Electric Company | Etalonnage de frequence pour scanner mri |
Also Published As
| Publication number | Publication date |
|---|---|
| KR880013325A (ko) | 1988-11-30 |
| FI881301A7 (fi) | 1988-10-30 |
| JPS63286141A (ja) | 1988-11-22 |
| EP0289360A3 (fr) | 1990-04-25 |
| JPH0664131B2 (ja) | 1994-08-22 |
| FI881301L (fi) | 1988-10-30 |
| US4806866A (en) | 1989-02-21 |
| KR910004654B1 (ko) | 1991-07-09 |
| IL85683A0 (en) | 1988-08-31 |
| IL85683A (en) | 1991-06-10 |
| FI881301A0 (fi) | 1988-03-18 |
Similar Documents
| Publication | Publication Date | Title |
|---|---|---|
| US4806866A (en) | Automatic RF frequency adjustment for magnetic resonance scanner | |
| EP0332383B1 (fr) | Compensation pour champ de polarisation et de gradient | |
| US5451876A (en) | MRI system with dynamic receiver gain | |
| US5001428A (en) | Method for mapping the RF transmit and receive field in an NMR system | |
| RU2633283C2 (ru) | Система магнитно-резонансного обследования с предпочтительными настройками на основе интеллектуального анализа данных | |
| US4698591A (en) | Method for magnetic field gradient eddy current compensation | |
| EP0649539B1 (fr) | Etalonnage de frequence pour scanner mri | |
| EP0492898B1 (fr) | Representer une image au moyen de résonance magnétique | |
| US4740753A (en) | Magnet shimming using information derived from chemical shift imaging | |
| US6028428A (en) | Multiband selective RF pulse construction for NMR measurement sequences | |
| EP0366232A2 (fr) | Procédé pour la production d'images en tranches multiples par RMN | |
| GB2113399A (en) | Method and apparatus for rapid NMR imaging of nuclear parameters within an object | |
| RU2538421C2 (ru) | Картирование градиента восприимчивости | |
| DE19631915A1 (de) | Verschachtelte Magnetresonanz-Spektroskopie und -Abbildung mit dynamischer Veränderung von Erfassungsparametern | |
| US5107215A (en) | Rf power calibration for an nmr scanner | |
| EP0519057A1 (fr) | Procede et appareil de spectroscopie a rmn localisee utilisant une configuration a spirales entrelacees | |
| US6157192A (en) | Recovery of signal void arising from field inhomogeneities in echo planar imaging | |
| US5185574A (en) | NMR measurements using recursive RF excitation | |
| EP0230027B1 (fr) | Réglage d'aimant utilisant l'information acquise par imagerie du déplacement chimique | |
| US4952876A (en) | Variable bandwidth multiecho NMR imaging | |
| US5257625A (en) | Method of noninvasive motion analysis by using forced closure of phase contrast MRI maps of velocity | |
| US4714885A (en) | Magnetic resonance imaging | |
| US6025718A (en) | RF power calibration for an MRI system using local coils | |
| CN112824922B (zh) | 磁共振拍摄装置及其控制方法 | |
| MXPA00009820A (en) | Recovery of signal void arising from field inhomogeneities in magnetic resonance echo planar imaging |
Legal Events
| Date | Code | Title | Description |
|---|---|---|---|
| PUAI | Public reference made under article 153(3) epc to a published international application that has entered the european phase |
Free format text: ORIGINAL CODE: 0009012 |
|
| AK | Designated contracting states |
Kind code of ref document: A2 Designated state(s): CH DE FR GB IT LI NL |
|
| PUAL | Search report despatched |
Free format text: ORIGINAL CODE: 0009013 |
|
| AK | Designated contracting states |
Kind code of ref document: A3 Designated state(s): CH DE FR GB IT LI NL |
|
| 17P | Request for examination filed |
Effective date: 19900924 |
|
| 17Q | First examination report despatched |
Effective date: 19930510 |
|
| GRAH | Despatch of communication of intention to grant a patent |
Free format text: ORIGINAL CODE: EPIDOS IGRA |
|
| STAA | Information on the status of an ep patent application or granted ep patent |
Free format text: STATUS: THE APPLICATION IS DEEMED TO BE WITHDRAWN |
|
| 18D | Application deemed to be withdrawn |
Effective date: 19960604 |