EP0364189A2 - Systementwurfsverfahren und -werkzeug - Google Patents
Systementwurfsverfahren und -werkzeug Download PDFInfo
- Publication number
- EP0364189A2 EP0364189A2 EP89310299A EP89310299A EP0364189A2 EP 0364189 A2 EP0364189 A2 EP 0364189A2 EP 89310299 A EP89310299 A EP 89310299A EP 89310299 A EP89310299 A EP 89310299A EP 0364189 A2 EP0364189 A2 EP 0364189A2
- Authority
- EP
- European Patent Office
- Prior art keywords
- data
- processes
- design tool
- system design
- simulation
- Prior art date
- Legal status (The legal status is an assumption and is not a legal conclusion. Google has not performed a legal analysis and makes no representation as to the accuracy of the status listed.)
- Withdrawn
Links
Images




Classifications
-
- G—PHYSICS
- G06—COMPUTING OR CALCULATING; COUNTING
- G06F—ELECTRIC DIGITAL DATA PROCESSING
- G06F8/00—Arrangements for software engineering
- G06F8/20—Software design
-
- G—PHYSICS
- G06—COMPUTING OR CALCULATING; COUNTING
- G06F—ELECTRIC DIGITAL DATA PROCESSING
- G06F30/00—Computer-aided design [CAD]
- G06F30/20—Design optimisation, verification or simulation
-
- G—PHYSICS
- G06—COMPUTING OR CALCULATING; COUNTING
- G06F—ELECTRIC DIGITAL DATA PROCESSING
- G06F30/00—Computer-aided design [CAD]
- G06F30/10—Geometric CAD
- G06F30/15—Vehicle, aircraft or watercraft design
Definitions
- the present invention relates to a system design tool, and a method for use in system design, which may be used to optimise the design of a particular system.
- a "system” could be an integrated passenger transport system, such as for aircraft in the air, airports, pedestrial routeways, trains, buses, taxis and private cars; or an integrated telephone exchange, e.g. with international, domestic and/or business connections, including in-house company networks; or an integrated control system for a modern warship.
- Flow diagrams are well known means of representing a system such as an oil refinery, rail or telephone network, and the like, but as a general rule they represent only the steady state condition, e.g. a flow in litres per hour or the passage of an average number of trains or calls per unit of time.
- steady state condition e.g. a flow in litres per hour or the passage of an average number of trains or calls per unit of time.
- fluids can flow in surges and rush hours cause congestion.
- a static flow diagram cannot accommodate rapid changes in the data flow regimes nor the ramifications of a disruption of the network, such as a train derailment or roadworks.
- Logic diagrams are also known in which 'either/or', 'what if?' and other types of decisions may be made.
- a single input and the logic flow therefrom can easily be followed.
- the logic tends to break down.
- the output from a first location may not be passed onto the receiving one because the receiving location is still processing a concurrent input and all intermediate storage locations are filled. This will effectively 'block' the first location, disrupting the whole logic flow. There is thus a need to be able to follow such a complicated system in a slow animated manner, even though the inputs and responses are occurring at high speed.
- the solution should ideally be able to indicate visually the sort of responses occurring throughout the system in real time and provide a hard copy of what occurred when for subsequent detailed study. It is also desirable to be able to construct a large number of incident scenarios and combinations of scenarios and thus design the system to be able to accommodate any particular combination of events which might reasonably occur.
- a system design tool comprising: simulating means operable to simulate mathematically a complex interactive system, by representing said system as a plurality of interconnected processes, each process being defined by an algorithm which takes into account its basic function(s) and its interconnections with other components, and by carrying out computations to perform all the algorithms in an essentially predetermined combined manner so as to effect a simulation; data input means operable to feed data to the simulating means before and during said computations to provide information on initial conditions and changes in conditions affecting said system; and data output means operable during said computations to supply results of said computations to a display, in the form of at least one logic diagram with symbols representing the processes and interconnections, the symbols being dynamically changed in appearance to indicate the progress and results of the simulation.
- a method of simulating mathematically a complex interactive system for use in system design, comprising steps of: representing the system as a plurality of interconnected processes; providing an algorithm for each process which models its function and its interconnections with other processes; combining the algorithms to produce an overall model of the system; providing data on initial conditions of the system; performing computations using computing means on the basis of the model and initial conditions so as to effect a simulation of the behaviour of the system; supplying the computing means with data on changes in conditions of the system during the course of the computations; and displaying a diagram representing at least part of the system, having symbols representing the processes and their interconnections, and changing the appearance of the symbols during the course of the computations so as to indicate the progress and results of the simulation.
- the algorithms define mathematically the complete function of every process e.g. whether it provides data, accepts and stores data, processes data (and the method by which it is processed) or transfers data to another specified location or any combination of these functions.
- the interconnections with other components are also specified, e.g. receive data from A and B, receive data from and transfer data to C, etc.
- the algorithm can define the interrogation of one component by another, for example component D could interrogate component E, causing E to obtain data from F, G and H, process the data and return the answer to D. Interconnections can of course carry instructions as well as data.
- Data inputs can include random inputs or human intervention, and processing functions can represent the actions of microprocessors or separate computers.
- the user of the system design tool observes the changing appearances of the symbols on the display (e.g. a V.D.U.) so as to monitor the progress of the simulation and to detect trouble spots such as data bottlenecks.
- the processes are arranged in a hierarchical layer structure, wherein a single process in one layer is sub-divided into a number of processes of a lower layer.
- the system design tool will be used with a view to designing electronic circuitry or a computer system to perform the functions being simulated. It is often advantageous to employ parallel processing techniques in such circuitry or computer systems, and an embodiment of the invention allows parallel processing configurations to be tried out in the simulation. That is, processes can be organised into groups, and the algorithms of one group are performed independently of, and in parallel with, those of another group. The group organisation can be changed in a systematic or random way to try out different configurations.
- the simulation will be carried out on a computer system of adequate capacity.
- this could be a conventional technical mini computer, such as a DEC VAX 8500 series but for larger systems, a mainframe computer such as an IBM 3083 could be required.
- the algorithm for each process takes the form of a piece of computer code in a high-level computer language such as ADA.
- the design tool then combines all the algorithms into one computer program.
- the computer input file (known as the 'Event List') defines a set of initial conditions for the simulation and this is separately entered once the program has been compiled and linked, thus facilitating repeated changes to the initial conditions (scenario) without rebuilding the software.
- Event List the computer input file
- the user could enter data at a terminal of the computer system during the course of the simulation, which would be one way to simulate "human intervention" or a "random" input to the system.
- One embodiment of the invention permits this by incorporating a statistical function into one or more of the algorithms, which can alter its results (i.e. its outputs to other algorithms), perhaps unpredictably, when for example one or more of its data inputs are absent.
- the output from the simulator is used to display the logic diagram(s) and illustrate graphically the progress of the logic in either a free-running time mode or in a series of (computer) time intervals.
- the appearance of the representations of particular processes on the one, or more, logic diagrams on the display is changed in accordance with the operation being performed by the particular process at that particular time. For example, when a process is not operational, it could be a first colour, when transmitting data - a second colour, when processing data - a third colour, and so forth.
- the means of display is a colour V.D.U. (visual display unit) with a printer or plotter also provided from which coloured hard copies are obtainable.
- V.D.U. visual display unit
- printer or plotter also provided from which coloured hard copies are obtainable.
- 'every unit operation means every transfer of data, request for data, processing function, etc.
- the statistics output provided for each functional process identified in the system covers analysis of data throughput, data staleness, processing time, number of occurrences of each state for finite state processes, etc.
- Data throughput is a measure of the particular data-link utilisation (i.e. rate of data transfer) and data staleness provides an indication of the length of time data is available, but remains unused by the receiving process.
- the statistics output file and the external data log are displayable on a V.D.U. and obtainable as a hard copy print out.
- the hard copies of the Statistics output file and the external data log enable the designer to study in detail how the simulation has proceeded. If there have been any problems, e.g. excessive concentrations of data at one location causing storage and transmission problems, these can be identified and the system design changed accordingly.
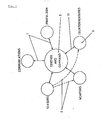
- a two-way (primary) traffic in data for example consisting of an instruction and a response confirming that the instruction has been carried out; though this data could be verbal, the modern trend is that the data flow is electronic in nature.
- dashed lines 2 are shown to indicate that there are also data links between, for example, the sensors and weapons system and sensors and countermeasures system. These data flows are shown as only undirectional (secondary), e.g. a sensor warning of a detected hostile presence.
- Fig. 1 shows how different systems interface on a macro scale to give the complete control system for the warship (submarine).
- the radial flows may be considered as primary data and the dashed circumferential flows 2 as secondary data.
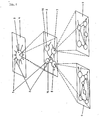
- each of the five peripheral systems (and perhaps the command system itself) is itself a complex of data handling processes and control processes which in turn can be arranged in an ordered, logical hierarchy as shown in Fig. 2.
- the description will now concentrate on the Countermeasures System 3 as an example.
- Fig. 2 is only a means of showing the system diagrammatically.
- the computer always operates at the lowest level (layer), i.e. with all inputs, data transfers, processes, outputs, etc., included as all these functions are present in the program and could become operational at any time.
- a single diagram with this degree of complexity would be too confusing for the reader to appreciate easily. This also applies to the user of the system design tool as explained later.
- Figure 2 shows the levelled hierarchical state of the system logic.
- the first level 4 shows the overall system 3 (as shown on Fig. 1), the two-way input 1 from the Control and Command centre 5, the sensor input 2 and other inputs/outputs (not numbered).
- Circle 3 represents a complete programmed "process" or component of the system, which processes the various inputs, e.g. 1, 2, to produce a variety of outputs. Many of these outputs would be demands for further information.
- the first hierarchical subdivision of process 3 is shown on level 6 consisting of four main processes 7, 8, 14 and 16. These are respectively a launch sequence control process, launch countermeasure control process, threat assessment process, and countermeasures allocation process.
- Inputs 1 and 2 are actually received by process 14 and cause further outputs to processes 7 and 8 (as shown by unnumbered arrows) and other outputs (not shown).
- each of processes 7, 8, 14 and 16 may have to rely on further processing and sources of information on a third hierarchical level 9.
- processes 7, 8, 14 and 16 represent separate logic subsystems consisting of further processes (shown as circles), data stores etc. (shown as rectangles) and inputs/outputs (shown as arrows); intermediate data stores, e.g. hostile contact parameters, are shown between two parallel lines.
- process 14 decides what further data is needed and interrogates data sources and processes, e.g. 7 & 8 as required by the programming.
- the processes, e.g. 7 & 8, repeat this action on level 2 and thence down on to level 3, and so on. Only three levels are shown on Fig. 2 for purposes of clarity, but it will be understood that as many levels as required for as many processes as required can be provided.
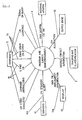
- FIG. 3 shows the control process 3 and data interconnections on the first level 4 of the countermeasures logic system.
- sensor 10 alerts process 3 via link (sensor alert signal) 10A, that a hostile contact has been identified.
- Immediate responses 11 to command centre 5 and 13A to a C.M. display 13 indicate that the alert has been registered and a response is being prepared.
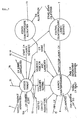
- Fig. 4 shows diagrammatically the control and logic processes on second level 6.
- the basic countermeasure control process is shown as an interlinking of four separate processes 7, 8, 14 & 16.
- process 14 selects the appropriate form of countermeasure, calculates the contact parameters (bearing, speed etc.) and launcher setting, and passes the data to the countermeasures launcher control process 8.
- a simultaneous alert signal 18 activates launch sequence control process 7.
- a further process 16 assesses the countermeasures allocation.
- the other data links to launch control process 8 are self-explanatory, except that it should be noted that signal to fire 17 could be automatically generated, if the countermeasure response was operating in the non-manual mode. 15 indicates a hostile contact response.
- the system design tool provides a "shell" (usually in the form of a computer program) which can be used to simulate many widely differing types of complex interactive system.
- the system may either be an existing real system whose behaviour is to be studied, or in the case of system design per se, it may be a proposed design for an electronics, computer system or other real system required to fulfil a complex function such as defending a warship from attack. In either case, before a particular system can be simulated a certain amount of preparation is necessary.
- Processes can be classified as either of two types: “data processes” which produce, relay, store, process and/or receive data; and “control processes” which process signals to control other processes, for example, by activating them.
- a “data process” is a function represented by an algorithm which is able to read and manipulate supplied information (i.e. data) which has one or more variable numerical values associated with it.
- a "control process”, on the other hand, is a function represented as an algorithm comprising at least one 'event state' (see below) with a defined rule(s) for transfer between such states based on the presence of specified input signals. The process can only be in any one state at any given time and transfer from one state to the next is considered to occur instantaneously when the required input signal is present.
- a control process has no means of manipulating data information, and hence is generally used to 'control' (i.e. enable/disable) the operation of subservient data processes and/or other control processes, as the name implies.
- the next stage is to define mathematically the algorithms for all the data processes. This determines how each process responds to the range of possible inputs e.g. whether data is transferred, stored or used in calculations which generate new output flows to initiate further process(es), or combinations of these responses. Algorithms are also defined for all the control processes, but these may be more complex as they normally include 'event states'.
- An 'event state' can be defined as a state of a control process, which reflects the state of the system, or part thereof, as a single definable mode of operation.
- Specific events i.e. signals
- the design tool then combines all the algorithms into a single, unified entity representing the whole system. More specifically, the design tool will normally take the form of a computer program to which the algorithms are added as sections of computer code; these are compiled and linked to form a new program specific to the system to be simulated.
- colour coding e.g. a first colour to indicate inactivity, a second colour to indicate data transmission, a third colour to indicate processing of data etc.
- the software preferably includes means of logging all the data transfers, control processes and actions resulting in order to provide a statistical record so that a subsequent print-out may be studied in detail to pinpoint weak points in the whole system design.
- threat assessment 14 could be any one of:-
- the advantage of the colour changes is that the computer display shows the progress of the data traffic through the interactive system.
- This is a significant advance in that the logic process can be displayed in pseudo 'real time', i.e. a slowed down version (slowed down deliberately if necessary so that the user can observe the changes more easily) of the actual operation of the system.
- a slowed down version slowed down deliberately if necessary so that the user can observe the changes more easily
- the statistical data may be presented on a user-friendly basis, in addition to the hard copy listing.
- the data flow on each interconnection or "highway" could be represented pictorialy on a V.D.U. screen as a histogram to indicate the data flow as a function of maximum capacity, e.g. as shown in Fig. 16.
- the same technique could be used to illustrate the relative "staleness" of data, i.e. the length of time for which data is unused.
- the vertical axis would represent the amount of data flowing as a percentage of maximum capacity for that data highway.
- the horizontal axis would refer to a number of data highways (denoted A to J).
- highways D and I are rapidly approaching maximum capacity, while F is very little used.
- Such data if it was representative of the norm, and not just a special case, would indicate that the carrying capacity of data highways D and I should be increased and that of F, reduced.
- one of the principle uses of the design tool is to determine hardware requirements such as these for a practical electronics or computer system to be installed in the field (in the above example, on the warship).
- the designer can run the simulation (program) repeatedly to simulate different scenarios, e.g. with differing combinations of inputs, and differing time intervals between each input, to assess the response to particular sets of conditions and hence determine for which scenarios the system would fail to cope. From the display and print out, he can identify particular 'bottlenecks' in the data linkages or process capacities and, by improving the hardware capability at these points, extend the range of operation of the system.
- the "animated" display of changing symbols can be turned off to reduce execution time if desired, which is advantageous when the simulation is run several times, and the statistical analysis relied upon for assessing the results.
- Such a design tool can be used to compare alternative items of hardware for use in implementing a particular process in a practical system, by inputting the appropriate algorithm and running the program. Alternatively, by deciding what algorithm was best for a particular process, the 'ideal' component can be specified and thus manufactured.
- a further use of the design tool is to simulate different levels of damage which could be sustained and yet still allow the system to operate to an acceptable level of efficiency.
- the algorithms for selected data and/or control processes would be effectively removed from the program.
- One way of simulating damage is to include a statistical factor in the process algorithms.
- the algorithm of a process will normally follow precise mathematical rules so that an algorithm may require inputs A, B and C before producing an output D; if, say, damage has occurred and input B is not available, this input cannot be registered and hence there can be no output D.
- a statistical function could be built-in, to cause the process to produce output D if only, say, two out of the three inputs were present but with reduced information content and accuracy.
- a time delay could be included, if required, so that the statistical function would become operative only after a certain number of time intervals had elapsed.
- Further uses of the design tool include modelling transfer of data between intercommunicating systems, e.g. via links 1 (Fig. 1).
- Such data links may be either simplex, half duplex or duplex in nature.
- the data to be transferred can be arranged in priority groupings, e.g. first, second, third priority.
- the data is then transferred between interface ports in priority order and at a transfer rate determined by the preset parameter values of the particular interface. This can prevent the data links becoming blocked by unimportant details when essential information is held up, and by analysis of the utilisation statistics of the interface under varying conditions, an optimum interface type can be specified.
- the design tool may be used on either a micro-basis, to optimise the design of a particular system, or parts of it, or on a macro-basis, to optimise the design of linkages between whole systems.
- a number of processes and flows are shown on levels 6 and 9 bounded by rectangles. This may be further simplified by sub-dividing the number of these processes into smaller groupings as shown in Figs. 14 and 15 (which refer to the level 9 rectangle shown at the left on Fig. 2); the groups shown in each dashed balloon 106, 107, or 108, 109 are calculated as separate entities before being included in the rest of the computation. This principle is analogous to the use of brackets in conventional mathematics. A 'grouping' could, of course, consist of any number of processes down to only one single process, if required.
- the data transference between groupings 106 and 107 or 108 and 109 would be via interfaces 110, and to other groupings, via interfaces 111.
- two interfaces 110 are shown. Though two interfaces could be used in particular cases for computing or electronic reasons, they are used here to avoid the figure becoming over-complicated with criss-crossing data flow arrows.
- Figures 14 and 15 refer to the left hand section of level 9 in Fig. 2.
- the calculation may be repeated for different groupings, selected either in a preprogrammed or random manner. By comparison of the actual computing times and inspection of the statistics files, the optimum pattern of groupings may be determined.
- One of the other advantages of the 'grouping' philosophy is that the variety of architecture thus provided for modelling can assist the designer to define and specify the system and its interrelationships in a better way. Also, the resulting model can be easier to understand physically and the resulting hardware easier to build, i.e. particular groups, or numbers of groups, can be confined to a single printed circuit board. This can have significant advantages in terms of commercial security when all or part of the manufacture has to be subcontracted, as different circuit boards can be manufactured by different suppliers. A system designed on a grouping basis may also be updated more easily than one not so designed.
- VIEMAS software embodiment of the system design tool
- the overall flow diagram is shown in Fig. 5.
- the overall program includes subroutines called "CREATOR”, “EXPANDER”, “BUILDER” and “EXECUTOR” whose function is explained below.
- the logic is as follows. 20 Start 21 CREATOR includes provision for the definition and amendment of the basic layout of the system map (i.e. Figs 2-4) for the particular system under consideration, e.g. countermeasures response. [Each graphics section (e.g. Figs. 3,4) is given a DFD number.] 22 Check on CREATOR 21 and return if error detected. 23 EXPANDER is described later with reference to Fig. 6. 24 Check on EXPANDER 23 and return 25 if error detected.
- BUILDER is the program which translates the algorithms for each data and control process and converts them into machine code. Also included are the supporting subroutines to run the graphics, compute the statistical data, etc. 27 Check for compilation errors. 28 EXECUTOR is described with reference to Figs. 7, 8 and 9-13. 29 Program run. Returns to EXPANDER or EXECUTOR if run is unsuccessful. 30 Stop.
- the EXPANDER 23 section of the program is shown on Fig. 6 and the logic is:- 31 Start. 32
- the data flows, e.g. 12, 13A (Fig. 3) are defined in an input routine.
- the control flows, e.g. 17, 18 (Fig. 4) are similarly defined.
- 34,35 The same procedures are repeated for the Stores. 36,37
- the same procedures are repeated for the data and control processes, e.g. 16 and 7 respectively. 38,39
- the animation modules (Figs. 3,4) are defined in the computer and generated. 24 Check on the amination modules and return along loop 25 if error detected. 40 Stop or GOTO 26 depending on how VIEMAS is being operated.
- the EXECUTOR is the heart of the program and allows the operator to exercise a range of options over how VIEMAS is run.
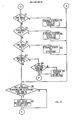
- the flow diagram is shown as a continuation on Figs. 7-8 (setting up) and 9-13 (running).
- the logic for setting up the program is (Figs. 7,8):- 41
- Call EXECUTOR from main program. 42,44 Checks that system is ready to run, i.e. that a viable and fully defined model is present. Errors detection is indicated 43, 45.
- VIEMAS The actual execution of VIEMAS as a whole, i.e. once CREATOR and EXPANDER are complete and the EXECUTOR invoked, is as shown in Figs. 9-13.
- the logic is:- 62 Start execution. K Indicates return from the end of the program for a rerun. 63 Initiate program. 64 There are a series of possible user inputs, designated by letters D,G,H,L,P,R,S,X,Q. The logic considers each one in turn. 65 Input D- Display event list 66, i.e. the input parameters to the scenario arranged in time order, together with internal events generated during the run and awaiting actioning. The next event to be actioned is always at the top of the list.
- the present invention provides a system design tool and a method for use in system design, by which the behaviour of a complex interactive system can be simulated.
- the system is represented as a number of interconnected "processes" and each process is provided with an algorithm to model its function and its interconnections.
- the processes may be arranged in a layered hierarchical structure and each process can have functions such as supplying data from a sensor, relaying data or processing data.
- the algorithms are combined into an overall model of the system, and the system model is supplied with data on initial conditions of the system.
- the system model (for example, a computer program) is then executed using the data on initial conditions so as to perform a simulation of the system, with additional data being supplied during execution to simulate changes in external conditions affecting the system.
- the progress of the simulation can be monitored on a display which shows a logic diagram representing at least part of the system, with symbols representing individual processes which change colour, or change in some other way, to show whether the respective process is inactive, transmitting data, processing data or the like. This allows potential bottlenecks or other problem areas in the system to be identified.
- the system design tool and method can be applied to a wide range of interactive systems, such as transport systems, telecommunications networks, chemical plants and so forth.
Landscapes
- Engineering & Computer Science (AREA)
- Physics & Mathematics (AREA)
- Theoretical Computer Science (AREA)
- Geometry (AREA)
- General Engineering & Computer Science (AREA)
- General Physics & Mathematics (AREA)
- Computer Hardware Design (AREA)
- Evolutionary Computation (AREA)
- Software Systems (AREA)
- Automation & Control Theory (AREA)
- Aviation & Aerospace Engineering (AREA)
- Computational Mathematics (AREA)
- Mathematical Analysis (AREA)
- Mathematical Optimization (AREA)
- Pure & Applied Mathematics (AREA)
- Management, Administration, Business Operations System, And Electronic Commerce (AREA)
- Testing And Monitoring For Control Systems (AREA)
Applications Claiming Priority (2)
| Application Number | Priority Date | Filing Date | Title |
|---|---|---|---|
| GB888823747A GB8823747D0 (en) | 1988-10-10 | 1988-10-10 | System design tool |
| GB8823747 | 1988-10-10 |
Publications (2)
| Publication Number | Publication Date |
|---|---|
| EP0364189A2 true EP0364189A2 (de) | 1990-04-18 |
| EP0364189A3 EP0364189A3 (de) | 1992-09-30 |
Family
ID=10644971
Family Applications (1)
| Application Number | Title | Priority Date | Filing Date |
|---|---|---|---|
| EP19890310299 Withdrawn EP0364189A3 (de) | 1988-10-10 | 1989-10-09 | Systementwurfsverfahren und -werkzeug |
Country Status (3)
| Country | Link |
|---|---|
| EP (1) | EP0364189A3 (de) |
| CA (1) | CA2000231A1 (de) |
| GB (1) | GB8823747D0 (de) |
Cited By (19)
| Publication number | Priority date | Publication date | Assignee | Title |
|---|---|---|---|---|
| GB2247597A (en) * | 1990-08-31 | 1992-03-04 | Canon Res Ct Europe Ltd | Image processing sequences |
| EP0453160A3 (en) * | 1990-04-20 | 1993-09-15 | Digital Equipment Corporation | A method and apparatus for analyzing the flow of data through a complex information exchange system |
| EP0411873A3 (en) * | 1989-08-02 | 1993-11-18 | Westinghouse Electric Corp | Improved plant operating system employing a deterministic, probabilistic and subjective modeling system |
| EP0576577A4 (en) * | 1991-03-20 | 1994-08-24 | Vlsi Technology Inc | Circuit simulation interface methods |
| GB2301717A (en) * | 1995-06-02 | 1996-12-11 | Dsc Communications | Network controller for monitoring the status of a network |
| US5696766A (en) * | 1995-06-02 | 1997-12-09 | Dsc Communications Corporation | Apparatus and method of synchronizing a transmitter in a subscriber terminal of a wireless telecommunications system |
| US5742595A (en) * | 1995-06-02 | 1998-04-21 | Dsc Communications Corporation | Processing CDMA signals |
| US5745496A (en) * | 1995-06-02 | 1998-04-28 | Dsc Communications Corporation | Apparatus and method of establishing a downlink communication path in a wireless telecommunications system |
| US5786770A (en) * | 1995-06-02 | 1998-07-28 | Dsc Communications Corporation | Message handling in a telecommunications network |
| US5809093A (en) * | 1995-06-02 | 1998-09-15 | Dsc Communications Corporation | Apparatus and method of frame aligning information in a wireless telecommunications system |
| US5815798A (en) * | 1995-06-02 | 1998-09-29 | Dsc Communications Corporation | Apparatus and method of controlling transmitting power in a subscriber terminal of a wireless telecommunications system |
| US5828339A (en) * | 1995-06-02 | 1998-10-27 | Dsc Communications Corporation | Integrated directional antenna |
| US5838913A (en) * | 1995-06-02 | 1998-11-17 | Dsc Communications Corporation | Control message transmission in telecommunications systems |
| US5915216A (en) * | 1995-06-02 | 1999-06-22 | Dsc Communications Corporation | Apparatus and method of transmitting and receiving information in a wireless telecommunications system |
| US6061365A (en) * | 1995-06-02 | 2000-05-09 | Airspan Communications Corporation | Control message transmission in telecommunications systems |
| EP1067444A3 (de) * | 1999-04-08 | 2001-02-07 | Siemens Aktiengesellschaft | Verfahren und Anordnung zur Modellierung eines technischen Systems |
| EP1353288A3 (de) * | 1995-04-14 | 2005-01-12 | Interleukin Genetics, Inc. | System und Verfahren zum Erstellen eines hierarchischen biologischen Modells |
| US7743079B1 (en) | 2006-07-31 | 2010-06-22 | Microsoft Corporation | Managing data across a semantic data view and a presentation data view |
| US8006179B2 (en) | 2006-07-31 | 2011-08-23 | Microsoft Corporation | Wrapping nodes in a drawing canvas |
-
1988
- 1988-10-10 GB GB888823747A patent/GB8823747D0/en active Pending
-
1989
- 1989-10-05 CA CA002000231A patent/CA2000231A1/en not_active Abandoned
- 1989-10-09 EP EP19890310299 patent/EP0364189A3/de not_active Withdrawn
Non-Patent Citations (5)
| Title |
|---|
| COMPUTER DESIGN. vol. 27, no. 1, January 1988, LITTLETON, MASSACHUSETTS US pages 53 - 74; FALK: 'CASE TOOLS EMERGE TO HANDLE REAL-TIME SYSTEMS' * |
| COMPUTER. vol. 18, no. 8, August 1985, NEW YORK US pages 87 - 94; MELAMED ET AL: 'visual simulation : the performance analysis workstation' * |
| PAUL T.WARD AND STEPHEN J.MELLOR "STRUCTURED DEVELOPMENT FOR REAL-TIME SYSTEMS " VOLUME 1 1985, YOURDON PRESS COMPUTING SERIES US pages 93 - 107; * |
| PROCEEDINGS OF THE IEEE 1985 NATIONAL AEROSPACE AND ELECTRONICS CONFERENCE MAY20-24 1985 US pages 826 - 833; COOPER: 'using saint in performance analysis of complex hardware/software systems' * |
| THE EIGHTEENTH INTERNATIONAL SYMPOSIUM ON FAULT-TOLERANT COMPUTING JUNE 27-30 1988 TOKYO JAPAN pages 102 - 107; SEGALL ET AL: 'fiat - fault injection based automated testing environment' * |
Cited By (26)
| Publication number | Priority date | Publication date | Assignee | Title |
|---|---|---|---|---|
| EP0411873A3 (en) * | 1989-08-02 | 1993-11-18 | Westinghouse Electric Corp | Improved plant operating system employing a deterministic, probabilistic and subjective modeling system |
| EP0453160A3 (en) * | 1990-04-20 | 1993-09-15 | Digital Equipment Corporation | A method and apparatus for analyzing the flow of data through a complex information exchange system |
| US5487131A (en) * | 1990-04-20 | 1996-01-23 | Digital Equipment Corporation | Method for analyzing the flow of data through a complex information exchange system |
| GB2247597A (en) * | 1990-08-31 | 1992-03-04 | Canon Res Ct Europe Ltd | Image processing sequences |
| GB2247597B (en) * | 1990-08-31 | 1995-03-08 | Canon Res Ct Europe Ltd | Image processing |
| US5631974A (en) * | 1990-08-31 | 1997-05-20 | Canon Research Centre Europe, Ltd. | Image processing |
| EP0576577A4 (en) * | 1991-03-20 | 1994-08-24 | Vlsi Technology Inc | Circuit simulation interface methods |
| EP1353288A3 (de) * | 1995-04-14 | 2005-01-12 | Interleukin Genetics, Inc. | System und Verfahren zum Erstellen eines hierarchischen biologischen Modells |
| US5786770A (en) * | 1995-06-02 | 1998-07-28 | Dsc Communications Corporation | Message handling in a telecommunications network |
| US5915216A (en) * | 1995-06-02 | 1999-06-22 | Dsc Communications Corporation | Apparatus and method of transmitting and receiving information in a wireless telecommunications system |
| US5745496A (en) * | 1995-06-02 | 1998-04-28 | Dsc Communications Corporation | Apparatus and method of establishing a downlink communication path in a wireless telecommunications system |
| US5761429A (en) * | 1995-06-02 | 1998-06-02 | Dsc Communications Corporation | Network controller for monitoring the status of a network |
| US5696766A (en) * | 1995-06-02 | 1997-12-09 | Dsc Communications Corporation | Apparatus and method of synchronizing a transmitter in a subscriber terminal of a wireless telecommunications system |
| US5809093A (en) * | 1995-06-02 | 1998-09-15 | Dsc Communications Corporation | Apparatus and method of frame aligning information in a wireless telecommunications system |
| US5815798A (en) * | 1995-06-02 | 1998-09-29 | Dsc Communications Corporation | Apparatus and method of controlling transmitting power in a subscriber terminal of a wireless telecommunications system |
| US5828339A (en) * | 1995-06-02 | 1998-10-27 | Dsc Communications Corporation | Integrated directional antenna |
| US5838913A (en) * | 1995-06-02 | 1998-11-17 | Dsc Communications Corporation | Control message transmission in telecommunications systems |
| US5742595A (en) * | 1995-06-02 | 1998-04-21 | Dsc Communications Corporation | Processing CDMA signals |
| US5923668A (en) * | 1995-06-02 | 1999-07-13 | Airspan Communications Corporation | Apparatus and method of establishing a downlink communication path in a wireless telecommunications system |
| GB2301717B (en) * | 1995-06-02 | 1999-08-11 | Dsc Communications | Network controller for monitoring the status of a network |
| US6061365A (en) * | 1995-06-02 | 2000-05-09 | Airspan Communications Corporation | Control message transmission in telecommunications systems |
| GB2301717A (en) * | 1995-06-02 | 1996-12-11 | Dsc Communications | Network controller for monitoring the status of a network |
| EP1067444A3 (de) * | 1999-04-08 | 2001-02-07 | Siemens Aktiengesellschaft | Verfahren und Anordnung zur Modellierung eines technischen Systems |
| US7743079B1 (en) | 2006-07-31 | 2010-06-22 | Microsoft Corporation | Managing data across a semantic data view and a presentation data view |
| US8006179B2 (en) | 2006-07-31 | 2011-08-23 | Microsoft Corporation | Wrapping nodes in a drawing canvas |
| US8170983B2 (en) | 2006-07-31 | 2012-05-01 | Microsoft Corporation | Managing data across a semantic data view and a presentation data view |
Also Published As
| Publication number | Publication date |
|---|---|
| CA2000231A1 (en) | 1990-04-10 |
| EP0364189A3 (de) | 1992-09-30 |
| GB8823747D0 (en) | 1988-11-16 |
Similar Documents
| Publication | Publication Date | Title |
|---|---|---|
| CA2000231A1 (en) | System design tool and method | |
| US7725303B2 (en) | Device and method for checking railway logical software engines for commanding plants, particularly station plants | |
| US8260736B1 (en) | Intelligent system manager system and method | |
| Parasuraman et al. | A model for types and levels of human interaction with automation | |
| Silverman et al. | Expert critics in engineering design: Lessons learned and research needs | |
| WO1992022869A1 (en) | Generation and simulation of knowledge bases | |
| Lane et al. | The human operator simulator: An overview | |
| Skjetne et al. | Hardware-in-the-loop testing of marine control system | |
| Zhao et al. | Risk identification and safety assessment of human-computer interaction in integrated avionics based on STAMP | |
| Shapiro | Ferrets in a sack? Ethnographic studies and task analysis in CSCW | |
| Rasmussen | Notes on diagnostic strategies in process plant environment | |
| Coppola | Artificial intelligence applications to maintenance | |
| Wahlström | Design of decision support systems | |
| Williams | One view of the future of industrial control | |
| McAfoos et al. | FCMDS: a knowledge-based system's impact on logistics | |
| Wherry | Norman E. Lane, Melvin I. Strieb, FA Glenn and | |
| Hunter et al. | A naturalistic decision making model for simulated human combatants | |
| RU43094U1 (ru) | Тренажер грузобалластных и технологических операций на танкерах и береговых терминалах | |
| Darvish et al. | Portable knowledge-based diagnostic and maintenance systems | |
| RU2273889C1 (ru) | Тренажер грузобалластных и технологических операций на танкерах и береговых терминалах | |
| Parente et al. | A description of steamship cargo operations: An illustration of the process concept for simulation modeling | |
| Iacono et al. | Maintainability Design Review of the AN/SQS-26CX Sonar System | |
| Andes Jr et al. | Adaptive aiding for human-computer control: Final report and future directions for research | |
| Malone et al. | Enhancement of human reliability in port and shipping operations | |
| Ketcham et al. | SARPI: A simulator for assessing cognitive tasks in process control |
Legal Events
| Date | Code | Title | Description |
|---|---|---|---|
| PUAI | Public reference made under article 153(3) epc to a published international application that has entered the european phase |
Free format text: ORIGINAL CODE: 0009012 |
|
| AK | Designated contracting states |
Kind code of ref document: A2 Designated state(s): DE ES FR GB IT NL SE |
|
| PUAL | Search report despatched |
Free format text: ORIGINAL CODE: 0009013 |
|
| AK | Designated contracting states |
Kind code of ref document: A3 Designated state(s): DE ES FR GB IT NL SE |
|
| STAA | Information on the status of an ep patent application or granted ep patent |
Free format text: STATUS: THE APPLICATION IS DEEMED TO BE WITHDRAWN |
|
| 18D | Application deemed to be withdrawn |
Effective date: 19921030 |