EP0450809A2 - Verfahren und Anordnung zum Messen der Frequenz einer Spektrallinie - Google Patents
Verfahren und Anordnung zum Messen der Frequenz einer Spektrallinie Download PDFInfo
- Publication number
- EP0450809A2 EP0450809A2 EP91302436A EP91302436A EP0450809A2 EP 0450809 A2 EP0450809 A2 EP 0450809A2 EP 91302436 A EP91302436 A EP 91302436A EP 91302436 A EP91302436 A EP 91302436A EP 0450809 A2 EP0450809 A2 EP 0450809A2
- Authority
- EP
- European Patent Office
- Prior art keywords
- ampl
- frequency
- log
- gaussian
- filter
- Prior art date
- Legal status (The legal status is an assumption and is not a legal conclusion. Google has not performed a legal analysis and makes no representation as to the accuracy of the status listed.)
- Withdrawn
Links
Images
Classifications
-
- G—PHYSICS
- G01—MEASURING; TESTING
- G01R—MEASURING ELECTRIC VARIABLES; MEASURING MAGNETIC VARIABLES
- G01R23/00—Arrangements for measuring frequencies; Arrangements for analysing frequency spectra
- G01R23/16—Spectrum analysis; Fourier analysis
- G01R23/165—Spectrum analysis; Fourier analysis using filters
Definitions
- This invention relates to the field of frequency measurement and analysis, and more particularly to field of accurately measuring the frequency of individual spectral lines by interpolation between the responses of two filters, or the response of one filter as the spectral line is moved with respect to that filter's center frequency by a sweeping local oscillator.
- a spectrum analyzer is an electronic instrument for providing a frequency domain view of an electrical signal, i.e., how the energy of the signal is distributed in terms of frequency.
- Many spectrum analyzers both digital and analog, rely on banks of filters to determine the amount of energy occurring at different frequencies.
- an analog spectrum analyzer a number of physical filters tuned to different frequencies each respond to an input signal that may be shifted in frequency by mixing with a local oscillator.
- Digital spectrum analyzers can apply the same principle using digital filters instead of analog ones. These analyzers first sample and digitize the activity of the signal under analysis to produce a series of time domain digitized samples. The sampling rate must be at least twice as high as the bandwidth of interest. Those time domain samples are then applied to a bank of digital band pass filters tuned to different frequencies to cover the frequency band of the input signal. The output of those filters can be sampled (simultaneously) at a rate proportional to their bandwidth, to avoid aliasing.
- DFT Discrete Fourier Transform
- FFT Fast Fourier Transform
- each of the outputs filters i.e. its frequency response, and hence its impulse response, is independent of the number of filters.
- the number of samples in the time record and the number of output bins or filters are selectable, and may differ from each other, but the implementation of the FFT algorithm requires that the number of filters to be equal to the radix of the FFT raised to the power of an integer number.
- the available hardware is fast enough, it is possible to build fewer filters, for example, m filters, where m ⁇ K. This can be done by time sharing the hardware between the lesser number of filters to achieve the K required filters.
- This time sharing approach can be implemented in either of two ways. Either the hardware for a single band pass filter can be shared between K/m filters by changing the center frequency of the hardware. Or, the hardware of a single low pass filter can be shared between K/m filters by demodulating the input signal by different frequencies, each of which corresponds to the desired filter center frequencies. These demodulated signals are then put through the single low pass filter and then remodulated back up by the same amount that they were demodulated previously.
- Fig. 1 illustrates the hardware equivalent of the latter approach.
- a single hardware realized filter can be time-shared into a bank of equally spaced filters. To do this it is necessary to sample the output at a rate of r*Fs/K, where Fs is the sampling frequency of the input signal, r is a constant that depends on the filter shape, and K is the number of filter increments across the desired analysis span. The relationship between Fs and the frequency span is determined by the Nyquist theorem.
- a wide variety of filter shapes have also been employed by the designers of analog spectrum analyzers.
- One of the filter shapes used in analog spectrum analyzers and in radars is a Gaussian filter shape (equation 1).
- ⁇ ⁇ is one standard deviation measured in frequency
- ⁇ c is the center frequency
- ⁇ x is any frequency of interest.
- What is desired is a method and apparatus for interpolating the location of a spectral line between the center frequencies of two adjacent filters, or one filter if the signal is moved with respect to its center frequency, that is fast and accurate and is suitable for use in digital as well as analog spectrum analyzers.
- a sweeping local oscillator output can be mixed with the signal containing the spectral line of unknown frequency and the resulting signal applied to one Gaussian filter at two different times to produce equivalent results.
- the degree of measurement accuracy can be determined in advance by the choice of sigma-f.
- FIG. 1 is a block diagram of the hardware equivalent of digital demodulation and remodulation technique of the prior art.
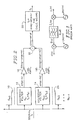
- FIG. 2 is a conceptual block diagram of the functions necessary to practice the present invention.
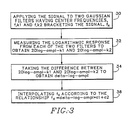
- FIG. 3 is a flow chart of the procedure illustrated in block diagram form in Fig. 2.
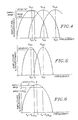
- FIG. 4 shows the response of two Gaussian filters as a plot of frequency versus logarithmic amplitude.
- FIG. 5 is similar to Fig. 4, but with a different value for sigma-f.
- FIG. 6 shows the responses of one Gaussian filter at two times as the input signal is swept across the filter by a sweeping local oscillator.
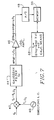
- FIG. 7 is a block diagram of the circuitry used to practice the technique of the present invention using a single Gaussian filter.
- Gaussian functions have the interesting property of remaining Gaussian as they are transformed back and forth between the time and frequency domains.
- a set of weighting coefficient data fitting the Gaussian relationship shown in equation 5 is applied to the input of a means for performing the Discrete Fourier Transform (DFT)
- the Gaussian filter shape of equation 1 appears on the output filter bins of the DFT means.
- ⁇ t is one standard deviation measured in time increments
- t c is the center of the time record
- t is any location in the time record.
- a signal containing a pure sinusoid of unknown frequency fx is applied to a bank of filters, G,0 to G,K-1, having center frequencies f,0 to f,k-1.
- This unknown signal f,x happens to have a frequency somewhere between the center frequencies f,k1 and f,k2 of Gaussian filters G,k1 12 and G,k2 14.
- Gaussian filter G,k1 12 with its center frequency at f,k1 produces an amplitude response ampl-k1.
- Gaussian filter G,k2 14 with its center frequency at f,k2 produces an amplitude response ampl-k2.
- Logarithmic amplifier 16 receives the output of Gaussian filter G,k1 12 ampl-k1 and produces a signal 20log-ampl-k1 representative of that input.
- logarithmic amplifier 18 receives the output of Gaussian filter G,k2 14 ampl-k2 and produces a signal 20log-ampl-k2 representative of that input.
- Difference circuit 20 compares the output of logarithmic amplifier 16 and logarithmic amplifier 18 and produces a signal, delta-log-ampl, proportional to their difference.
- a calculation means 22 interpolates the unknown frequency of the input sinusoid signal fx according to equation (2).
- the method illustrated in Fig. 2 is initiated by applying 30 the sinusoidal signal of unknown frequency to two Gaussian filters. This step is easily accomplished for a whole span of frequencies when a bank of overlapping filters are employed. Two such filters are shown in Fig. 2 as Gaussian filters G,k1 12 and G,k2 14.
- Equation 1 represents the output of any one of the resulting filter bin outputs.
- Equation 6 shows the difference between the amplitude output of two adjacent filters, G,k1 and G,k2, converted to decibels.
- Equation 7 is a simplification of equation 6, with the first and third terms on the right cancelled out and some other rearrangements, and with the left side expressed more directly as a decibel difference.
- Fig. 4 shows the power output of two filters according to the present invention in logarithmic form.
- Filter G,k1 has a center frequency f,k1 and filter G,k2 has a center frequency f,k2.
- a spectral line is measured by both filters at frequency fx.
- Filter G,k1 responds to the signal by producing logarithmic amplitude indication ampl-k1.
- Filter G,k2 responds to the signal by producing logarithmic amplitude indication ampl-k2.
- the difference between ampl-k1 and ampl-k2, delta-ampl is used in accordance with equation 2 to find the interpolated frequency of the spectral line, fx.
- Equation 2 determines the frequency resolution attainable with this approach.
- c1 is small, a given change in frequency shows up as larger and more easily measurable changes in delta-ampl. Conversely, the bigger c1 is, the less delta-ampl is associated with a given change in frequency. Larger values of c1 lower the frequency resolution, while smaller values of c1 increase the frequency resolution.
- sigma-f in equation 3 is the width of one standard deviation measured in frequency. As sigma-f is made smaller, the filter shapes shown in Fig. 4 become narrower like those shown in Fig. 5. Up to a point, this is beneficial because it increases the frequency resolution that can be attained.
- sigma-t 1 2 ⁇ ⁇
- the actual response of the resulting filters is compared with the desired response to produce an indication of the difference between the desired and actual responses versus frequency.
- This difference between the desired response and the actual response of the resulting filters is then examined over two regions to ascertain how accurately the design criteria have been met. Within the bandpass region, this difference between the desired response and the actual response describes the fit of the actual results to the desired sigma-f. In the stopband region, this difference, to the extent that it is negative, indicates how inadequately sidelobe artifacts are suppressed. The latter, if inadequate, can be adjusted by increasing the window length or finding a more suitable windowing function.
- the fit to the desired sigma-f can be improved by either of these methods or by putting an adjustment into the values of c1 and c2, so that the actual delta-log-Ampl results are more accurately convertible into correct frequency results.
- the modified values for c1 and c2 are found by doing a least squares fit of the values of equation (2) to the actual results until errors are satisfactorily minimized.
- Equations (2), (3), and (4) can still be used to calculate the frequency fx of the unknown spectral line, if substitutions are made for f,k1 and f,k2 according to equations (9) and (10):
- the output of a sweeping local oscillator 40 is mixed with the unknown signal fx by mixer 42.
- this mixed signal (fx - f,LO-t1) is applied to the Gaussian filter 44.
- the output of the Gaussian filter 44 at this time, ampl-LO-t1 is applied to Logarithmic Amplifier 46 to produce 20log-ampl-LO-t1.
- This analog signal may be converted to a digital quantity by A/D converter 48 and stored in Memory 50.
- the mixed signal (fx - f,LO-t2) is applied to the Gaussian filter 44.
- the output of the Gaussian filter 44 at this time, ampl-LO-t2 is applied to Logarithmic Amplifier 46 to produce 20log-ampl-LO-t2.
- This analog signal may also be converted to a digital quantity by A/D converter 48 and also stored in Memory 50.
- Calculating Means 52 can then retrieve the stored digital values of 20log-ampl-LO-t1 and 20log-ampl-LO-t2 and determine delta-log-ampl.
- the value of fx can be determined from delta-log-ampl according to equations (2), (3), and (4), after the substitutions of equation (9) and (10) are performed.
- c1 is proportional to the square of the standard deviation of the Gaussian filter and inversely proportional to the difference between the local oscillator frequencies, f,LO-t1 and f,LO-t2, times the logarithm of e
- c2 is the average of the local oscillator frequencies at the first and second times, f,LO-t1 and f,LO-t2, plus f, the center frequency of the Gaussian filter.
- analog-to-digital converter 48 and memory 50 is one of several possible implementations.
- the output of the logarithmic amplifier 46, corresponding to the first measurement of the Gaussian filter 44 output could be switched and delayed until it was time aligned with the output corresponding to the second measurement of the Gaussian filter output, thus permitting an analog comparator to measure the delta-log-ampl value.
Landscapes
- Physics & Mathematics (AREA)
- Mathematical Physics (AREA)
- General Physics & Mathematics (AREA)
- Measuring Frequencies, Analyzing Spectra (AREA)
Applications Claiming Priority (2)
| Application Number | Priority Date | Filing Date | Title |
|---|---|---|---|
| US505878 | 1990-04-06 | ||
| US07/505,878 US5075619A (en) | 1990-04-06 | 1990-04-06 | Method and apparatus for measuring the frequency of a spectral line |
Publications (2)
| Publication Number | Publication Date |
|---|---|
| EP0450809A2 true EP0450809A2 (de) | 1991-10-09 |
| EP0450809A3 EP0450809A3 (en) | 1992-12-23 |
Family
ID=24012252
Family Applications (1)
| Application Number | Title | Priority Date | Filing Date |
|---|---|---|---|
| EP19910302436 Withdrawn EP0450809A3 (en) | 1990-04-06 | 1991-03-20 | Method and apparatus for measuring the frequency of a spectral line |
Country Status (3)
| Country | Link |
|---|---|
| US (1) | US5075619A (de) |
| EP (1) | EP0450809A3 (de) |
| JP (1) | JPH0750136B2 (de) |
Cited By (16)
| Publication number | Priority date | Publication date | Assignee | Title |
|---|---|---|---|---|
| GB2357205A (en) * | 1999-12-07 | 2001-06-13 | Ericsson Telefon Ab L M | Analysing signals |
| DE10237342A1 (de) * | 2002-08-14 | 2004-03-04 | Fraunhofer-Gesellschaft zur Förderung der angewandten Forschung e.V. | Verfahren und Vorrichtung zur Fehlerstromüberwachung in einem elektrischen Wechselstromnetz |
| EP4127740A4 (de) * | 2020-03-25 | 2024-04-24 | SeekOps Inc. | Logarithmischer demodulator für laserwellenlängenmodulationsspektroskopie |
| US12055485B2 (en) | 2020-02-05 | 2024-08-06 | Seekops Inc. | Multispecies measurement platform using absorption spectroscopy for measurement of co-emitted trace gases |
| US12130204B2 (en) | 2019-08-05 | 2024-10-29 | Seekops Inc. | Rapidly deployable UAS system for autonomous inspection operations using a combined payload |
| US12188847B2 (en) | 2019-04-05 | 2025-01-07 | Seekops Inc. | Time-and data-efficient assurance of leak detection |
| US12197233B2 (en) | 2019-10-04 | 2025-01-14 | Seekops Inc. | Closed surface flight pattern generation for unmanned aerial vehicle (UAV) flux plane assessment of large facilities |
| US12217412B2 (en) | 2020-07-17 | 2025-02-04 | Seekops Inc. | Systems and methods of automated detection of gas plumes using optical imaging |
| US12216105B2 (en) | 2018-06-19 | 2025-02-04 | Seekops Inc. | Localization analytics algorithms and methods |
| US12276597B2 (en) | 2020-02-05 | 2025-04-15 | Seekops Inc. | Multiple path length optical cell for trace gas measurement |
| US12281983B2 (en) | 2018-10-22 | 2025-04-22 | Seekops Inc. | UAV-borne, high-bandwidth, lightweight point sensor for quantifying greenhouse gases in atmospheric strata |
| US12392680B2 (en) | 2019-09-20 | 2025-08-19 | Seekops Inc. | Spectral fitting of compact laser-based trace gas sensor measurements for high dynamic range (HDR) |
| US12399164B2 (en) | 2018-06-19 | 2025-08-26 | Seekops Inc. | Emissions estimate model algorithms and methods |
| US12449409B2 (en) | 2018-06-19 | 2025-10-21 | Seekops Inc. | Emissions estimate model algorithms and methods |
| US12475798B2 (en) | 2020-07-17 | 2025-11-18 | Seekops Inc. | UAS work practice |
| US12480867B2 (en) | 2020-10-27 | 2025-11-25 | Seekops Inc. | Methods and apparatus for measuring methane emissions with an optical open-cavity methane sensor |
Families Citing this family (23)
| Publication number | Priority date | Publication date | Assignee | Title |
|---|---|---|---|---|
| US5291125A (en) * | 1992-09-14 | 1994-03-01 | The United States Of America As Represented By The Secretary Of The Air Force | Instantaneous frequency measurement (IFM) receiver with two signal capability |
| JP3147566B2 (ja) * | 1993-02-01 | 2001-03-19 | 日本精工株式会社 | 周波数スペクトル分析装置 |
| JPH07226779A (ja) * | 1994-02-15 | 1995-08-22 | Nec Eng Ltd | 周波数検出回路 |
| US5801525A (en) * | 1996-06-12 | 1998-09-01 | Wiltron Company | Frequency discriminating power sensor |
| US6898333B1 (en) * | 1999-08-06 | 2005-05-24 | Cognex Corporation | Methods and apparatus for determining the orientation of an object in an image |
| US7099830B1 (en) * | 2000-03-29 | 2006-08-29 | At&T Corp. | Effective deployment of temporal noise shaping (TNS) filters |
| US6735561B1 (en) | 2000-03-29 | 2004-05-11 | At&T Corp. | Effective deployment of temporal noise shaping (TNS) filters |
| DE10039666B4 (de) * | 2000-08-14 | 2011-08-11 | Rohde & Schwarz GmbH & Co. KG, 81671 | Verfahren und Vorrichtung zur Abschätzung der Frequenz und/oder der Phase eines digitalen Signals |
| DE10105258B4 (de) * | 2001-02-06 | 2011-02-03 | Rohde & Schwarz Gmbh & Co. Kg | Auflösungs-Filter für einen Spektrumanalysator |
| DE102004050912B4 (de) * | 2004-04-05 | 2009-09-10 | Rohde & Schwarz Gmbh & Co. Kg | Verfahren und Vorrichtung zur Erhöhung des Dynamikbereichs und der Meßgenauigkeit einer Meßeinrichtung zur Spektrum- und/oder Netzwerkanalyse |
| JP2007537630A (ja) * | 2004-05-12 | 2007-12-20 | ディーイーキューエックス ピーティーワイ リミテッド | デジタルフィルタ設計システムおよび方法 |
| DE102004051386A1 (de) * | 2004-09-28 | 2006-04-06 | Rohde & Schwarz Gmbh & Co. Kg | Verfahren und Vorrichtung zur Spektrumanalyse in mehreren Frequenzbändern mit verschiedener Frequenzauflösung |
| ES2294631T3 (es) * | 2005-02-25 | 2008-04-01 | Nemerix Sa | Discriminador de frecuencia lineal half bin. |
| JP2007101249A (ja) * | 2005-09-30 | 2007-04-19 | Fujifilm Corp | 光断層画像化方法および装置 |
| ATE450928T1 (de) * | 2006-03-22 | 2009-12-15 | Qualcomm Inc | Breitband frequenzdiskriminator und funkortungsempfänger |
| US10371732B2 (en) | 2012-10-26 | 2019-08-06 | Keysight Technologies, Inc. | Method and system for performing real-time spectral analysis of non-stationary signal |
| WO2014125958A1 (ja) * | 2013-02-12 | 2014-08-21 | 古野電気株式会社 | レーダ装置、及び干渉抑制方法 |
| GB2518010A (en) | 2013-09-09 | 2015-03-11 | Crfs Ltd | Frequency discriminator |
| JP6154359B2 (ja) * | 2014-07-31 | 2017-06-28 | アンリツ株式会社 | ミリ波帯スペクトラム解析装置およびそれに用いるミリ波帯フィルタの制御情報補正方法 |
| US12044666B2 (en) | 2018-07-30 | 2024-07-23 | Seekops Inc. | Ultra-lightweight, handheld gas leak detection device |
| EP3949039A4 (de) | 2019-04-05 | 2022-11-30 | SeekOps Inc. | Analogsignalverarbeitung für einen leichten und kompakten spurengassensor auf laserbasis |
| US11614430B2 (en) | 2019-12-19 | 2023-03-28 | Seekops Inc. | Concurrent in-situ measurement of wind speed and trace gases on mobile platforms for localization and qualification of emissions |
| US11988598B2 (en) | 2019-12-31 | 2024-05-21 | Seekops Inc. | Optical cell cleaner |
Family Cites Families (9)
| Publication number | Priority date | Publication date | Assignee | Title |
|---|---|---|---|---|
| US3215934A (en) * | 1960-10-21 | 1965-11-02 | Sylvania Electric Prod | System for quantizing intelligence according to ratio of outputs of adjacent band-pass filters |
| US3774201A (en) * | 1970-12-17 | 1973-11-20 | Raytheon Co | Time compression signal processor |
| SU553548A1 (ru) * | 1975-02-11 | 1977-04-05 | Спектроанализатор | |
| US4034299A (en) * | 1975-12-29 | 1977-07-05 | Motorola, Inc. | Audio signal quality indicator |
| US4301454A (en) * | 1979-11-30 | 1981-11-17 | Bunker Ramo Corporation | Channelized receiver system |
| US4328497A (en) * | 1980-08-11 | 1982-05-04 | Westinghouse Electric Corp. | Method and system for jamming analysis and transmission selection |
| US4610540A (en) * | 1982-07-06 | 1986-09-09 | General Electric Company | Frequency burst analyzer |
| US4739331A (en) * | 1985-10-09 | 1988-04-19 | Westinghouse Electric Corp. | Channelized receiver continuous wave radar system |
| JPH01296169A (ja) * | 1988-05-24 | 1989-11-29 | Sony Corp | スペクトラムアナライザ |
-
1990
- 1990-04-06 US US07/505,878 patent/US5075619A/en not_active Expired - Lifetime
-
1991
- 1991-03-20 EP EP19910302436 patent/EP0450809A3/en not_active Withdrawn
- 1991-04-05 JP JP3101938A patent/JPH0750136B2/ja not_active Expired - Lifetime
Cited By (19)
| Publication number | Priority date | Publication date | Assignee | Title |
|---|---|---|---|---|
| GB2357205B (en) * | 1999-12-07 | 2004-02-25 | Ericsson Telefon Ab L M | Analysing signals |
| GB2357205A (en) * | 1999-12-07 | 2001-06-13 | Ericsson Telefon Ab L M | Analysing signals |
| DE10237342A1 (de) * | 2002-08-14 | 2004-03-04 | Fraunhofer-Gesellschaft zur Förderung der angewandten Forschung e.V. | Verfahren und Vorrichtung zur Fehlerstromüberwachung in einem elektrischen Wechselstromnetz |
| DE10237342B4 (de) * | 2002-08-14 | 2004-07-29 | Fraunhofer-Gesellschaft zur Förderung der angewandten Forschung e.V. | Verfahren und Vorrichtung zur Fehlerstromüberwachung in einem elektrischen Wechselstromnetz |
| US12449409B2 (en) | 2018-06-19 | 2025-10-21 | Seekops Inc. | Emissions estimate model algorithms and methods |
| US12399164B2 (en) | 2018-06-19 | 2025-08-26 | Seekops Inc. | Emissions estimate model algorithms and methods |
| US12216105B2 (en) | 2018-06-19 | 2025-02-04 | Seekops Inc. | Localization analytics algorithms and methods |
| US12281983B2 (en) | 2018-10-22 | 2025-04-22 | Seekops Inc. | UAV-borne, high-bandwidth, lightweight point sensor for quantifying greenhouse gases in atmospheric strata |
| US12188847B2 (en) | 2019-04-05 | 2025-01-07 | Seekops Inc. | Time-and data-efficient assurance of leak detection |
| US12130204B2 (en) | 2019-08-05 | 2024-10-29 | Seekops Inc. | Rapidly deployable UAS system for autonomous inspection operations using a combined payload |
| US12392680B2 (en) | 2019-09-20 | 2025-08-19 | Seekops Inc. | Spectral fitting of compact laser-based trace gas sensor measurements for high dynamic range (HDR) |
| US12197233B2 (en) | 2019-10-04 | 2025-01-14 | Seekops Inc. | Closed surface flight pattern generation for unmanned aerial vehicle (UAV) flux plane assessment of large facilities |
| US12276597B2 (en) | 2020-02-05 | 2025-04-15 | Seekops Inc. | Multiple path length optical cell for trace gas measurement |
| US12055485B2 (en) | 2020-02-05 | 2024-08-06 | Seekops Inc. | Multispecies measurement platform using absorption spectroscopy for measurement of co-emitted trace gases |
| US12449354B2 (en) | 2020-02-05 | 2025-10-21 | Seekops Inc. | Multispecies measurement platform using absorption spectroscopy for measurement of co-emitted trace gases |
| EP4127740A4 (de) * | 2020-03-25 | 2024-04-24 | SeekOps Inc. | Logarithmischer demodulator für laserwellenlängenmodulationsspektroskopie |
| US12217412B2 (en) | 2020-07-17 | 2025-02-04 | Seekops Inc. | Systems and methods of automated detection of gas plumes using optical imaging |
| US12475798B2 (en) | 2020-07-17 | 2025-11-18 | Seekops Inc. | UAS work practice |
| US12480867B2 (en) | 2020-10-27 | 2025-11-25 | Seekops Inc. | Methods and apparatus for measuring methane emissions with an optical open-cavity methane sensor |
Also Published As
| Publication number | Publication date |
|---|---|
| JPH0750136B2 (ja) | 1995-05-31 |
| JPH04230871A (ja) | 1992-08-19 |
| US5075619A (en) | 1991-12-24 |
| EP0450809A3 (en) | 1992-12-23 |
Similar Documents
| Publication | Publication Date | Title |
|---|---|---|
| US5075619A (en) | Method and apparatus for measuring the frequency of a spectral line | |
| US4630228A (en) | Transmission line analyzer for automatically identifying the severities and locations of multiple mismatches | |
| US5633801A (en) | Pulse-based impedance measurement instrument | |
| EP0660124B1 (de) | Einrichtung und Verfahren zum Messen von Phasenrauschen | |
| KR100694010B1 (ko) | 입력신호의 파형 에지를 타임 스탬핑하는 방법 | |
| US3876946A (en) | Radio frequency digital fourier analyzer | |
| US7711510B2 (en) | Method of crossover region phase correction when summing signals in multiple frequency bands | |
| CN100353169C (zh) | 测试电子元件的方法及其仪器 | |
| EP0141255B1 (de) | Messmethode mit digitalem Spektrumanalysator | |
| Fields et al. | Digital channelized IFM receiver | |
| US4686457A (en) | Method for measuring a signal's frequency components | |
| US4320400A (en) | Method and apparatus that nearly instantaneously samples, processes and sorts received signals from very large numbers of radar and radio emitters for frequency and angle of arrival analysis | |
| US6046595A (en) | Group delay estimate system using least square fit to phase response ramp | |
| EP0615659A1 (de) | Methode zur Überwachung der Fernfeldcharakteristik einer phasengesteuerten Antenne für ein Mikrowellenlandesystem unter Verwendung einer Nahfeldkorrekturtechnik. | |
| JP3122144B2 (ja) | 計器の中間周波数応答特性を得る方法 | |
| US4984253A (en) | Apparatus and method for processing simultaneous radio frequency signals | |
| CN111337746A (zh) | 一种射频信号检测定位方法 | |
| GB2154385A (en) | Frequency measurement method and device | |
| US20020008506A1 (en) | Electric power measuring method, system using the same and computer-readable medium | |
| JP3381109B2 (ja) | 伝達関数測定装置 | |
| JP2867769B2 (ja) | 音響測定方法およびその装置 | |
| US4995006A (en) | Apparatus and method for low-pass equivalent processing | |
| EP0355293B1 (de) | Verfahren und Gerät, um zwischen Datenproben zu interpolieren | |
| GB2035578A (en) | Method and apparatus for determining the attenuation of a signal path | |
| RU2142141C1 (ru) | Способ определения передаточной функции измерительной системы |
Legal Events
| Date | Code | Title | Description |
|---|---|---|---|
| PUAI | Public reference made under article 153(3) epc to a published international application that has entered the european phase |
Free format text: ORIGINAL CODE: 0009012 |
|
| AK | Designated contracting states |
Kind code of ref document: A2 Designated state(s): DE FR GB |
|
| PUAL | Search report despatched |
Free format text: ORIGINAL CODE: 0009013 |
|
| AK | Designated contracting states |
Kind code of ref document: A3 Designated state(s): DE FR GB |
|
| 17P | Request for examination filed |
Effective date: 19930514 |
|
| 17Q | First examination report despatched |
Effective date: 19941229 |
|
| STAA | Information on the status of an ep patent application or granted ep patent |
Free format text: STATUS: THE APPLICATION IS DEEMED TO BE WITHDRAWN |
|
| 18D | Application deemed to be withdrawn |
Effective date: 19950509 |