EP0535700A2 - Method and apparatus for comparing spectra - Google Patents
Method and apparatus for comparing spectra Download PDFInfo
- Publication number
- EP0535700A2 EP0535700A2 EP92116913A EP92116913A EP0535700A2 EP 0535700 A2 EP0535700 A2 EP 0535700A2 EP 92116913 A EP92116913 A EP 92116913A EP 92116913 A EP92116913 A EP 92116913A EP 0535700 A2 EP0535700 A2 EP 0535700A2
- Authority
- EP
- European Patent Office
- Prior art keywords
- spectrum
- model
- analyte
- unknown
- derivative
- Prior art date
- Legal status (The legal status is an assumption and is not a legal conclusion. Google has not performed a legal analysis and makes no representation as to the accuracy of the status listed.)
- Granted
Links
Images


Classifications
-
- G—PHYSICS
- G01—MEASURING; TESTING
- G01J—MEASUREMENT OF INTENSITY, VELOCITY, SPECTRAL CONTENT, POLARISATION, PHASE OR PULSE CHARACTERISTICS OF INFRARED, VISIBLE OR ULTRAVIOLET LIGHT; COLORIMETRY; RADIATION PYROMETRY
- G01J3/00—Spectrometry; Spectrophotometry; Monochromators; Measuring colours
- G01J3/28—Investigating the spectrum
- G01J3/42—Absorption spectrometry; Double beam spectrometry; Flicker spectrometry; Reflection spectrometry
- G01J3/433—Modulation spectrometry; Derivative spectrometry
-
- G—PHYSICS
- G01—MEASURING; TESTING
- G01J—MEASUREMENT OF INTENSITY, VELOCITY, SPECTRAL CONTENT, POLARISATION, PHASE OR PULSE CHARACTERISTICS OF INFRARED, VISIBLE OR ULTRAVIOLET LIGHT; COLORIMETRY; RADIATION PYROMETRY
- G01J3/00—Spectrometry; Spectrophotometry; Monochromators; Measuring colours
- G01J3/28—Investigating the spectrum
-
- G—PHYSICS
- G01—MEASURING; TESTING
- G01N—INVESTIGATING OR ANALYSING MATERIALS BY DETERMINING THEIR CHEMICAL OR PHYSICAL PROPERTIES
- G01N2201/00—Features of devices classified in G01N21/00
- G01N2201/12—Circuits of general importance; Signal processing
- G01N2201/129—Using chemometrical methods
Definitions
- This invention relates to the comparing of spectra such as might be obtained from an atomic emission or infrared spectrometer. More specifically it relates to improved comparison when the unknown spectrum has undergone spectral shift.
- One prior art technique for solving this problem is to separately measure and record the spectral responses of components known or suspected to be in the unknown sample. Coefficients are then selected which are employed to multiply each of the preselected spectral patterns such that, when summed together, they will minimize the root mean square difference between such sum and the spectral data from the sample.
- Kalman filter Another prior art method is by use of the Kalman filter. This is an iterative process. A set of coefficients is estimated. These coefficients are employed to multiply each data point in the spectrum. The error between the results and each data point is computed. A derivative is then estimated that indicates the direction in which to shift the estimates of the coefficients. Accordingly, there is a successive refinement of the error which, after many iterations, converges.
- the present invention is based upon multiple linear least squares regression and is especially well-adapted for use with ICP atomic emission spectra. It serves to deconvolve overlapped responses from chemical species in mixtures. It provides improved determinations and lower detection limits. In cases of spectral overlap it also provides automatic background correction and automatic compensation for spectral shift of the unknown spectra. Shift compensation does not require the use of interpolation to correct the wavelength registration of the unknown spectrum. Instead shift compensation is built into the regression routine through the use of first and higher order derivatives of the unknown spectrum. Also, "masking" may be employed to ignore or overlook selected regions of the emission spectrum to thereby avoid interfering spectral lines rather than modeling them.
- Model spectra for individual components in the unknown mixture are collected and stored on magnetic disk for later computer retrieval. These empirical models, once collected, are reusable as long as their shapes accurately represent the spectra of the components to be fitted. The models are treated as vectors and become part of the model. The spectra of unknown mixtures are also collected and stored. The model is then applied to the unknown spectrum using multiple linear least squares regression. The value of each component of the model is adjusted to minimize the squared residual error.
- the flatness of the residuals plot of a least squares fit is an indicator of the validity of the model.
- a successful fit has a flat residuals plot with only the noise of the measurement superimposed. If a model is applied to an unknown spectrum containing a component not included in the model, the residuals plot will show structure instead of the expected flat line. This may be used as a flag which warns the experimenter to include the appropriate additional components in the model.
- the scalar RMS residual can also be used as a criterion of the quality of the fit.
- numerical derivatives of the unknown spectrum are included in the model to compensate for spectral shift of the unknown spectrum.
- the derivatives themselves act as models of the residual error incurred when spectral shift is present in the unknown spectrum.
- a Taylor series expansion (a derivative series) of the shifted unknown can be used to model the desired unshifted unknown spectrum.
- the use of higher order derivatives in the model can improve the estimate of each analyte due to the greater tolerance of such a model to spectral shift.
- the least squares estimate of ⁇ is the (px1) vector b which, when substituted for ⁇ in equation (1), minimizes the error.
- the 1st derivative alone is not sufficient to improve the estimate of the analyte contribution. This is because the 1st derivative of symmetrical gaussian-like peaks is orthogonal to the original profile and cannot contribute in the least-squares fit. However, in such a situation, the resulting coefficient of the first derivative may still be used to quantify the amount and direction of the shift. In unsymmetrical cases, such as in the occurrence of spectral overlap, the 1st derivative begins to contribute and improves the estimate of the analyte in the presence of shift. By including both the 1st and 2nd derivatives of the unknown spectrum in the model, shift compensation is achieved and the estimate of the analyte contribution is improved in both the symmetrical and unsymmetrical cases. Higher derivatives may provide even greater latitude.
- the technique of including the derivatives of the unknown spectrum in the model provides a determined compensation for the spectral drift as opposed to iterative interpolation which requires searching to find the minimum error. As mentioned above, this technique also allows the determination of the amount and direction of shift which may have occurred. This can also be used in a slightly different scheme which combines linear least-squares and interpolation.
- the spectral shift could be quantified by the derivative technique and corrected by a single iteration of interpolation of either the model components or the unknown spectra. This would avoid the many iterations required when interpolation alone is used.
- Certain regions of the emission spectrum may contain unwanted spectral information such as the emission profile of an interferent. These areas may be masked out of the regression routine and consequently ignored. Thus, the spectral peak of an interferent can be ignored rather than having to include a component for the interferent in the model. In this manner, the number of components in the model may be reduced without sacrificing accuracy in the determination of the analyte concentration.
- the 1st and 2nd derivatives of the unknown spectrum can be included in the model in order to compensate for a shift in the instrument wavelength scale.
- increasingly higher orders of derivatives can be included to improve the compensation still further.
- noise in the unknown spectrum will tend to dominate in these higher derivative spectra and at some point, dependent upon the instrument, inclusion of higher order derivatives will cease to be useful.
- the drawings comprise four examples of computer simulations of the type of spectra encountered in ICP emission spectroscopy.
- the spectral peaks are represented with gaussian profiles.
- Noise is included as white gaussian noise.
- Shot noise is approximated as white noise in which the standard deviation is proportional to the square root of the signal observed at the detector.
- Detector dark current shot noise is approximated as white noise which is always present and is independent of any other variables in the system.
- flicker noise is approximated as white noise with a standard deviation which is 1% of the total signal.
- the flicker noise has a 1/f dependence in the noise power spectrum. This means that there is correlation between adjacent points in a real, sequentially scanned, spectrum. This correlation comes from the low frequency components in the flicker noise. For simplicity, this behavior has not been simulated. Also, the flicker noise is typically different for the background signal compared to the analytical signal. This, also, has not been modeled.
- Figure 1 illustrates a three component fit: an analyte profile including a peak 10 present in the center of a spectrum 12; an interferent peak 14 to the left; and background. They are modeled and fit using the least-squares algorithm. The best-fit spectrum 16 closely follows the unknown spectrum. The flat residuals plot 18 shows that the fit is accurate because it contains no structure other than noise. The analyte signal is at a level of 10 times the conventional detection limit and, for this spectrum, a recovery of 97% was found.
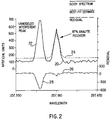
- Figure 2 illustrates the effect on the analyte recovery, the background estimate, and the residuals plot when the component for the interferent is left out of the model.
- the spectrum 20 is similar to that of Figure 1.
- the interferent peak 22 is not included in the best fit estimate model 24.
- the resulting residuals plot 26 shows structure 28 which warns the analyst of an incorrect model.
- Figure 3 shows how masking over a region 30 can be used to deal with this problem.
- the accuracy is as good with masking as when the interferent component is included in the model for this case.
- Masking makes it possible to avoid adding an unnecessary component.
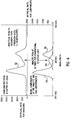
- Figure 4 illustrates a difficult case where the spectrum 32 is complicated by the presence of two interferent peaks, one on each side of the analyte peak 34. Also tested in this example, is the ability of the method of this invention to deal with a spectral shift of +4 picometers.
- the model components include the analyte 34 and two interferents 36, 38.
- the 1st and 2nd derivatives of the unknown spectrum were included in the model.
- a mean recovery of 98% was obtained with a precision of 3.5% RSD. It is observed that accurate and precise measurements can be made in the presence of overlapping spectral interferences and spectral shift which rival the values obtained in the non-interfered cases.
- Wavelength shift is not the only kind of abscissa distortion which may occur in an instrument.
- the abscissa may be slightly compressed or expanded, giving rise to a different effective abscissa interval in the data.
- This type of abscissa distortion can be expressed as a shift of the data which varies linearly across the spectrum. For example, a shift to the left at the left side varying to a zero shift at the center, all the way to a shift to the right at the right side of the spectrum, corresponds to an expansion of the abscissa scale. This kind of shift can be dealt with analogously to the simple shift described previously.
- the simple 1st derivative spectrum used above is replaced by the 1st derivative spectrum multiplied by a straight line envelope function which varies from -1 at the left to +1 at the right.
- This modified derivative in the model will allow a scale expansion/compression with zero mean shift to be compensated.
- the simple shift compensation and the expansion/compression compensation can be combined to compensate for a more general change of scale.
- any complex distortion of the abscissa scale may be modeled by including higher orders of envelope function.
- a constant envelope function corresponds to a simple shift.
- a linear envelope function corresponds to a scale compression or expansion.
- a parabolic envelope function corresponds to compression in one half of the spectrum and expansion in the other half, and so on.
- the entire family of compensating functions consists of all the orders of derivative spectrum multiplied each in combination with one of the orders of envelope function.
Landscapes
- Physics & Mathematics (AREA)
- Spectroscopy & Molecular Physics (AREA)
- General Physics & Mathematics (AREA)
- Investigating Or Analysing Materials By Optical Means (AREA)
- Investigating, Analyzing Materials By Fluorescence Or Luminescence (AREA)
Abstract
Description
- This invention relates to the comparing of spectra such as might be obtained from an atomic emission or infrared spectrometer. More specifically it relates to improved comparison when the unknown spectrum has undergone spectral shift.
- It is often desired to isolate and determine the concentration of a particular element or species contained in an unknown sample. This is conventionally done for molecular species by a spectrometer operating, for example, in the infrared region of the spectrum. More recently, it might be accomplished for elements by an atomic emission spectrometer such as an inductively coupled plasma (ICP) spectrometer. One of the major problems in handling spectral data of this type arises from overlapped responses from various chemical species in the unknown mixture. Such responses may, for example, completely hide the response from the element or species which it is desired to measure.
- One prior art technique for solving this problem is to separately measure and record the spectral responses of components known or suspected to be in the unknown sample. Coefficients are then selected which are employed to multiply each of the preselected spectral patterns such that, when summed together, they will minimize the root mean square difference between such sum and the spectral data from the sample.
- Another prior art method is by use of the Kalman filter. This is an iterative process. A set of coefficients is estimated. These coefficients are employed to multiply each data point in the spectrum. The error between the results and each data point is computed. A derivative is then estimated that indicates the direction in which to shift the estimates of the coefficients. Accordingly, there is a successive refinement of the error which, after many iterations, converges.
- One of the problems with both of the aforementioned methods is that they are computational and time intensive. This becomes a particular problem in the case of ICP atomic emission spectra wherein there might be, for example, data points at 64 discrete frequencies and several unknowns. This would result in the need to solve simultaneously 64 different equations having, for example, 3 unknowns.
- Another problem with the prior art techniques arises from spectral wavelength shifts in the unknown sample. Such shifts cause the peaks of components in the unknown sample to appear to be at different wavelengths than the previously recorded peaks of the pure components. Such apparent shifts may occur, for example, between instruments and even, with time, in the same instrument. In dealing with this problem, the prior art approach has been to use interpolation. The spectral information is collected at discrete points. If a wavelength shift is required, it is necessary to know what the data is between such points. However, since the amount of interpolation is not known, it is required to successively check the error and iterate. This also is a mathematically and time intensive procedure.
- The present invention is based upon multiple linear least squares regression and is especially well-adapted for use with ICP atomic emission spectra. It serves to deconvolve overlapped responses from chemical species in mixtures. It provides improved determinations and lower detection limits. In cases of spectral overlap it also provides automatic background correction and automatic compensation for spectral shift of the unknown spectra. Shift compensation does not require the use of interpolation to correct the wavelength registration of the unknown spectrum. Instead shift compensation is built into the regression routine through the use of first and higher order derivatives of the unknown spectrum. Also, "masking" may be employed to ignore or overlook selected regions of the emission spectrum to thereby avoid interfering spectral lines rather than modeling them.
-
- Fig. 1 illustrates a modeled interferent in a spectrum simulation;
- Fig. 2 illustrates an unmodeled interferent in a spectrum simulation;
- Fig. 3 illustrates an unmodeled but masked interferent in a spectrum simulation; and
- Fig. 4 illustrates the performance of the method of this invention in a simulation involving both a hidden analyte peak and a shifted spectrum.
- Model spectra for individual components in the unknown mixture are collected and stored on magnetic disk for later computer retrieval. These empirical models, once collected, are reusable as long as their shapes accurately represent the spectra of the components to be fitted. The models are treated as vectors and become part of the model. The spectra of unknown mixtures are also collected and stored. The model is then applied to the unknown spectrum using multiple linear least squares regression. The value of each component of the model is adjusted to minimize the squared residual error.
- As with the Kalman filter, the flatness of the residuals plot of a least squares fit is an indicator of the validity of the model. A successful fit has a flat residuals plot with only the noise of the measurement superimposed. If a model is applied to an unknown spectrum containing a component not included in the model, the residuals plot will show structure instead of the expected flat line. This may be used as a flag which warns the experimenter to include the appropriate additional components in the model. The scalar RMS residual can also be used as a criterion of the quality of the fit.
- In accordance with the present invention, numerical derivatives of the unknown spectrum are included in the model to compensate for spectral shift of the unknown spectrum. The derivatives themselves act as models of the residual error incurred when spectral shift is present in the unknown spectrum. In other terms, a Taylor series expansion (a derivative series) of the shifted unknown can be used to model the desired unshifted unknown spectrum. The use of higher order derivatives in the model can improve the estimate of each analyte due to the greater tolerance of such a model to spectral shift.
- The model under consideration may be written in matrix notation as:

where - Y
- is an (nx1) vector of observations (unknown spectrum);
- X
- is an (nxp) matrix of known form (model components);
- β
- is a (px1) vector of parameters (coefficients);
- E
- is an (nx1) vector of errors (residuals);
- The least squares estimate of β is the (px1) vector b which, when substituted for β in equation (1), minimizes the error. The solution is given as:

where the superscript T indicates the transpose operation and the superscript -1 indicates the inverse matrix operation. In this fashion, a first derivative component is added to the matrix X. - If the shift correction technique is applied in cases where the analyte peak is free from interference, the 1st derivative alone is not sufficient to improve the estimate of the analyte contribution. This is because the 1st derivative of symmetrical gaussian-like peaks is orthogonal to the original profile and cannot contribute in the least-squares fit. However, in such a situation, the resulting coefficient of the first derivative may still be used to quantify the amount and direction of the shift. In unsymmetrical cases, such as in the occurrence of spectral overlap, the 1st derivative begins to contribute and improves the estimate of the analyte in the presence of shift. By including both the 1st and 2nd derivatives of the unknown spectrum in the model, shift compensation is achieved and the estimate of the analyte contribution is improved in both the symmetrical and unsymmetrical cases. Higher derivatives may provide even greater latitude.
- The technique of including the derivatives of the unknown spectrum in the model provides a determined compensation for the spectral drift as opposed to iterative interpolation which requires searching to find the minimum error. As mentioned above, this technique also allows the determination of the amount and direction of shift which may have occurred. This can also be used in a slightly different scheme which combines linear least-squares and interpolation. The spectral shift could be quantified by the derivative technique and corrected by a single iteration of interpolation of either the model components or the unknown spectra. This would avoid the many iterations required when interpolation alone is used.
- Included in the method of this invention is the technique of masking. Certain regions of the emission spectrum may contain unwanted spectral information such as the emission profile of an interferent. These areas may be masked out of the regression routine and consequently ignored. Thus, the spectral peak of an interferent can be ignored rather than having to include a component for the interferent in the model. In this manner, the number of components in the model may be reduced without sacrificing accuracy in the determination of the analyte concentration.
- As noted above, the 1st and 2nd derivatives of the unknown spectrum can be included in the model in order to compensate for a shift in the instrument wavelength scale. In principle, increasingly higher orders of derivatives can be included to improve the compensation still further. In practice, however, noise in the unknown spectrum will tend to dominate in these higher derivative spectra and at some point, dependent upon the instrument, inclusion of higher order derivatives will cease to be useful.
- The drawings comprise four examples of computer simulations of the type of spectra encountered in ICP emission spectroscopy. The spectral peaks are represented with gaussian profiles. Noise is included as white gaussian noise. Three sources of noise, similar to those in ICP instrumentation, were simulated. Shot noise is approximated as white noise in which the standard deviation is proportional to the square root of the signal observed at the detector. Detector dark current shot noise is approximated as white noise which is always present and is independent of any other variables in the system. Finally, flicker noise is approximated as white noise with a standard deviation which is 1% of the total signal.
- In real ICP signals, the flicker noise has a 1/f dependence in the noise power spectrum. This means that there is correlation between adjacent points in a real, sequentially scanned, spectrum. This correlation comes from the low frequency components in the flicker noise. For simplicity, this behavior has not been simulated. Also, the flicker noise is typically different for the background signal compared to the analytical signal. This, also, has not been modeled.
- In all simulations, a background level of 100 arbitrary units and a detector shot noise level of 10 units standard deviation is employed.
- Figure 1 illustrates a three component fit: an analyte profile including a peak 10 present in the center of a
spectrum 12; aninterferent peak 14 to the left; and background. They are modeled and fit using the least-squares algorithm. The best-fit spectrum 16 closely follows the unknown spectrum. Theflat residuals plot 18 shows that the fit is accurate because it contains no structure other than noise. The analyte signal is at a level of 10 times the conventional detection limit and, for this spectrum, a recovery of 97% was found. - Figure 2 illustrates the effect on the analyte recovery, the background estimate, and the residuals plot when the component for the interferent is left out of the model. The
spectrum 20 is similar to that of Figure 1. However, theinterferent peak 22 is not included in the bestfit estimate model 24. The resulting residuals plot 26 showsstructure 28 which warns the analyst of an incorrect model. - Figure 3 shows how masking over a
region 30 can be used to deal with this problem. The accuracy is as good with masking as when the interferent component is included in the model for this case. Masking makes it possible to avoid adding an unnecessary component. - Figure 4 illustrates a difficult case where the
spectrum 32 is complicated by the presence of two interferent peaks, one on each side of theanalyte peak 34. Also tested in this example, is the ability of the method of this invention to deal with a spectral shift of +4 picometers. The model components include theanalyte 34 and twointerferents - Wavelength shift is not the only kind of abscissa distortion which may occur in an instrument. For example, the abscissa may be slightly compressed or expanded, giving rise to a different effective abscissa interval in the data. This type of abscissa distortion can be expressed as a shift of the data which varies linearly across the spectrum. For example, a shift to the left at the left side varying to a zero shift at the center, all the way to a shift to the right at the right side of the spectrum, corresponds to an expansion of the abscissa scale. This kind of shift can be dealt with analogously to the simple shift described previously. For example, the simple 1st derivative spectrum used above is replaced by the 1st derivative spectrum multiplied by a straight line envelope function which varies from -1 at the left to +1 at the right. The inclusion of this modified derivative in the model will allow a scale expansion/compression with zero mean shift to be compensated. Clearly, the simple shift compensation and the expansion/compression compensation can be combined to compensate for a more general change of scale.
- The foregoing does not represent the limit of the possibilities of this invention. The effects of any complex distortion of the abscissa scale may be modeled by including higher orders of envelope function. A constant envelope function corresponds to a simple shift. A linear envelope function corresponds to a scale compression or expansion. A parabolic envelope function corresponds to compression in one half of the spectrum and expansion in the other half, and so on. In fact, the entire family of compensating functions consists of all the orders of derivative spectrum multiplied each in combination with one of the orders of envelope function. Naturally, a knowledge of likely causes of spectrum distortion will aid in the restriction of this set to manageable proportions.
- The significance of this ability to compensate for complex abscissa distortions becomes evident, not so much in the context of drift within a single instrument, as in the transfer of calibration models between instruments. In some instances involving analysis of complex chemical mixtures with highly overlapped spectra, the generation of the calibration model is almost prohibitively expensive. In these circumstances, the need to transfer calibration models between instruments becomes acute. Unfortunately, even instruments from the same manufacturer typically have subtle differences of abscissa scaling which prevent models from being transferred directly. Examples of such calibration transfer problems are to be found in UV-visible absorption spectra, NIR absorption spectra, particularly of hydrocarbon mixtures, and IR spectra of polymers and liquids. This invention provides a technique for dealing with wavelength registration drift in spectrometers.
- It is believed that the many advantages of this invention will now be apparent to those skilled in the art. It will also be apparent that a number of variations and modifications may be made in this invention with departing from its spirit and scope. Accordingly, the foregoing description is to be construed as illustrative only. This invention is limited only by the scope of the following claims.
p=number of components or unknowns.
Claims (7)
- In the multiple linear least squares regression method of determining the concentration of at least one analyte from a spectrum of an unknown mixture containing said analyte by combining spectra of individual components of said mixture to derive a model and thereafter applying the model to the spectrum of the unknown mixture, the improvement which comprises:
generating a first derivative of said unknown mixture spectrum; and
including said first derivative in said derived model. - The improvement of claim 1 wherein a higher derivative of said unknown mixture spectrum is included in said model.
- The improvement of claim 1 wherein the concentrations of a plurality of analytes are determined.
- The improvement of claim 3 wherein a higher derivative of said unknown mixture spectrum is included in said model.
- A method for determining the concentration of an analyte in an unknown mixture containing said analyte which comprises:
generating a spectrum of the unknown mixture;
generating a spectrum of said analyte;
generating a first derivative of the spectrum of the unknown mixture;
deriving a model from the spectrum of said analyte and said first derivative; and
applying the derived model to the spectrum of the unknown mixture by multiple linear least squares regression. - In apparatus for performing a multiple linear least squares regression method to determine the concentration of an analyte from a spectrum of an unknown mixture containing said analyte by combining spectra of individual components of said mixture to derive a model and thereafter applying the model to the spectrum of the unknown mixture, the improvement which comprises:
means for generating a first derivative of said unknown mixture spectrum; and
means for incorporating said first derivative into said derived model. - Apparatus for determining the concentration of an analyte in an unknown mixture containing said analyte which comprises:
means for generating a spectrum of the unknown mixture;
means for generating a spectrum of said analyte;
means for generating a first derivative of the spectrum of the unknown mixture;
means for deriving a model from the spectrum of said analyte and said first derivative; and
means for applying the derived model to the spectrum of the unknown mixture by multiple linear least squares regression.
Applications Claiming Priority (2)
| Application Number | Priority Date | Filing Date | Title |
|---|---|---|---|
| US77170591A | 1991-10-04 | 1991-10-04 | |
| US771705 | 1991-10-04 |
Publications (3)
| Publication Number | Publication Date |
|---|---|
| EP0535700A2 true EP0535700A2 (en) | 1993-04-07 |
| EP0535700A3 EP0535700A3 (en) | 1993-04-21 |
| EP0535700B1 EP0535700B1 (en) | 1997-03-26 |
Family
ID=25092703
Family Applications (1)
| Application Number | Title | Priority Date | Filing Date |
|---|---|---|---|
| EP92116913A Expired - Lifetime EP0535700B1 (en) | 1991-10-04 | 1992-10-02 | Method and apparatus for comparing spectra |
Country Status (4)
| Country | Link |
|---|---|
| US (1) | US5308982A (en) |
| EP (1) | EP0535700B1 (en) |
| JP (1) | JPH05209826A (en) |
| DE (1) | DE69218536T2 (en) |
Cited By (10)
| Publication number | Priority date | Publication date | Assignee | Title |
|---|---|---|---|---|
| EP0807809A3 (en) * | 1996-05-13 | 1998-07-01 | Perstorp Analytical, Inc. | System for indentifying materials by NIR spectrometry |
| EP0802406A3 (en) * | 1996-04-16 | 1998-07-08 | Bogdan Kurtyka | System for matching absorbance spectra employing a library stabilization algorithm |
| FR2783322A1 (en) * | 1998-09-11 | 2000-03-17 | Naphtachimie Sa | Analyzing an effluent by absorption spectrophotometry using UV or visible light |
| FR2787883A1 (en) * | 1998-11-30 | 2000-06-30 | Naphtachimie Sa | Analyzing an effluent by absorption spectrophotometry using UV or visible light |
| WO2000013002A3 (en) * | 1998-08-27 | 2001-02-22 | Abbott Lab | Reagentless analysis of biological samples |
| CN102103080A (en) * | 2010-12-31 | 2011-06-22 | 聚光科技(杭州)股份有限公司 | Spectrum analyzing method |
| EP1877945A4 (en) * | 2005-04-25 | 2012-11-21 | Horiba Jobin Yvon Inc | Method for classification of carbon nanotues and other materials |
| WO2013181429A1 (en) | 2012-05-31 | 2013-12-05 | Richard Jackson | System and method for determining the presence of spectral components in the spectra of mixture |
| CN103538384A (en) * | 2012-11-06 | 2014-01-29 | 王荣强 | Method for mapping spectrum of printer |
| CN116818687A (en) * | 2023-06-21 | 2023-09-29 | 浙江大学杭州国际科创中心 | Soil organic carbon spectrum prediction method and device based on spectrum guide integrated learning |
Families Citing this family (86)
| Publication number | Priority date | Publication date | Assignee | Title |
|---|---|---|---|---|
| US5412581A (en) * | 1992-11-05 | 1995-05-02 | Marathon Oil Company | Method for measuring physical properties of hydrocarbons |
| SE9401718L (en) * | 1994-05-18 | 1995-11-19 | Eka Nobel Ab | Ways to determine the parameters in paper |
| CA2228844C (en) * | 1995-08-07 | 2006-03-14 | Boehringer Mannheim Corporation | Biological fluid analysis using distance outlier detection |
| US5606164A (en) * | 1996-01-16 | 1997-02-25 | Boehringer Mannheim Corporation | Method and apparatus for biological fluid analyte concentration measurement using generalized distance outlier detection |
| US5668374A (en) * | 1996-05-07 | 1997-09-16 | Core Laboratories N.V. | Method for stabilizing near-infrared models and determining their applicability |
| JPH11511855A (en) * | 1996-06-27 | 1999-10-12 | カイロン ダイアグノスティクス コーポレーション | Determination of component concentration considering measurement error |
| US6029115A (en) * | 1996-10-03 | 2000-02-22 | Perkin Elmer Llc | Analyzing spectrometric data |
| US6115673A (en) * | 1997-08-14 | 2000-09-05 | Instrumentation Metrics, Inc. | Method and apparatus for generating basis sets for use in spectroscopic analysis |
| US7383069B2 (en) * | 1997-08-14 | 2008-06-03 | Sensys Medical, Inc. | Method of sample control and calibration adjustment for use with a noninvasive analyzer |
| US6137104A (en) * | 1998-06-12 | 2000-10-24 | Varian, Inc. | Fast automated spectral fitting method |
| DE19915137C2 (en) * | 1999-03-26 | 2001-10-18 | Michael Schaefer | Fluorescence microscopy method for quantifying multiple fluorochromes in a multi-colored sample and uses of the method |
| WO2000077495A1 (en) * | 1999-06-16 | 2000-12-21 | Hutchinson Technology Incorporated | Total hemoglobin concentration measurement |
| US6615142B1 (en) * | 1999-08-17 | 2003-09-02 | Southwest Sciences Incorporated | Filtering to measure gas concentrations from spectral features |
| US6651015B2 (en) * | 1999-11-23 | 2003-11-18 | James Samsoondar | Method for calibrating spectrophotometric apparatus |
| US6418383B1 (en) * | 2000-02-11 | 2002-07-09 | Perkinelmer Instruments Llc | Method and apparatus for iterative spectral compensation |
| AU2001291189A1 (en) * | 2000-09-22 | 2002-04-02 | Knobbe, Lim And Buckingham | Method and apparatus for real-time estimation and control of pysiological parameters |
| CA2331116A1 (en) * | 2001-01-15 | 2002-07-15 | Chenomx, Inc. | Compound identification and quantitation in liquid mixtures -- method and process using an automated nuclear magnetic resonance measurement system |
| US7020507B2 (en) * | 2002-01-31 | 2006-03-28 | Dolphin Medical, Inc. | Separating motion from cardiac signals using second order derivative of the photo-plethysmogram and fast fourier transforms |
| RU2284506C2 (en) * | 2002-09-05 | 2006-09-27 | Юрий Андреевич Поплавский | Automated method of spectrophotometric analysis |
| WO2005029031A2 (en) * | 2003-08-01 | 2005-03-31 | Biacore Ab | Method and apparatus for quantitating surface-binding optical resonance profiles |
| JP2008518205A (en) * | 2004-10-21 | 2008-05-29 | オプテイスカン・バイオメデイカル・コーポレーシヨン | Method and apparatus for determining analyte concentration in an interfering sample |
| US20070103678A1 (en) * | 2005-02-14 | 2007-05-10 | Sterling Bernhard B | Analyte detection system with interferent identification and correction |
| US20060189926A1 (en) * | 2005-02-14 | 2006-08-24 | Hall W D | Apparatus and methods for analyzing body fluid samples |
| US7127372B2 (en) * | 2005-02-24 | 2006-10-24 | Itt Manufacturing Enterprises, Inc. | Retro-regression residual remediation for spectral/signal identification |
| US20080112853A1 (en) * | 2006-08-15 | 2008-05-15 | Hall W Dale | Method and apparatus for analyte measurements in the presence of interferents |
| DE102005060245B3 (en) * | 2005-12-14 | 2007-03-01 | Deutsches Zentrum für Luft- und Raumfahrt e.V. | Gas concentration, pressure and temperature distributions determining method for use in e.g. motor vehicle, involves providing cubic polynomial as interpolating function, where interpolating function and mixed derivations are same |
| DE102006000805B4 (en) * | 2006-01-03 | 2016-09-01 | Spectro Analytical Instruments Gmbh & Co. Kg | Method for correcting spectral perturbations in ICP emission spectroscopy (OES) |
| US8417311B2 (en) | 2008-09-12 | 2013-04-09 | Optiscan Biomedical Corporation | Fluid component analysis system and method for glucose monitoring and control |
| CA2702116C (en) | 2007-10-10 | 2021-01-05 | Optiscan Biomedical Corporation | Fluid component analysis system and method for glucose monitoring and control |
| US8090558B1 (en) * | 2008-06-09 | 2012-01-03 | Kla-Tencor Corporation | Optical parametric model optimization |
| US7959598B2 (en) | 2008-08-20 | 2011-06-14 | Asante Solutions, Inc. | Infusion pump systems and methods |
| US10475529B2 (en) | 2011-07-19 | 2019-11-12 | Optiscan Biomedical Corporation | Method and apparatus for analyte measurements using calibration sets |
| US9561324B2 (en) | 2013-07-19 | 2017-02-07 | Bigfoot Biomedical, Inc. | Infusion pump system and method |
| US10955359B2 (en) * | 2013-11-12 | 2021-03-23 | International Business Machines Corporation | Method for quantification of process non uniformity using model-based metrology |
| GB2523989B (en) | 2014-01-30 | 2020-07-29 | Insulet Netherlands B V | Therapeutic product delivery system and method of pairing |
| CN111905188B (en) | 2015-02-18 | 2022-07-22 | 英赛罗公司 | Fluid delivery and infusion device and method of use |
| WO2017123525A1 (en) | 2016-01-13 | 2017-07-20 | Bigfoot Biomedical, Inc. | User interface for diabetes management system |
| HK1256995A1 (en) | 2016-01-14 | 2019-10-11 | Bigfoot Biomedical, Inc. | Occlusion resolution in medication delivery devices, systems, and methods |
| US10806859B2 (en) | 2016-01-14 | 2020-10-20 | Bigfoot Biomedical, Inc. | Adjusting insulin delivery rates |
| US12383166B2 (en) | 2016-05-23 | 2025-08-12 | Insulet Corporation | Insulin delivery system and methods with risk-based set points |
| BR102016019770B1 (en) * | 2016-08-26 | 2021-11-16 | Optionline LLC | METHODOLOGY FOR IDENTIFICATION OF MATERIALS THROUGH METHODS OF COMPARISON BETWEEN SPECTRUM OF A SAMPLE AGAINST MATERIAL SPECTRUM REFERENCE LIBRARY |
| US10765807B2 (en) | 2016-09-23 | 2020-09-08 | Insulet Corporation | Fluid delivery device with sensor |
| US11096624B2 (en) | 2016-12-12 | 2021-08-24 | Bigfoot Biomedical, Inc. | Alarms and alerts for medication delivery devices and systems |
| US10583250B2 (en) | 2017-01-13 | 2020-03-10 | Bigfoot Biomedical, Inc. | System and method for adjusting insulin delivery |
| EP3568860B1 (en) | 2017-01-13 | 2025-12-10 | Insulet Corporation | Insulin delivery methods, systems and devices |
| US11033682B2 (en) | 2017-01-13 | 2021-06-15 | Bigfoot Biomedical, Inc. | Insulin delivery methods, systems and devices |
| US10881792B2 (en) | 2017-01-13 | 2021-01-05 | Bigfoot Biomedical, Inc. | System and method for adjusting insulin delivery |
| US10500334B2 (en) | 2017-01-13 | 2019-12-10 | Bigfoot Biomedical, Inc. | System and method for adjusting insulin delivery |
| US10758675B2 (en) | 2017-01-13 | 2020-09-01 | Bigfoot Biomedical, Inc. | System and method for adjusting insulin delivery |
| JP6791396B2 (en) | 2017-09-29 | 2020-11-25 | 日本電気株式会社 | Measuring equipment, measuring methods, and programs |
| USD928199S1 (en) | 2018-04-02 | 2021-08-17 | Bigfoot Biomedical, Inc. | Medication delivery device with icons |
| US11565043B2 (en) | 2018-05-04 | 2023-01-31 | Insulet Corporation | Safety constraints for a control algorithm based drug delivery system |
| US12562251B1 (en) | 2018-05-09 | 2026-02-24 | Bigfoot Biomedical, Inc. | Computing architecture for assuring the provenance of medication therapy related parameters, and related systems, methods and devices |
| AU2019347755B2 (en) | 2018-09-28 | 2023-02-02 | Insulet Corporation | Activity mode for artificial pancreas system |
| EP3864668A1 (en) | 2018-10-11 | 2021-08-18 | Insulet Corporation | Event detection for drug delivery system |
| USD920343S1 (en) | 2019-01-09 | 2021-05-25 | Bigfoot Biomedical, Inc. | Display screen or portion thereof with graphical user interface associated with insulin delivery |
| US11801344B2 (en) | 2019-09-13 | 2023-10-31 | Insulet Corporation | Blood glucose rate of change modulation of meal and correction insulin bolus quantity |
| US11935637B2 (en) | 2019-09-27 | 2024-03-19 | Insulet Corporation | Onboarding and total daily insulin adaptivity |
| EP4069082B1 (en) | 2019-12-06 | 2024-06-05 | Insulet Corporation | Techniques and devices providing adaptivity and personalization in diabetes treatment |
| US11833329B2 (en) | 2019-12-20 | 2023-12-05 | Insulet Corporation | Techniques for improved automatic drug delivery performance using delivery tendencies from past delivery history and use patterns |
| JP7512395B2 (en) | 2020-01-06 | 2024-07-08 | インスレット コーポレイション | Predicting dietary and/or exercise behavior based on persistence residuals |
| EP4100958A1 (en) | 2020-02-03 | 2022-12-14 | Insulet Corporation | Use of fuzzy logic in predicting user behavior affecting blood glucose concentration |
| US11551802B2 (en) | 2020-02-11 | 2023-01-10 | Insulet Corporation | Early meal detection and calorie intake detection |
| US11547800B2 (en) | 2020-02-12 | 2023-01-10 | Insulet Corporation | User parameter dependent cost function for personalized reduction of hypoglycemia and/or hyperglycemia in a closed loop artificial pancreas system |
| US11986630B2 (en) | 2020-02-12 | 2024-05-21 | Insulet Corporation | Dual hormone delivery system for reducing impending hypoglycemia and/or hyperglycemia risk |
| US11324889B2 (en) | 2020-02-14 | 2022-05-10 | Insulet Corporation | Compensation for missing readings from a glucose monitor in an automated insulin delivery system |
| US12495994B2 (en) | 2020-02-20 | 2025-12-16 | Insulet Corporation | Meal bolus subcategories in model based insulin therapy |
| US11607493B2 (en) | 2020-04-06 | 2023-03-21 | Insulet Corporation | Initial total daily insulin setting for user onboarding |
| US12121700B2 (en) | 2020-07-22 | 2024-10-22 | Insulet Corporation | Open-loop insulin delivery basal parameters based on insulin delivery records |
| US11684716B2 (en) | 2020-07-31 | 2023-06-27 | Insulet Corporation | Techniques to reduce risk of occlusions in drug delivery systems |
| US12569619B2 (en) | 2020-09-21 | 2026-03-10 | Insulet Corporation | Techniques for determining automated insulin delivery dosages |
| US12115351B2 (en) | 2020-09-30 | 2024-10-15 | Insulet Corporation | Secure wireless communications between a glucose monitor and other devices |
| EP4696344A3 (en) | 2020-09-30 | 2026-04-15 | Insulet Corporation | Drug delivery device with integrated optical-based glucose monitor |
| CN112557576A (en) * | 2020-12-04 | 2021-03-26 | 陕西省石油化工研究设计院 | Method for measuring content of calcium and magnesium ions in industrial circulating water |
| US11160925B1 (en) | 2021-01-29 | 2021-11-02 | Insulet Corporation | Automatic drug delivery system for delivery of a GLP-1 therapeutic |
| EP4305636A1 (en) | 2021-03-10 | 2024-01-17 | Insulet Corporation | A medicament delivery device with an adjustable and piecewise analyte level cost component to address persistent positive analyte level excursions |
| US11904140B2 (en) | 2021-03-10 | 2024-02-20 | Insulet Corporation | Adaptable asymmetric medicament cost component in a control system for medicament delivery |
| US12592306B2 (en) | 2021-04-28 | 2026-03-31 | Insulet Corporation | Devices and methods for initialization of drug delivery devices using measured analyte sensor information |
| US12496398B2 (en) | 2021-05-28 | 2025-12-16 | Insulet Corporation | Threshold based automatic glucose control response |
| EP4101482A1 (en) | 2021-06-07 | 2022-12-14 | Insulet Corporation | Exercise safety prediction based on physiological conditions |
| US12514980B2 (en) | 2021-06-30 | 2026-01-06 | Insulet Corporation | Adjustment of medicament delivery by a medicament delivery device based on menstrual cycle phase |
| US12521486B2 (en) | 2021-07-16 | 2026-01-13 | Insulet Corporation | Method for modification of insulin delivery during pregnancy in automatic insulin delivery systems |
| WO2023049900A1 (en) | 2021-09-27 | 2023-03-30 | Insulet Corporation | Techniques enabling adaptation of parameters in aid systems by user input |
| US11439754B1 (en) | 2021-12-01 | 2022-09-13 | Insulet Corporation | Optimizing embedded formulations for drug delivery |
| EP4243030A1 (en) | 2022-03-09 | 2023-09-13 | Insulet Corporation | Adjusting medicament delivery parameters in an open loop medicament delivery mode |
| EP4646726A1 (en) | 2023-01-06 | 2025-11-12 | Insulet Corporation | Automatically or manually initiated meal bolus delivery with subsequent automatic safety constraint relaxation |
Family Cites Families (3)
| Publication number | Priority date | Publication date | Assignee | Title |
|---|---|---|---|---|
| GB2020009B (en) * | 1978-04-08 | 1982-12-01 | Bodenseewerk Perkin Elmer Co | Apparatus for determining the concentration of components of a sample |
| US5023804A (en) * | 1989-05-23 | 1991-06-11 | The Perkin-Elmer Corporation | Method and apparatus for comparing spectra |
| US4997280A (en) * | 1989-09-27 | 1991-03-05 | Nirsystems Incorporated | Spectrophotometric instrument with rapid scanning distortion correction |
-
1992
- 1992-10-02 EP EP92116913A patent/EP0535700B1/en not_active Expired - Lifetime
- 1992-10-02 JP JP4287034A patent/JPH05209826A/en active Pending
- 1992-10-02 DE DE69218536T patent/DE69218536T2/en not_active Expired - Lifetime
- 1992-10-05 US US07/956,519 patent/US5308982A/en not_active Expired - Lifetime
Cited By (17)
| Publication number | Priority date | Publication date | Assignee | Title |
|---|---|---|---|---|
| EP0802406A3 (en) * | 1996-04-16 | 1998-07-08 | Bogdan Kurtyka | System for matching absorbance spectra employing a library stabilization algorithm |
| EP0807809A3 (en) * | 1996-05-13 | 1998-07-01 | Perstorp Analytical, Inc. | System for indentifying materials by NIR spectrometry |
| EP2040058A3 (en) * | 1996-05-13 | 2009-04-15 | Foss NIRSystems, Inc. | System for identifying materials by NIR spectrometry |
| WO2000013002A3 (en) * | 1998-08-27 | 2001-02-22 | Abbott Lab | Reagentless analysis of biological samples |
| US6365109B1 (en) | 1998-08-27 | 2002-04-02 | Abbott Laboratories | Reagentless analysis of biological samples |
| US6426045B1 (en) | 1998-08-27 | 2002-07-30 | Abbott Laboratories | Reagentless analysis of biological samples |
| US6773922B2 (en) | 1998-08-27 | 2004-08-10 | Abbott Laboratories | Reagentless analysis of biological samples |
| FR2783322A1 (en) * | 1998-09-11 | 2000-03-17 | Naphtachimie Sa | Analyzing an effluent by absorption spectrophotometry using UV or visible light |
| FR2787883A1 (en) * | 1998-11-30 | 2000-06-30 | Naphtachimie Sa | Analyzing an effluent by absorption spectrophotometry using UV or visible light |
| EP1877945A4 (en) * | 2005-04-25 | 2012-11-21 | Horiba Jobin Yvon Inc | Method for classification of carbon nanotues and other materials |
| CN102103080A (en) * | 2010-12-31 | 2011-06-22 | 聚光科技(杭州)股份有限公司 | Spectrum analyzing method |
| WO2013181429A1 (en) | 2012-05-31 | 2013-12-05 | Richard Jackson | System and method for determining the presence of spectral components in the spectra of mixture |
| EP2859313A4 (en) * | 2012-05-31 | 2016-03-02 | Richard Jackson | SYSTEM AND METHOD FOR DETECTION OF THE PRESENCE OF SPECTRAL COMPONENTS IN MIXTURE SPECTRA |
| CN103538384A (en) * | 2012-11-06 | 2014-01-29 | 王荣强 | Method for mapping spectrum of printer |
| CN103538384B (en) * | 2012-11-06 | 2015-07-22 | 慈溪市飞杰电器厂 | Method for mapping spectrum of printer |
| CN116818687A (en) * | 2023-06-21 | 2023-09-29 | 浙江大学杭州国际科创中心 | Soil organic carbon spectrum prediction method and device based on spectrum guide integrated learning |
| CN116818687B (en) * | 2023-06-21 | 2024-02-20 | 浙江大学杭州国际科创中心 | Soil organic carbon spectrum prediction method and device based on spectrum-guided ensemble learning |
Also Published As
| Publication number | Publication date |
|---|---|
| US5308982A (en) | 1994-05-03 |
| DE69218536T2 (en) | 1997-07-03 |
| EP0535700A3 (en) | 1993-04-21 |
| DE69218536D1 (en) | 1997-04-30 |
| JPH05209826A (en) | 1993-08-20 |
| EP0535700B1 (en) | 1997-03-26 |
Similar Documents
| Publication | Publication Date | Title |
|---|---|---|
| EP0535700A2 (en) | Method and apparatus for comparing spectra | |
| US5459677A (en) | Calibration transfer for analytical instruments | |
| Lorber et al. | The effect of interferences and calbiration design on accuracy: Implications for sensor and sample selection | |
| Léget et al. | SUGAR: An improved empirical model of Type Ia supernovae based on spectral features | |
| US6687620B1 (en) | Augmented classical least squares multivariate spectral analysis | |
| Rodgers et al. | Intercomparison of remote sounding instruments | |
| US7248370B2 (en) | Method to reduce background noise in a spectrum | |
| US5559728A (en) | Calibration transfer for second order analytical instruments | |
| US6518573B1 (en) | Suppression of undesired components in the measured spectra of spectrometers | |
| CN101010567B (en) | Method for generating independent multivariate calibration models | |
| US10557792B2 (en) | Spectral modeling for complex absorption spectrum interpretation | |
| Allegrini et al. | Generalized error-dependent prediction uncertainty in multivariate calibration | |
| CN102435556A (en) | Accurate spectrum quantitative analysis method used for complex heterogeneous mixture system | |
| Ivaldi et al. | Multivariate methods for interpretation of emission spectra from the inductively coupled plasma | |
| CN112487604A (en) | Long-time nonlinear drift compensation method for output data of marine gravimeter | |
| CN114324294A (en) | Multi-probe Raman Spectroscopy System and Mixed Gas Quantitative Analysis Method | |
| US5351198A (en) | Quantitative analytical method and apparatus for determining a plurality of ingredients with spectrometric analysis | |
| Platt et al. | Evaluation of DOAS Spectra, Sensitivity, and Detection Limits | |
| Jetsu et al. | Three stage period analysis and complementary methods | |
| Xie et al. | Calibration transfer as a data reconstruction problem | |
| US5396440A (en) | Optimum calibration frequency determination | |
| US11550010B2 (en) | Apparatus and method for processing spectrum | |
| GB2240173A (en) | Obtaining a differential measured quantity in terms of its correct physical unit | |
| Gaynullin et al. | Implementation of NDIR technology for selective sensing of gases with common absorption spectra | |
| US20040153300A1 (en) | Signature simulator |
Legal Events
| Date | Code | Title | Description |
|---|---|---|---|
| PUAI | Public reference made under article 153(3) epc to a published international application that has entered the european phase |
Free format text: ORIGINAL CODE: 0009012 |
|
| PUAL | Search report despatched |
Free format text: ORIGINAL CODE: 0009013 |
|
| AK | Designated contracting states |
Kind code of ref document: A2 Designated state(s): CH DE FR GB LI NL |
|
| AK | Designated contracting states |
Kind code of ref document: A3 Designated state(s): CH DE FR GB LI NL |
|
| 17P | Request for examination filed |
Effective date: 19931020 |
|
| 17Q | First examination report despatched |
Effective date: 19941215 |
|
| GRAG | Despatch of communication of intention to grant |
Free format text: ORIGINAL CODE: EPIDOS AGRA |
|
| GRAH | Despatch of communication of intention to grant a patent |
Free format text: ORIGINAL CODE: EPIDOS IGRA |
|
| GRAH | Despatch of communication of intention to grant a patent |
Free format text: ORIGINAL CODE: EPIDOS IGRA |
|
| GRAA | (expected) grant |
Free format text: ORIGINAL CODE: 0009210 |
|
| AK | Designated contracting states |
Kind code of ref document: B1 Designated state(s): CH DE FR GB LI NL |
|
| REG | Reference to a national code |
Ref country code: CH Ref legal event code: EP Ref country code: CH Ref legal event code: NV Representative=s name: PATENTANWALTSBUERO JEAN HUNZIKER |
|
| REF | Corresponds to: |
Ref document number: 69218536 Country of ref document: DE Date of ref document: 19970430 |
|
| ET | Fr: translation filed | ||
| NLR4 | Nl: receipt of corrected translation in the netherlands language at the initiative of the proprietor of the patent | ||
| PLBE | No opposition filed within time limit |
Free format text: ORIGINAL CODE: 0009261 |
|
| 26N | No opposition filed | ||
| PGFP | Annual fee paid to national office [announced via postgrant information from national office to epo] |
Ref country code: FR Payment date: 20000919 Year of fee payment: 9 |
|
| PGFP | Annual fee paid to national office [announced via postgrant information from national office to epo] |
Ref country code: NL Payment date: 20000925 Year of fee payment: 9 |
|
| PGFP | Annual fee paid to national office [announced via postgrant information from national office to epo] |
Ref country code: CH Payment date: 20000928 Year of fee payment: 9 |
|
| PG25 | Lapsed in a contracting state [announced via postgrant information from national office to epo] |
Ref country code: CH Free format text: LAPSE BECAUSE OF NON-PAYMENT OF DUE FEES Effective date: 20011031 Ref country code: LI Free format text: LAPSE BECAUSE OF NON-PAYMENT OF DUE FEES Effective date: 20011031 |
|
| REG | Reference to a national code |
Ref country code: GB Ref legal event code: IF02 |
|
| PG25 | Lapsed in a contracting state [announced via postgrant information from national office to epo] |
Ref country code: NL Free format text: LAPSE BECAUSE OF NON-PAYMENT OF DUE FEES Effective date: 20020501 |
|
| REG | Reference to a national code |
Ref country code: CH Ref legal event code: PL |
|
| PG25 | Lapsed in a contracting state [announced via postgrant information from national office to epo] |
Ref country code: FR Free format text: LAPSE BECAUSE OF NON-PAYMENT OF DUE FEES Effective date: 20020628 |
|
| NLV4 | Nl: lapsed or anulled due to non-payment of the annual fee |
Effective date: 20020501 |
|
| REG | Reference to a national code |
Ref country code: FR Ref legal event code: ST |
|
| PGFP | Annual fee paid to national office [announced via postgrant information from national office to epo] |
Ref country code: DE Payment date: 20101027 Year of fee payment: 19 |
|
| PGFP | Annual fee paid to national office [announced via postgrant information from national office to epo] |
Ref country code: GB Payment date: 20101025 Year of fee payment: 19 |
|
| REG | Reference to a national code |
Ref country code: DE Ref legal event code: R071 Ref document number: 69218536 Country of ref document: DE |
|
| REG | Reference to a national code |
Ref country code: DE Ref legal event code: R071 Ref document number: 69218536 Country of ref document: DE |
|
| REG | Reference to a national code |
Ref country code: GB Ref legal event code: PE20 Expiry date: 20121001 |
|
| PG25 | Lapsed in a contracting state [announced via postgrant information from national office to epo] |
Ref country code: GB Free format text: LAPSE BECAUSE OF EXPIRATION OF PROTECTION Effective date: 20121001 |