EP0560006A2 - Système de retenue à airbag et méthode de contrôle d'un tel système - Google Patents
Système de retenue à airbag et méthode de contrôle d'un tel système Download PDFInfo
- Publication number
- EP0560006A2 EP0560006A2 EP93100106A EP93100106A EP0560006A2 EP 0560006 A2 EP0560006 A2 EP 0560006A2 EP 93100106 A EP93100106 A EP 93100106A EP 93100106 A EP93100106 A EP 93100106A EP 0560006 A2 EP0560006 A2 EP 0560006A2
- Authority
- EP
- European Patent Office
- Prior art keywords
- calibration
- data
- peak
- profile
- spectral
- Prior art date
- Legal status (The legal status is an assumption and is not a legal conclusion. Google has not performed a legal analysis and makes no representation as to the accuracy of the status listed.)
- Granted
Links
- 230000003595 spectral effect Effects 0.000 claims abstract description 155
- BJQHLKABXJIVAM-UHFFFAOYSA-N bis(2-ethylhexyl) phthalate Chemical compound CCCCC(CC)COC(=O)C1=CC=CC=C1C(=O)OCC(CC)CCCC BJQHLKABXJIVAM-UHFFFAOYSA-N 0.000 claims abstract description 51
- 230000009466 transformation Effects 0.000 claims abstract description 43
- 239000011159 matrix material Substances 0.000 claims abstract description 40
- 238000012937 correction Methods 0.000 claims abstract description 36
- 230000003287 optical effect Effects 0.000 claims abstract description 25
- 230000000694 effects Effects 0.000 claims abstract description 15
- PCHJSUWPFVWCPO-UHFFFAOYSA-N gold Chemical compound [Au] PCHJSUWPFVWCPO-UHFFFAOYSA-N 0.000 claims abstract description 11
- 239000010931 gold Substances 0.000 claims abstract description 11
- 229910052737 gold Inorganic materials 0.000 claims abstract description 11
- 230000001131 transforming effect Effects 0.000 claims abstract description 7
- 238000000034 method Methods 0.000 claims description 74
- 238000001228 spectrum Methods 0.000 claims description 57
- 238000005314 correlation function Methods 0.000 claims description 28
- 230000005855 radiation Effects 0.000 claims description 20
- 230000005540 biological transmission Effects 0.000 claims description 8
- 239000011248 coating agent Substances 0.000 claims description 8
- 238000000576 coating method Methods 0.000 claims description 8
- 229910052779 Neodymium Inorganic materials 0.000 claims description 7
- JNDMLEXHDPKVFC-UHFFFAOYSA-N aluminum;oxygen(2-);yttrium(3+) Chemical compound [O-2].[O-2].[O-2].[Al+3].[Y+3] JNDMLEXHDPKVFC-UHFFFAOYSA-N 0.000 claims description 7
- QEFYFXOXNSNQGX-UHFFFAOYSA-N neodymium atom Chemical group [Nd] QEFYFXOXNSNQGX-UHFFFAOYSA-N 0.000 claims description 7
- 229910019901 yttrium aluminum garnet Inorganic materials 0.000 claims description 7
- VYPSYNLAJGMNEJ-UHFFFAOYSA-N Silicium dioxide Chemical compound O=[Si]=O VYPSYNLAJGMNEJ-UHFFFAOYSA-N 0.000 claims description 6
- 239000005350 fused silica glass Substances 0.000 claims description 6
- 229920006254 polymer film Polymers 0.000 claims description 4
- 239000000020 Nitrocellulose Substances 0.000 claims description 3
- 239000011521 glass Substances 0.000 claims description 3
- 229920001220 nitrocellulos Polymers 0.000 claims description 3
- 229920000642 polymer Polymers 0.000 abstract 1
- 239000000523 sample Substances 0.000 description 28
- 238000013507 mapping Methods 0.000 description 15
- 230000006870 function Effects 0.000 description 12
- 239000013598 vector Substances 0.000 description 10
- 239000000835 fiber Substances 0.000 description 8
- 238000005259 measurement Methods 0.000 description 8
- 238000002835 absorbance Methods 0.000 description 5
- 239000007788 liquid Substances 0.000 description 5
- TVMXDCGIABBOFY-UHFFFAOYSA-N octane Chemical compound CCCCCCCC TVMXDCGIABBOFY-UHFFFAOYSA-N 0.000 description 5
- 229910019655 synthetic inorganic crystalline material Inorganic materials 0.000 description 5
- 239000006185 dispersion Substances 0.000 description 4
- 238000010521 absorption reaction Methods 0.000 description 3
- 238000004364 calculation method Methods 0.000 description 3
- 239000013078 crystal Substances 0.000 description 3
- 238000010606 normalization Methods 0.000 description 3
- 239000002279 physical standard Substances 0.000 description 3
- 238000011282 treatment Methods 0.000 description 3
- 238000000862 absorption spectrum Methods 0.000 description 2
- 238000004458 analytical method Methods 0.000 description 2
- 238000004422 calculation algorithm Methods 0.000 description 2
- 238000006243 chemical reaction Methods 0.000 description 2
- 238000004590 computer program Methods 0.000 description 2
- 238000010276 construction Methods 0.000 description 2
- 230000001419 dependent effect Effects 0.000 description 2
- 238000013461 design Methods 0.000 description 2
- 238000013213 extrapolation Methods 0.000 description 2
- 238000002347 injection Methods 0.000 description 2
- 239000007924 injection Substances 0.000 description 2
- 239000013307 optical fiber Substances 0.000 description 2
- 238000012628 principal component regression Methods 0.000 description 2
- 238000012545 processing Methods 0.000 description 2
- 239000007787 solid Substances 0.000 description 2
- 238000004611 spectroscopical analysis Methods 0.000 description 2
- 239000004593 Epoxy Substances 0.000 description 1
- 238000004164 analytical calibration Methods 0.000 description 1
- 230000003190 augmentative effect Effects 0.000 description 1
- 239000004568 cement Substances 0.000 description 1
- 230000008859 change Effects 0.000 description 1
- 239000002131 composite material Substances 0.000 description 1
- 238000000205 computational method Methods 0.000 description 1
- 238000005538 encapsulation Methods 0.000 description 1
- 238000001914 filtration Methods 0.000 description 1
- 238000002955 isolation Methods 0.000 description 1
- 238000012417 linear regression Methods 0.000 description 1
- 239000003550 marker Substances 0.000 description 1
- 239000000463 material Substances 0.000 description 1
- 238000013178 mathematical model Methods 0.000 description 1
- 239000000203 mixture Substances 0.000 description 1
- 238000012986 modification Methods 0.000 description 1
- 230000004048 modification Effects 0.000 description 1
- 238000012544 monitoring process Methods 0.000 description 1
- 238000005457 optimization Methods 0.000 description 1
- 230000003071 parasitic effect Effects 0.000 description 1
- 108091008695 photoreceptors Proteins 0.000 description 1
- 238000002203 pretreatment Methods 0.000 description 1
- 230000008569 process Effects 0.000 description 1
- 238000002310 reflectometry Methods 0.000 description 1
- 238000009877 rendering Methods 0.000 description 1
- 230000008439 repair process Effects 0.000 description 1
- 238000012552 review Methods 0.000 description 1
- 230000035945 sensitivity Effects 0.000 description 1
- 238000002798 spectrophotometry method Methods 0.000 description 1
- 239000000126 substance Substances 0.000 description 1
- 238000006467 substitution reaction Methods 0.000 description 1
- 230000002194 synthesizing effect Effects 0.000 description 1
- 238000002834 transmittance Methods 0.000 description 1
- 229910052727 yttrium Inorganic materials 0.000 description 1
Images





Classifications
-
- G—PHYSICS
- G01—MEASURING; TESTING
- G01J—MEASUREMENT OF INTENSITY, VELOCITY, SPECTRAL CONTENT, POLARISATION, PHASE OR PULSE CHARACTERISTICS OF INFRARED, VISIBLE OR ULTRAVIOLET LIGHT; COLORIMETRY; RADIATION PYROMETRY
- G01J3/00—Spectrometry; Spectrophotometry; Monochromators; Measuring colours
-
- G—PHYSICS
- G01—MEASURING; TESTING
- G01J—MEASUREMENT OF INTENSITY, VELOCITY, SPECTRAL CONTENT, POLARISATION, PHASE OR PULSE CHARACTERISTICS OF INFRARED, VISIBLE OR ULTRAVIOLET LIGHT; COLORIMETRY; RADIATION PYROMETRY
- G01J3/00—Spectrometry; Spectrophotometry; Monochromators; Measuring colours
- G01J3/28—Investigating the spectrum
- G01J3/2803—Investigating the spectrum using photoelectric array detector
-
- G—PHYSICS
- G01—MEASURING; TESTING
- G01J—MEASUREMENT OF INTENSITY, VELOCITY, SPECTRAL CONTENT, POLARISATION, PHASE OR PULSE CHARACTERISTICS OF INFRARED, VISIBLE OR ULTRAVIOLET LIGHT; COLORIMETRY; RADIATION PYROMETRY
- G01J3/00—Spectrometry; Spectrophotometry; Monochromators; Measuring colours
- G01J3/28—Investigating the spectrum
-
- G—PHYSICS
- G01—MEASURING; TESTING
- G01J—MEASUREMENT OF INTENSITY, VELOCITY, SPECTRAL CONTENT, POLARISATION, PHASE OR PULSE CHARACTERISTICS OF INFRARED, VISIBLE OR ULTRAVIOLET LIGHT; COLORIMETRY; RADIATION PYROMETRY
- G01J3/00—Spectrometry; Spectrophotometry; Monochromators; Measuring colours
- G01J3/28—Investigating the spectrum
- G01J2003/2866—Markers; Calibrating of scan
Definitions
- This invention relates to spectrometric instruments, and particularly to the standardization and calibration of such instruments to correct for intrinsic distortion of spectral data by the instruments.
- Spectrometric instruments include a dispersion element, such as a diffraction grating, and a detector system.
- the detector is a conventional solid state device comprising an array of individual pixel photodetectors in which pixel location represents wavelength detected.
- Such a detector typically is a photodiode array, a charge coupled device or a charge injection device.
- Other spectrometric instruments scan the dispersion element over a single photodetector, or use Fourier transform of an interferogram, but the concepts are the same in that wavelength is calibrated against a physical location, orientation or the like.
- Modern instruments include a computer that is receptive of spectral data from the detector to analyze and compare spectra.
- PCR Principal Component Regression
- PLS Partial Least Squares
- Calibrations also are performed with lamps or transmission filters that provide certain spectral lines of known wavelength. As such sources are available only for a few wavelengths, a fringe pattern such as with a Fabry-Perot interferometer is utilized to calibrate across the desired spectral range. Correlating the known wavelength with a fringe pattern has been a challenge.
- a mathematical model for estimating wavelengths with a standard and an interferometer is taught in a text "Fiber Optics in Astronomy" Volume 3, ed. by Samuel C. Barden (Astro. Soc. of the Pacific, 1988), pages 218-223. These methods apparently have not been applied to the field of analytical chemistry.
- a typical spectrophotometer is described in "A Photodiode Array Based Near-Infrared Spectrophotometer For The 600-1100 nm Wavelength Region", by D. H. Mayes & J. B. Callis, Applied Spectroscopy 43 (1), 27-32 (1989) and "Laptop Chemistry: A Fiber-Optic, Field Portable, Near-Infrared Spectrometer” by H. Lysaght, J. Van Zee and J. B. Callis, Reviews of Scientific Instrum. 62 (2) 507-515 (1991).
- a problem with high precision measurements is that instruments vary from each other, and each instrument varies or drifts with time. The problem is partly one of achieving and maintaining calibration.
- the instruments have intrinsic characteristics that are individual to each instrument and also vary with time. Intrinsic characteristics distort the data effected by the instrument, rendering comparisons inaccurate.
- Such an intrinsic characteristic is typified by the profile of spectral data representing a very narrow, sharp spectral line. Such a profile has an intrinsic shape and line width wider than the actual line, due to the fundamental optical design as well as diffraction effects and other imperfections in the optics and (to a lesser extent) electronics in the instrument.
- An ideal profile is symmetrical, close to gaussian, but an actual intrinsic profile, also known as "instrument profile”, may not even be symmetrical.
- a primary object of the present invention is to provide a spectrometric instrument with a novel means for effecting standardized spectral data.
- a further object is to provide a novel method for standardizing spectrometric instruments, particularly instruments having an intrinsic characteristic that distorts data, more particularly instruments having a characteristic intrinsic profile for narrow spectral lines.
- Other objects are to provide a novel method and means for transforming all data of the instrument so that such data is standardized for comparison with any other such standardized spectral data.
- Another object is to provide an improved method and means for calibration of spectrometric instruments, and for incorporating the aforementioned standardizing into the calibration. Another object is to provide a novel high finesse etalon that may be utilized in the calibration. Another object is to provide an improved method of determining spectral peak location of an optical standard, particularly for effecting the calibration.
- a method of standardizing a spectrometric instrument having a characteristic intrinsic profile for a hypothetically sharp spectral line in each segment of a selected spectral range, each intrinsic profile having an associated intrinsic width.
- the instrument includes a line source of at least one narrow spectral line in at least one selected spectral segment, generally in a plurality of tandem segments. Each narrow spectral line has an associated line width substantially narrower than the intrinsic width for a corresponding selected segment.
- the method comprises specifying a target profile for a hypothetically sharp spectral line in each selected segment, such as a gaussian with a profile width roughly equal to the intrinsic width.
- the method further comprises initially operating the instrument with the line source to produce a set of profile data for each narrow spectral line such that each set of profile data is representative of the intrinsic profile for a corresponding selected segment, computing a transformation filter for transforming each set of profile data to a corresponding target profile for each selected segment, and saving the transformation filter for future application to sample data.
- the method further comprises normally operating the instrument with a sample source to produce sample data representative of a sample spectrum, and applying the transformation filter to the sample data in each selected segment to generate standardized sample data representative of the sample spectrum.
- the instrument should be preliminarily operated to store nominal background data. Thereafter, prior to the steps of computing and applying, all spectral data including the profile and the sample data are corrected with the nominal background data, preferably by dividing such spectral data by the nominal background data. Also prior to such steps, the spectral data should be calibrated according to ordinary intensity calibration.
- the method further comprises establishing a wavelength calibration for the instrument, combining the wavelength calibration with the transformation filter to effect a correction matrix, and saving the correction matrix for future application to sample data.
- the correction matrix is applied to sample data to generate calibrated standardized data representative of the sample spectrum.
- the instrument is operated with a wavelength calibration source of radiation to produce calibration data.
- the transformation filter or most preferably a correction matrix containing the filter, is then applied to the calibration data to generate standardized calibration data constituting the wavelength calibration.
- the instrument has a nominal (e.g. theoretical or preliminary) calibration of spectral wavelength versus spectral locations across the desired spectral range.
- the instrument further includes a calibration source of a primary spectral peak of precisely identified wavelength, such as a neodymium doped yttrium aluminum garnet filter.
- the instrument also includes a source of a multiplicity of secondary peaks spaced across the spectral band, advantageously fringes from a Fabry-Perot low finesse etalon such as an uncoated fused silica plate.
- Each secondary peak has an integer order number identified by a correlation function (e.g. a simple fringe equation) to a peak wavelength in accordance with a correlation constant.
- the step of establishing a wavelength calibration comprises the following:
- the instrument is additionally operated with the calibration source to produce calibration data representative of the primary spectral peak, and further operated with the multiple peak source to produce secondary data representative of the multiplicity of secondary peaks.
- the calibration data is ascertained from the primary peak location with respect to the spectral locations.
- a set of secondary peak locations is ascertained with respect to the spectral locations.
- the correlation constant is estimated in accordance with order number differential for at least two peak wavelengths determined by the nominal calibration.
- a calibration order number is identified for at least one selected secondary peak located adjacent the primary peak, said identifying being effected in accordance with the estimated correlation constant and a preliminary wavelength determined for the selected secondary peak by the nominal calibration.
- a precise relative positioning of the selected secondary peak and the primary peak is interpolated from the selected secondary peak.
- a precise correlation constant is calculated from the calibration order number, the precisely identified wavelength and the relative positioning. The precise correlation constant is then utilized with the correlation function to assign calibrated wavelengths to associated order numbers and thereby to secondary peak locations with respect to the spectral locations.
- the calibration data define a calibration profile.
- the step of ascertaining comprises estimating a centroid wavelength of the calibration profile, reversing the calibration profile about the centroid wavelength to create a reversed profile, adding the calibration profile and the reversed profile to create a combined profile, and fitting the calibration data to the combined profile to determine an offset between the estimated centroid wavelength and the primary spectral peak. The offset thereby defines the primary peak location with respect to the spectral locations.
- Objects are additionally achieved by a certain type of Fabry-Perot high finesse etalon for passing near-infrared spectral lines.
- the etalon comprises a thin polymer film having a semitransparent gold coating on each side thereof, each coating being sufficient to provide between 1% and 10% transmission. This etalon is utilized advantageously for effecting the aforementioned narrow spectral lines.
- a spectrometric instrument that further includes a standardizing system comprising means for effecting various aforementioned steps.
- FIG. 1 is a schematic drawing of a spectrographic system incorporating the invention.
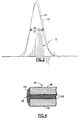
- FIG. 2 is a spectral plot illustrating an intrinsic profile of a spectrographic instrument, a target profile selected according to the invention, and an associated transformation filter.
- FIG. 3 is a flowchart for a computer program utilized in the invention.
- FIG. 4 is a cross section of a high finesse etalon according to the invention.
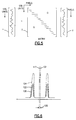
- FIG. 5 is an illustration of a vector multiplication utilizing a correction matrix according to the invention.
- FIG. 6 is a spectral plot illustrating a double peak calibration profile and a treatment thereof according to the invention.
- FIG. 7 is a spectral plot illustrating a low finesse spectrum utilized in the invention.
- FIG. 8 is a detailed flowchart for a step to isolate profiles in the flowchart of FIG. 3.
- FIG. 1 illustrates a typical spectrometric instrument 10 having a photodetector 11 for which standardization and wavelength calibration is to be effected according to the present invention.
- Such an instrument may be, for example, an on-line chemometric spectrographic polychromator requiring high sensitivity and stability in the near infrared for measuring octane number of gasoline.
- a stable but otherwise ordinary incandescent light source 12 provides light 13 that passes through a relay lens 14 focused on an input end of an optical fiber 16 .
- the fiber directs the light to a probe assembly 18 immersed in a liquid such as the gasoline to be tested.
- the probe instead may have folding optics with reflections to lead light back into a return fiber, such as disclosed in copending U.S. patent application No. 733,189 filed October 8, 1991 of the present assignee.
- a sample space 20 is provided for the liquid so that the light 22 is passed through the liquid, where some of the light may be filtered selectively.
- the filtered light is picked up by a second optical fiber 24 .
- a bypass fiber 26 with optical switching 28 is provided for selectively bypassing the liquid with the light through the fibers, to provide a standard with which to compare the filtered light.
- Other optical reference means may be used instead of the bypass.
- the second fiber 24 carries the light to a spectrometer 32 utilizing, for example, a concave holographic grating 33 , which disperses the light 35 to the detector 11 .
- Signals from the detector representing the spectrum are directed into a computer 37 for storing 39 on disk or other memory, and processing.
- the spectrum is used as a "fingerprint" of the sample liquid, which may be compared to or calibrated against standard spectra, or used to build chemometric models.
- the photodetector 11 is a conventional solid state type such as a RL1O24S PDA produced by EG&G Reticon.
- a detector typically is a self scanned photodiode array, a charge coupled device, or may be a charge injection device, or the like. This has a linear array of adjacent photosensitive pixel areas 41 , for example 1024 such pixels. The pixels are read out sequentially to produce voltage signals fed through a line 42 to the computer 37 .
- a collimation zone 44 is provided in one of the fibers for inserting a disk 43 having several openings therein as shown in FIG. 1.
- An associated pair of lenses 45 (one shown) pass collimated light through a selected opening between fiber ends.
- One opening 47 is left empty for passing unfiltered light for normal operation of the instrument to measure samples or background.
- the other openings contain optical filter elements 46 , 48 , 50 described below.
- the disk is positionable manually or, more normally, by motor 52 automatically by computer 37 via line 53 (e.g. at selected intervals for recalibrating) for the selected opening or filter.
- a spectrometric instrument typically introduces line broadening and distortion because of imperfect optics. This effect may be described in terms of a characteristic intrinsic profile 54 (FIG. 2) for a very sharp spectral line in the spectrum.
- the profile may vary across the spectrum, i.e., the profile band width and distortion may vary.
- at least one segment of a spectrum e.g., the segment shown in FIG. 2 is selected in the spectral range of interest.
- An intrinsic instrument profile exists and is identified for each selected segment.
- Each such profile has an associated intrinsic bandwidth w , conventionally defined as the width of the profile at half height.
- FIG. 3 A flowchart of the overall standardising and calibration procedure is shown in FIG. 3, illustrating method and means for implementing the invention.
- the present invention has two general aspects, namely a profile standardization 56 involving construction of a transformation of the profiles of the spectra to an absolute standard replacing instrumental effects, and a precision wavelength calibration 58 .
- these two aspects are utilized together at two stages: In one stage the transformation is applied to calibration data during the calibration determination. In the other stage the transformation and the wavelength calibration are combined into a correction matrix. This matrix is then applied 59 to all subsequent data including sample data, iterations on recalibrations and updated standardizations.
- data refers to signal information from the detector related to intensity of radiation incident on the detector for the detected wavelength, and also refers to such information in a normalized, transformed or other treated form as specified herein.
- the instrument is preliminarily operated 60 to measure and store nominal background data 62 .
- a target profile 63 intended to replace the intrinsic profile by transformation of data, is specified for a hypothetical narrow spectral line in each selected segment; for example, as shown in FIG. 2 and as explained below, the target profile 63 may be gaussian.
- a line source provides at least one narrow spectral line in each selected segment, each such line having an associated line width substantially narrower than the intrinsic width for a corresponding selected segment.
- the raw spectral data for each of these lines will have an associated profile (FIG. 2) due to the instrumental effects.
- the instrument is initially operated 64 with the line source to store a set of profile data 66 for each of the selected narrow spectral lines, each peak in the profile data being representative of the intrinsic profile for a corresponding selected segment.
- the profile data is normalized 68 by dividing it by the nominal background data 62 .
- a transformation digital key filter 72 for each selected segment is ascertained 74 by computer program, such that the filter transforms each intrinsic profile 106 to a corresponding target profile 63 .
- Interpolations 76 are preferably applied to fill in gaps between the selected segments so as to generate all filters 78 , one such filter being for each of a set of selected spectral elements across the spectral range of interest.
- a wavelength mapping calibration for the instrument is established, such as with procedures 58 described below.
- the wavelength calibration is combined with the transformation filters 78 to build 82 a correction matrix 84 which is stored for general use 59 on measured data when the instrument is normally operated.
- the instrument is normally operated 86 with sample radiation to store measured data 88 representative of a sample spectrum.
- the sample may be virtually any source of radiation, direct or transmitted, scattered, reflected, fluorescent etc., for example atomic emissions or the aforementioned transmitted radiation through gasoline.
- the correction matrix 84 containing the transformation filter, is then applied 90 to the data to generate standardized, calibrated data 92 representative of the sample spectrum and background. These can be further processed chemometrically to extract desired information.
- the measured data is described herein with respect to pixels. Such designation is intended to represent not only a multiplicity of photoreceptive areas on a photoreceptor, but also any other equivalent spectral locations in physical increments (physical mapping) of spectral points such as in a scanning or Fourier transform instrument.
- units are arbitrary and only need to be calibrated to wavelength which, if transformation is ideal, is absolute wavelength.
- Such units are termed herein “standardized units” and are in “standardized increments” for "standardized data” representing "standardized spectra,” and need not have 1:1 correspondence with pixels or other physical increments. For example, there may be only about half as many standardized increments as pixels over a desired IR spectral range.
- Some signal pretreatment as part of the operation of the instrument should be performed on all raw signal data coming from the detector. This includes intensity calibration, i.e. ordinate linearization. Such calibration may be effected by any known or desired precision method, such as disclosed in the present assignee's co-pending application Serial No. filed [attorney docket No. ID-4046]. Another pretreatment is substraction of dark signals, i.e. signals with light blocked off.
- All signal data should be normalized with the nominal background 62 .
- a background may be estimated, or preferably determined by preliminarily operating the instrument to store such nominal background data.
- the exact shape of the nominal background is not critical; the purpose is to remove most of the fixed pattern variation and gross spectral variation. Once determined, this nominal background is stored permanently and always applied consistently (without change) to all other data prior to any further treatments of the data except the pretreatment.
- the normalizing is effected by dividing the data by the nominal background. Except for the profile data (Step 66 ), it is most convenient in computerized computations to incorporate the nominal background into the correction matrix 84 to eliminate separate computational steps.
- all sample and calibration data 88 , 121 , 130 are corrected in the conventional manner for ordinary background 94 (as well as nominal background) taken at about the same time as the data.
- the data and ordinary background are first standardized and calibrated ( 90 , 127 , 132 , 95 respectively) by applying the correction matrix 84 .
- the preliminarily corrected sample or calibration data are further corrected ( 97 , 97' , 97'' ) for ordinary background, usually by dividing by the corrected background. This produces corresponding fully corrected data 92 , 129 , 134 respectively.
- the foregoing corrections for ordinary background may be omitted.
- a further step may be the conventional conversion of data from transmittance to absorbance. This is generally only for absorption spectra and is effected by taking a logarithm of the matrix-corrected data. In this case the matrix-corrected ordinary background is also converted and subtracted from the other data.
- a spectrometric instrument ordinarily displays a characteristic intrinsic profile 54 (FIG. 2) that is generally non-ideal and asymmetrical and may vary over the spectrum of interest. More importantly, at a high precision level, the profile varies from instrument to instrument and even from time to time.
- a prime objective of the invention is to transform such line shape in an output spectrum to a uniformly defined target profile 63 . More generally, all spectra produced by the instrument, line or otherwise, are transformed in the same manner, so that the output spectra are no longer instrument-dependent and may be compared with very high precision.
- a step in the present invention is to specify the shape and width of the desired target profile 63 .
- This is the spectral shape desired for the single beam spectrum of a very sharp, narrow input line (e.g., atomic emission or laser line). It is also the desired shape for a very weak, sharp absorbance feature where the true underlying absorption line has negligible width.
- the target profile may be any convenient, mathematically definable shape that is reasonably comparable to the instrument profile such as gaussian, supergaussian, convoluted gaussian, rectangular or triangular.
- the target profile is gaussian in shape.
- the target profile width W is normally chosen to be about the same as, or slightly greater than, intrinsic widths w , although it can be somewhat less; i.e.
- the profile width W should be nominally equal to the intrinsic width w of the instrument profiles.
- the target profile width and other parameters may be specified to vary as a function of wavelength, either because the resolution requirement of the measurement varies or because the worst-case resolution of the physical instrument varies significantly across the spectrum.
- the target profile width may be specified as a polynomial (up to 4th order) in absolute wavelength. However, where possible, it is preferable not to vary the width and perhaps to allow only a linear variation across the working spectral range.
- a set of characteristic instrument profiles 66 is generated 64 and stored from a line source having a series of very sharp spectral lines across the spectral region of interest.
- the source of lines is not critical as long as there are sufficient lines for the purpose and they are sharp.
- a series of laser lines or an atomic emission line source may be used, if a sufficient number of lines can be provided.
- the lines should be substantially narrower than the intrinsic width, preferably less than 20% of the intrinsic width.
- a particularly suitable source of lines is a high finesse Fabry-Perot etalon 46 inserted into the white light radiation beam as one of the filters in the disk 43 (FIG. 1).
- a highly advantageous form of etalon is a polymer film, such as nitrocellulose. In the etalon structure, the film may be stretched over a ring or, advantageously, sandwiched between a pair of planar glass windows 98 with index-matched optical cement. An epoxy encapsulation or other seal 100 should encircle the structure.
- the film should be of thickness such as to provide appropriate density of peaks, neither too close (excessive overlap) nor too far apart.
- the film is coated on both sides with a semitransparent gold coating 102 . Each gold coating should provide between 1% and 10% transmission, for example about 4%, generally achieved with approximately 300-400A thickness of gold. Such an etalon has been found to provide very sharp fringe lines with a finesse of about 40.
- the profile data 66 is normalized by dividing ( 68 ) it by the nominal background 62 .
- the initial normalized profiles 104 may have some overlapping wings which should be modified at the tips by curve substitution to remove the overlaps ( 70 ).
- Key transformation filters 72 e.g. 15 such key filters, required to convert from modified intrinsic profiles 106 to target profiles are computed ( 74 ) for an initial set of selected spectral wavelengths 108 .
- Interpolations are made ( 76 ) between the selected wavelengths to establish a set of transformation filters 78 suitably covering the desired spectral region, in terms of pixel locations. It has been found to be more accurate to effect all of the filters from interpolations, substituting for the original key filters.
- Wavelength calibration 80 is then combined with the filters 78 over the pixel range, to effect the correction 84 matrix which is stored for future application to sample data to generate standardized data representative of a sample spectrum.
- the vector process of converting raw spectra into standardized spectra is illustrated in FIG. 5.
- the transformation is a linear one, and so the conversion is implemented as a simple vector-matrix multiplication.
- the information needed to generate a particular standardized spectral element comes essentially from a limited segment of the raw spectrum, a region of width amounting at most to several times the instrument profile width.
- most of the coefficients T ij , in the matrix T can be taken as zero.
- Each row of the matrix contains a few (typically 20-40) nonzero elements, on or near the diagonal, so that the matrix T can be stored efficiently in compact form, and the actual matrix multiplication can be relatively fast.
- the units of the vectors Y and y are not equal in general. Typically 1024 pixels are in y and 500 to 750 spectral increments are in the standardized vector, but the latter number can vary widely depending on the requirements of the application.
- the standardized units are arbitrarily defined in terms of absolute wavelength; i.e. pixels are not directly calibrated.
- the correction matrix 84 effects the calibration so that sample data is related directly to wavelength.
- An outline for wavelength (WL) calibration of the instrument is included in the flowchart of FIG. 3.
- a stored initial wavelength calibration 112 is provided conventionally by a nominal instrument calibration using an optical model of the instrument augmented by use of a calibration lamp to determine critical parameters.
- the optical model computation is effected by normal methods from the physical arrangement of the instrument.
- the initial calibration can and should be reasonably accurate, for example 99.9% accurate.
- An initial correction matrix 84 is generated ( 82 ) with the initial calibration.
- Subsequent precision calibration spectral data from physical standards in the instrument are treated (generally 58 ) with a refined correction matrix 84 built from the initial matrix, via refinements made with one or more iteration loops 118 .
- the initial calibration is in terms of spectral wavelength versus spectral locations such as photodetector pixels across a desired spectral band.
- wavelength is used herein and in the claims, wave number or frequency may be utilized as being equivalent for the purpose.
- the instrument includes a physical standard calibration source of at least one primary spectral peak of precisely identified wavelength.
- a preferred source is an optical standard 48 inserted in the radiation beam, by way of the disk 43 (FIG.1).
- An especially suitable optical wavelength standard for short-wave near-infrared is a neodymium doped yttrium aluminum garnet (Nd:YAG) crystal filter which absorbs at two proximate primary spectral peaks of precisely identified wavelengths (approximately 938.5 and 946.0 nanometers.) The two peaks together define a central primary spectral peak 117 (FIG. 6) at a precisely identified wavelength.
- spectral peak means the center of a single peak as well as, more generally, an identified center of several peaks such as the Nd:YAG doublet.
- the instrument is firstly operated 119 with the wavelength calibration source to produce calibration data 121 representing the primary spectral peak and defining a calibration profile.
- the calibration data is modified by the pretreatments described above including ordinate calibration, and is corrected ( 127 ) by the correction matrix 84 and for background ( 97' ) to generate corrected standard peak data 129 .
- the latter advantageously includes the nominal background normalization, and also includes a wavelength calibration which initially is from the optics model or subsequently via an iteration loop from a prior calibration sequence.
- the apparent wavelength of the center (peak) of the WL standard profile is determined by any of several methods.
- the original calibration profile 120 is stored, and this profile is also reversed about an estimated centroid wavelength 121 with respect to the spectral locations to create a reversed profile 122 .
- the stored profile and the reversed profile are then added to create a fully symmetric combined profile 124 .
- the original calibration data 120 is then fitted to the combined profile 124 to determine an offset 125 between the estimated centroid wavelength 121 and the primary spectral peak 117 . The offset thus defines the primary peak location with respect to the spectral locations.
- the offset 125 of the WL standard profile 120 from the nominal center is precisely determined by a conventional least squares fitting procedure using the combined profile 124 and its derivative with respect to wavelength as model components.
- the resulting center position 117 is used to calibrate one point in the corrected spectrum to the known reference wavelength. Details are set forth below under Examples of Computational Methods.
- the instrument is further provided with a physical standard source for producing a multiplicity of secondary peaks spaced across the spectral band, each secondary peak having an integer order number identifiable to a peak wavelength in accordance with a correlation constant.
- a suitable standard is a Fabry-Perot low finesse etalon 50 , preferably an uncoated fused silica plate of about 50 microns thickness, disposed in the disk 43 (FIG. 1). This optical element transmits the radiation in a fringe pattern of the multiplicity of secondary peaks.
- the element has an index of refraction (n) related slightly to wavelength in a well-defined and well known relationship.
- T' is two times an effective thickness of the element; i.e. T' is approximately 2T where T is actual thickness.
- T' can be determined very accurately by procedures disclosed herein, the actual thickness need not be known. Also, the procedures will average out nonuniform thickness and temperature-induced changes and account for slight misorientation of the etalon in the instrument, which may vary from time to time.
- the instrument is secondly operated 128 (FIG. 3) with the low finesse (LF) etalon to produce secondary data 130 representing the secondary peaks which have peak locations ascertained with respect to pixels.
- the secondary data are corrected 132 by the matrix 84 to produce corrected secondary peak data 134 .
- the peak wavelengths are only approximate, being no more accurate than the optical model calibration contained in the correction matrix applied.
- the next step 136 utilizes the above equation in conjunction with the accurately known wavelength of the primary peak 117 (or its centroid equivalent) of the Nd:YAG crystal, to accurately locate the secondary (fringe) peaks with respect to the pixel locations, or more directly with respect to standardized locations which relate by calibration to the pixel locations.
- the correlation constant T' is first estimated in accordance with at least one selected order number and a corresponding peak wavelength determined by the nominal calibration. This estimate is conveniently effected by fitting wavelengths to the above equation and taking a derivative to provide the slope T'.
- a calibration order number i.e. true integer order number, is then identified for a selected secondary peak located adjacent the primary peak, such identification being in accordance with the equation, the estimated correlation constant and a preliminary wavelength determined for the selected secondary peak by the nominal calibration. Order numbers for all other secondary peaks are then established by simply counting up and down from the calibration number.
- a practical order number for the primary peak is interpolated from secondary peaks on either side of it, one being the selected secondary peak.
- a precise correlation constant is then calculated from a fractional order number and the precise primary peak wavelength.
- the precise correlation constant is utilized with the above equation to assign absolute calibrated wavelengths to associated order numbers and thereby to secondary peak locations with respect to the spectral locations.
- the wavelength correction coefficients 116 are stored, the wavelength mapping 114 is updated, and the correction matrix 84 is also updated.
- the observed peak locations in the secondary data are fitted ( 138 ) to develop a preliminary model of apparent wavelength locations (according to current wavelength calibration), and the peaks in this model are subtracted ( 140 ) from the assigned absolute calibrated wavelengths to provide wavelength errors across the spectrum.
- the errors are curve fitted using polynomials ( 142 ), and a decision is made ( 144 ) as to whether the error curve is within a predetermined acceptable level. If not, the steps are iterated on the minor recalibration loop 118 , which has a branch 150 to include an update 147 of wavelength correction coefficients 116 for the mapping generator 114 . If so, the calibration is deemed complete ( 146 ), and the correction matrix 84 is held ready for application to sample data.
- the procedure of FIG. 3 operates iteratively, with two loops, viz. a major recalibration loop 148 and the minor recalibration loop 118 . All operations are parameter table driven and run automatically. Normally, major recalibrations are performed infrequently, or when repairs are made to the system. These are relatively computation intensive and time consuming. Minor recalibrations are quicker and can be made as frequently as needed, according to the passive stability of the optical system. Normally, the minor loop is iterated until convergence is obtained in that the corrections to mapping polynomial correction coefficients become negligible. This may require 3 to 4 iterations on the initial factory calibration, but usually only 1 or 2 thereafter.
- the programming means for carrying out the foregoing steps is conveniently and readily achieved with a conventional computer language such as "C” generally available through the supplier of the operating system utilized with the computer. Curve fitting is conventional and programs therefore are readily available.
- the overall program may be compiled, for example, on a Digital Equipment Corporation Model 316+ computer that may be associated with the spectrometer.
- This invention provides for a common standardization of data produced by each instrument having the same selected target profile.
- the standardization is such that all such data derived from various instruments, and from each instrument from time to time, is as if it were all produced by a single hypothetical unchanging instrument.
- Such hypothetical instrument has as its intrinsic profile the selected target profile, and has a wavelength accuracy virtually as precise as desired in the setting of error acceptance level, except as limited by signal/noise (S/N) ratio and reproducibility of the primary wavelength standard calibration source. Recalibrations from time to time can be completely automated, so that an instrument can provide continuously accurate output data.
- Such an instrument is especially suitable for detecting very subtle differences in radiant transmissions or emissions, such as for monitoring gasoline octane by near infra-red transmission.
- the invention generally provides for standardizing a spectrometric instrument having an intrinsic characteristic representing a distortion of spectrometric instrument data effected by the instrument.
- the invention includes specifying a hypothetical target function (profile) for spectrometric standardized data.
- the target function is comparable to the intrinsic characteristic, such as a gaussian of similar width to an intrinsic profile.
- a transformation function e.g. a matrix
- wavelength calibration it should be combined with the transformation function to effect a correction function, which is applied to instrument data to generate calibrated standardized data.
- the normalized profiles may have overlapping wings which should be modified to remove the overlaps. Any suitable procedure may be used.
- each valley is fitted to yield a L , b L , a R , b R , and C.
- the baseline is replaced by a global polynomial fit to the C's.
- the b values are replaced by smoothed values resulting from a polynomial fit to the first round values (left and right independently).
- the two a coefficients in each valley are then refitted using a simple linear LS fit (2 parameters only).
- the resulting exponential wing models are then joined to the observed profile cores to provide separate isolated key profile estimates.
- a flowsheet for the procedure is given in FIG. 8.
- the correction can be found by separate measurements using a much higher resolution spectrometer or, alternatively, by comparing the gold etalon peaks to gas emission line peak shapes.
- Deconvolution filters can be computed with a least squares regression technique which is identical to that used in computing the filters herein.
- a set of Key Filters is generated, at least one for each of the Key Profiles above.
- the filter sizes n F are specified in advance.
- the user may specify several groups of filters to span the spectral range, each with different sizes. This allows optimization of memory use and speed, since narrower filters can be used in parts of the spectral range where they are sufficient, and wider filters used only where necessary (because of poorer instrument resolution or more exacting chemometric requirements). Group allocation also permits use of very short filters at the extremes of the spectral range in order to minimize the "dead zone" at each end.
- the profile digital filters are designed and computed to be those linear filters of specified length n F which minimize the mean square error between the transformed raw profiles and the corresponding target profiles.
- the computation method is straightforward and well known.
- the coefficients F i which make up the filter are determined as the fit coefficients in a normal linear least squares regression in which the model vectors are successively shifted copies of the raw profile, and the target profile function to be fitted is the desired target profile (typically gaussian).
- the regression calculation may be weighted uniformly, or the extremes of the profile may be preferentially weighted to improve filter performance in the wings.
- Filters are scaled to unit sum of coefficients.
- the filter is designed to produce minimal shift of the peak centroid. This is accomplished by first computing the centroid of the raw profile. A corresponding offset is then incorporated into the synthetic target profile, so that the filter need produce no profile shift. In spite of this precaution, the resulting filters always have some residual shift effect, as evidenced by their non-zero centroids.
- the calculation is performed entirely in pixel space. Therefore, in synthesizing the target profile which is the target of the least squares regression which generates the filter, one must take into account the mapping of standardized elements onto pixels, a mapping which varies over the spectrum. In addition, the width of the target profile may be specified to be wavelength dependent. Therefore, Key Filter generation can be done correctly only when the wavelength calibration is complete and accurate. On the first pass, the mapping will necessarily be approximate, so that the filters generated will be somewhat inexact. Accordingly, the entire procedure must be iterated at least once (the major recalibration loop). The errors are, however, of second order in the wavelength error and convergence of the PDFs is very rapid.
- each filter will be slightly different. In practical cases, the variation of physical instrument profile is gradual enough that PDFs can be successfully interpolated between Key Filters.
- the interpolation procedure occurs in the space of arbitrary (standard wavelength) units (substituting for pixel space after transformation), and is carried out coefficient by filter coefficient.
- interpolation is carried out only within each group.
- the key filters included in each group overlap so that key profiles near the group boundaries are used to generate PDF's for both sizes. This ensures that PDFs for every standardized element can be obtained by interpolation on filters of one group or another, except at the extreme ends of the spectral range, where extrapolation may be required.
- Any standard interpolation method can be used to derive intermediate filter coefficients at a particular element.
- Three point Lagrange interpolation effectively uses a quadratic fit to 3 points (i.e., the j th coefficients of 3 successive filters).
- Linear interpolation/extrapolation is used at the end regions (Lagrange 2 Point Interpolation).
- Key filters are not necessarily equally spaced.
- the matrix which actually performs the transformation can be built.
- the matrix which actually performs the transformation can be built.
- This segment is basically the corresponding PDF, modified to generate the correct fractional pixel shift according to the wavelength mapping.
- each element is divided by the fixed nominal background pixel spectrum to introduce the desired normalization.
- the segment center is positioned to point to the pixel which comes closest to mapping into the i th element.
- the coefficients S ij are nonzero only over a few pixels around the closest pixel mapping from standardized element i.
- the choice of interpolation method used to generate the shifting filters depends on the quality of the raw data. When spectra are reasonably oversampled (e.g. 10 pixels/profile width) and the S/N is very high (>104), fairly simple interpolation methods are adequate.
- the shift can be implemented using low order Lagrange interpolation (usually 4 point, corresponding to fitting a cubic polynomial to 4 points straddling the interpolation fractional pixel value.)
- the 4 Lagrange coefficients constitute the shifting filter S i . When it is convolved with the PDF F i , the segment length increases by 3 pixels.
- the raw spectrum of the wavelength standard (e.g., Nd:YAG laser crystal, 6mm thick, doped ⁇ 0.5%) is standardized and converted to double beam absorbance form, that is, the standardized intensity spectrum is divided by a standardized background measured contemporaneously, and the result converted to absorbance (-log10).
- a window is searched around the expected location of the standard line.
- a peak location algorithm is used to determine its position in standardized units (equivalent to absolute wavelength, provided that calibration has converged). The offset of the observed peak position from its known true position is then noted, in standardized elements.
- a suitable peak location algorithm follows: First, a rough peak find is performed. This is the highest spectral point in the search window. In case of symmetric multiplets we pretreat the spectrum by superimposing and adding multiple copies of the spectrum which are shifted symmetrically by the known multiplet spacing, as close thereto as the standardized element spacing allows without interpolation. This results in a composite pseudospectrum which has a single highest peak at the center of symmetry of the multiplet. The peak location can now be refined by computing the centroid of this pseudospectrum center peak (about its highest point). The centroid calculation requires that a lower level of cutoff be established; this is done as a fixed fraction of the peak height above baseline.
- the original spectrum is then fitted using ordinary linear least squares regression using as model vectors: (a) the symmetrized peak shape model, (b) the numerical derivative of the peak shape model, and (c) one or more polynomial background terms (typically a constant, linear term, and quadratic term).
- a shift of the observed line can be modelled to first order as an admixture of its first derivative.
- the least squares fit coefficient corresponding to the derivative vector is a measure of the peak shift from its assumed position. This is valid so long as the shift is a small fraction of the peak width, which condition is assured by the rough peak finding procedure above.
- a technique for determining the shift is disclosed in copending U.S. patent application No. 771,705 filed October 4, 1991 of the present assignee.
- a second wavelength standard line e.g. one located at 853 nm in the Nd:YAG. This one is used to determine the instrument wavelength dispersion early in the calibration sequence, and avoids possible mistaken identification of marker etalon fringe numbers. It has no effect on the ultimate calibration.
- a single low finesse fringe spectrum is used to determine the effective etalon thickness and measure standardized calibration abscissa errors at each peak (and valley) of the fringes.
- a mean-centered double beam standardized absorbance fringe spectrum in an envelope 151 is shown in Fig. 7. Peaks 152 and valleys 154 (which constitute peaks for the present purpose) are located approximately by finding the zero crossings of the fringes. The peaks and valleys are taken to be approximately midway between zero crossings in wavenumbers (reciprocal wavelength).
- a least squares regression is performed to establish the envelope of the fringes, by fitting a polynomial (of order ⁇ 2) simultaneously to the peak and valley points. This envelope fit is used later in the fringe analysis.
- the fringe number at which the wavelength standard line occurs is found.
- several (typically 2 to 5) adjacent fringe extrema straddling the standardized unit location of the wavelength standard are examined in detail.
- their peak (valley) Z locations are accurately measured by a procedure to be described below.
- the fringes are now computed one by one. For each there is (a) computed the theoretical Z location based on the effective thickness and (b) measured the observed Z location using a fitting procedure (below). The difference is taken as the calibration error at this point in the spectrum. Also, this same information is converted to wavelength error vs physical pixel number. A polynomial fit to the WL errors is then performed, typically of order 3 or 5. The coefficients of this fit, if larger than a specified threshold, are then used to update the master wavelength mapping polynomial correction coefficients by direct subtraction.
- the secondary standard (low finesse etalon) peaks and valley are precisely located by a linear fitting procedure. Small zones of the spectrum surrounding each peak (valley), typically 0.7 to 1.5 fringes wide, are individually least squares fitted using as model functions synthetic modified sine and cosine fringes of appropriate period in Z space. The sine and cosine functions are modified by multiplying them by the envelope function determined above. Baseline offset terms are also included in the fits. Peak location offsets are given by the ratio of sine to cosine regression coefficients.
Landscapes
- Physics & Mathematics (AREA)
- Spectroscopy & Molecular Physics (AREA)
- General Physics & Mathematics (AREA)
- Spectrometry And Color Measurement (AREA)
- Optical Filters (AREA)
Priority Applications (1)
| Application Number | Priority Date | Filing Date | Title |
|---|---|---|---|
| EP97250178A EP0800066B1 (fr) | 1992-02-12 | 1993-01-07 | Etalonnage précis en longueur d'onde d'un spectromètre |
Applications Claiming Priority (2)
| Application Number | Priority Date | Filing Date | Title |
|---|---|---|---|
| US07/834,448 US5303165A (en) | 1992-02-12 | 1992-02-12 | Standardizing and calibrating a spectrometric instrument |
| US834448 | 1992-02-12 |
Related Child Applications (2)
| Application Number | Title | Priority Date | Filing Date |
|---|---|---|---|
| EP97250178A Division EP0800066B1 (fr) | 1992-02-12 | 1993-01-07 | Etalonnage précis en longueur d'onde d'un spectromètre |
| EP97250178.7 Division-Into | 1997-06-09 |
Publications (3)
| Publication Number | Publication Date |
|---|---|
| EP0560006A2 true EP0560006A2 (fr) | 1993-09-15 |
| EP0560006A3 EP0560006A3 (en) | 1993-12-15 |
| EP0560006B1 EP0560006B1 (fr) | 1997-12-10 |
Family
ID=25266968
Family Applications (2)
| Application Number | Title | Priority Date | Filing Date |
|---|---|---|---|
| EP93100106A Expired - Lifetime EP0560006B1 (fr) | 1992-02-12 | 1993-01-07 | Procédé et appareil pour standardise et calibrer un instrument spectrométrique |
| EP97250178A Expired - Lifetime EP0800066B1 (fr) | 1992-02-12 | 1993-01-07 | Etalonnage précis en longueur d'onde d'un spectromètre |
Family Applications After (1)
| Application Number | Title | Priority Date | Filing Date |
|---|---|---|---|
| EP97250178A Expired - Lifetime EP0800066B1 (fr) | 1992-02-12 | 1993-01-07 | Etalonnage précis en longueur d'onde d'un spectromètre |
Country Status (6)
| Country | Link |
|---|---|
| US (1) | US5303165A (fr) |
| EP (2) | EP0560006B1 (fr) |
| JP (1) | JP3768873B2 (fr) |
| KR (1) | KR100264163B1 (fr) |
| CA (1) | CA2087360C (fr) |
| DE (2) | DE69315607T2 (fr) |
Cited By (13)
| Publication number | Priority date | Publication date | Assignee | Title |
|---|---|---|---|---|
| EP0692703A1 (fr) * | 1994-07-15 | 1996-01-17 | Unicam Limited | Etallonage en longueurs d'ondes d'un spectromètre optique |
| EP0834725A3 (fr) * | 1996-10-03 | 1999-06-02 | The Perkin-Elmer Corporation | Analyse de données spectrométriques |
| US5914875A (en) * | 1996-01-11 | 1999-06-22 | Kabushiki Kaisha Toshiba | Method and apparatus for diagnosing plant anomaly |
| WO1999064829A1 (fr) * | 1998-06-12 | 1999-12-16 | Varian, Inc. | Procede d'ajustement spectral automatise rapide |
| WO2000071980A1 (fr) * | 1999-05-21 | 2000-11-30 | Bookham Technology Plc | Procede et systeme pour l'interpretation adaptative de donnees spectrometriques, combinee a un reetalonnage continu |
| EP1879684A4 (fr) * | 2005-04-11 | 2009-07-15 | Cerno Bioscience Llc | Analyse de donnees chromatographiques et de spectre de masse |
| CN103776531A (zh) * | 2014-01-01 | 2014-05-07 | 西安应用光学研究所 | 近红外微弱脉冲光谱辐亮度校准装置 |
| EP2972152A4 (fr) * | 2013-03-15 | 2018-02-14 | P&P Optica Inc. | Appareil et procédé permettant d'optimiser la capture et la correction de données en vue d'une analyse spectroscopique |
| EP3161436A4 (fr) * | 2014-06-27 | 2018-03-07 | Spectral Engines OY | Procédé de détermination d'échelle spectrale d'un spectromètre et appareil |
| CN109211415A (zh) * | 2018-11-20 | 2019-01-15 | 电子科技大学 | 一种基于光源光谱特征波长的波长标定方法 |
| EP2780546B1 (fr) * | 2011-11-15 | 2020-02-26 | Halliburton Energy Services Inc. | Commande d'une opération de forage au moyen d'un élément de calcul optique |
| WO2021126077A1 (fr) * | 2019-12-19 | 2021-06-24 | Ams Sensors Singapore Pte. Ltd. | Étalonnage de longueur d'onde de détecteur |
| WO2025147640A1 (fr) * | 2024-01-04 | 2025-07-10 | Nirrin Technologies, Inc. | Systèmes et procédés de référencement de longueur d'onde et d'intensité |
Families Citing this family (76)
| Publication number | Priority date | Publication date | Assignee | Title |
|---|---|---|---|---|
| FR2611911B1 (fr) * | 1987-02-27 | 1989-06-23 | Bp France | Procede de determination directe d'un indice d'octane |
| US5559728A (en) * | 1990-10-09 | 1996-09-24 | University Of Washington | Calibration transfer for second order analytical instruments |
| US5485268A (en) * | 1993-03-18 | 1996-01-16 | Tobias; Reginald | Multiplex spectroscopy |
| DE4317948C2 (de) * | 1993-05-28 | 1996-07-25 | Werner Dr Schmidt | Monochromator für Spektrometer |
| US5710713A (en) * | 1995-03-20 | 1998-01-20 | The Dow Chemical Company | Method of creating standardized spectral libraries for enhanced library searching |
| US5619332A (en) * | 1995-05-15 | 1997-04-08 | Tracor, Inc. | High spectral resolution fiber optic spectrometer |
| US5729639A (en) * | 1995-05-16 | 1998-03-17 | Santa Barbara Research Center | Sensor system having detector to detector responsivity correction for pushbroom sensor |
| US6459425B1 (en) * | 1997-08-25 | 2002-10-01 | Richard A. Holub | System for automatic color calibration |
| US5717209A (en) * | 1996-04-29 | 1998-02-10 | Petrometrix Ltd. | System for remote transmission of spectral information through communication optical fibers for real-time on-line hydrocarbons process analysis by near infra red spectroscopy |
| US5668374A (en) * | 1996-05-07 | 1997-09-16 | Core Laboratories N.V. | Method for stabilizing near-infrared models and determining their applicability |
| US5838008A (en) * | 1996-12-18 | 1998-11-17 | University Of Wollongong | Method and apparatus for measuring gas concentrations and isotope ratios in gases |
| AU738477B2 (en) * | 1996-12-18 | 2001-09-20 | University Of Wollongong, The | Method and apparatus for measuring gas concentrations and isotope ratios in gases |
| US6138082A (en) * | 1996-12-20 | 2000-10-24 | The Perkin Elmer Corporation | Standardizing between analytical instruments |
| EP0849575A3 (fr) * | 1996-12-20 | 2000-04-19 | The Perkin-Elmer Corporation | Normalisation d'instrument spectroscopique |
| US5850623A (en) * | 1997-03-14 | 1998-12-15 | Eastman Chemical Company | Method for standardizing raman spectrometers to obtain stable and transferable calibrations |
| US5958246A (en) * | 1997-05-16 | 1999-09-28 | The Perkin-Elmer Corporation | Standardization of chromatographic systems |
| JPH11125562A (ja) | 1997-10-21 | 1999-05-11 | Ando Electric Co Ltd | 波長校正装置 |
| US6049762A (en) * | 1997-12-18 | 2000-04-11 | Perkin Elmer Llc | Standardizing a spectrometric instrument |
| US6400468B1 (en) * | 1998-03-31 | 2002-06-04 | International Business Machines Corporation | Smoothing calibration files to improve reproduction of digitized images |
| EP1105710B1 (fr) | 1998-08-14 | 2011-12-28 | On-Site Analysis, Inc. | Procédé de normalisation de l'intensité d'un spectre mesuré par spectrométrie optique à émission |
| US6738502B1 (en) * | 1999-06-04 | 2004-05-18 | Kairos Scientific, Inc. | Multispectral taxonomic identification |
| US6418383B1 (en) * | 2000-02-11 | 2002-07-09 | Perkinelmer Instruments Llc | Method and apparatus for iterative spectral compensation |
| US6687000B1 (en) * | 2000-06-26 | 2004-02-03 | Wisconsin Alumni Research Foundation | Photon-sorting spectroscopic microscope system |
| US6570894B2 (en) | 2001-01-30 | 2003-05-27 | Tektronix, Inc. | Real-time wavelength calibration for swept lasers |
| US6785002B2 (en) * | 2001-03-16 | 2004-08-31 | Optical Coating Laboratory, Inc. | Variable filter-based optical spectrometer |
| US7194369B2 (en) * | 2001-07-23 | 2007-03-20 | Cognis Corporation | On-site analysis system with central processor and method of analyzing |
| US6882874B2 (en) * | 2002-02-15 | 2005-04-19 | Datex-Ohmeda, Inc. | Compensation of human variability in pulse oximetry |
| DE10207733B4 (de) * | 2002-02-22 | 2006-03-23 | Perkin Elmer Bodenseewerk Zweigniederlassung Der Berthold Gmbh & Co. Kg | Spektroskopieverfahren |
| EP1371957B1 (fr) * | 2002-06-11 | 2008-01-09 | Jobin Yvon S.A.S. | Spectromètre |
| US6983213B2 (en) * | 2003-10-20 | 2006-01-03 | Cerno Bioscience Llc | Methods for operating mass spectrometry (MS) instrument systems |
| ATE554458T1 (de) * | 2003-04-28 | 2012-05-15 | Cerno Bioscience Llc | Rechnerisches verfahren und system für die massenspektralanalyse |
| DE20307956U1 (de) | 2003-05-20 | 2003-07-24 | biostep Labor- und Systemtechnik GmbH, 09387 Jahnsdorf | Imagertestgerät |
| WO2005029031A2 (fr) * | 2003-08-01 | 2005-03-31 | Biacore Ab | Procedes et appareil destines a quantifier des profils de resonance optique de liaison a une surface |
| US7099015B2 (en) * | 2003-08-25 | 2006-08-29 | Ivan Melnyk | Fiber optic sensing device for measuring a physical parameter |
| US7414723B2 (en) * | 2004-02-23 | 2008-08-19 | Malvern Instruments Incorporated | Automated interleaved spectral imaging calibration |
| JP4504078B2 (ja) * | 2004-04-26 | 2010-07-14 | オリンパス株式会社 | エアギャップ可変式分光透過率可変素子のエアギャップ基準位置調整構造及びエアギャップ可変式分光透過率可変素子のエアギャップ基準位置調整構造を備えた光学装置 |
| CA2585453C (fr) * | 2004-10-28 | 2020-02-18 | Cerno Bioscience Llc | Analyse par spectrometrie de masse qualitative et quantitative |
| US7583378B2 (en) * | 2006-02-23 | 2009-09-01 | Itt Manufacturing Enterprises, Inc. | Spectrograph calibration using known light source and Raman scattering |
| US7400398B2 (en) * | 2006-05-09 | 2008-07-15 | Environmental Systems Products Holdings Inc. | Remote emissions sensing system and method incorporating spectral matching by data interpolation |
| EP1998155A1 (fr) | 2007-05-30 | 2008-12-03 | Roche Diagnostics GmbH | Procédé destiné à l'étalonnage d'ondes longues d'un spectromètre |
| EP2243009B1 (fr) | 2008-02-12 | 2018-10-10 | Hewlett-Packard Development Company, L.P. | Détecteur de couleur |
| WO2009102328A1 (fr) | 2008-02-13 | 2009-08-20 | Hewlett-Packard Development Company, L.P. | Détecteur de couleur possédant des photodétecteurs échelonnés par zones |
| US20100080351A1 (en) * | 2008-09-26 | 2010-04-01 | i-Nalysis LLC | Handheld spectrometer |
| CN101656537B (zh) * | 2009-07-21 | 2012-04-04 | 中国科学院武汉物理与数学研究所 | 多脉冲干涉Ramsey-CPT条纹的制备方法及装置 |
| US7999933B2 (en) * | 2009-08-14 | 2011-08-16 | Princeton Instruments | Method for calibrating imaging spectrographs |
| CN101650225B (zh) * | 2009-09-16 | 2011-08-17 | 中国科学院安徽光学精密机械研究所 | 一种利用宽可调谐激光的绝对光谱辐亮度响应度定标系统的装置 |
| GB201003939D0 (en) * | 2010-03-09 | 2010-04-21 | Isis Innovation | Multi-spectral scanning system |
| KR101078135B1 (ko) * | 2010-07-30 | 2011-10-28 | 경북대학교 산학협력단 | 광원 스펙트럼 분석용 분광기의 전 영역 교정 장치 및 그 장치에서 정보 획득 방법 |
| US8682704B2 (en) * | 2011-01-03 | 2014-03-25 | Express Scripts, Inc. | Methods and systems for scheduling activity level based meetings |
| US8730466B2 (en) * | 2011-07-14 | 2014-05-20 | Thermo Electron Scientific Instruments Llc | Optical spectrometer with underfilled fiber optic sample interface |
| US10241030B2 (en) * | 2011-12-02 | 2019-03-26 | Schlumberger Technology Corporation | Optical spectrometer and downhole spectrometry method |
| KR101249477B1 (ko) | 2011-12-08 | 2013-04-01 | 한국기초과학지원연구원 | 제동복사 파장을 측정가능한 폴리크로메이터 |
| CN104246477B (zh) * | 2012-03-28 | 2017-04-12 | 横河电机株式会社 | 物质特性测定装置 |
| DE102012217676B4 (de) * | 2012-09-27 | 2016-05-04 | Secopta Gmbh | Verfahren zur Identifikation der Zusammensetzung einer Probe |
| TWI495857B (zh) * | 2012-10-23 | 2015-08-11 | 蘋果公司 | 藉由以分光儀協助之特定設計圖案閉迴路校準之高準確成像色度計 |
| CN103175822B (zh) * | 2013-02-06 | 2015-08-05 | 中国食品药品检定研究院 | 消除拉曼光谱仪台间差的方法 |
| WO2016081916A1 (fr) | 2014-11-21 | 2016-05-26 | The Regents Of The University Of California | Prévision de la distribution tridimensionnelle d'une dose de radiothérapie |
| KR101589619B1 (ko) * | 2014-11-26 | 2016-01-28 | 국방과학연구소 | 스펙트럼 배경물질 신호 제거 방법 |
| US11953427B2 (en) * | 2015-08-03 | 2024-04-09 | Endress+Hauser Optical Analysis, Inc. | Reconstruction of frequency registration for quantitative spectroscopy |
| US10088468B2 (en) * | 2016-02-04 | 2018-10-02 | Nova Biomedical Corporation | Analyte system and method for determining hemoglobin parameters in whole blood |
| WO2017147514A1 (fr) * | 2016-02-26 | 2017-08-31 | The Regents Of The University Of California | Spectrométrie reconstructive à matrice de filtre |
| CN107389660A (zh) * | 2017-09-06 | 2017-11-24 | 北京航峰精诚装备技术有限公司 | 一种便携式油料原子发射光谱分析仪 |
| JP6988512B2 (ja) * | 2018-01-24 | 2022-01-05 | 株式会社リコー | 分光特性取得装置、画像形成装置、画像形成システム |
| DE112020001454T5 (de) | 2019-03-27 | 2021-12-23 | Ams Sensors Singapore Pte. Ltd. | Selbstkalibrierende spektralsensoren module |
| GB2586046B (en) | 2019-07-31 | 2021-12-22 | Thermo Fisher Scient Bremen Gmbh | Peak determination in two-dimensional optical spectra |
| KR102103344B1 (ko) * | 2019-12-03 | 2020-05-29 | 주식회사 다산에스엠 | 광산란 방식 미세먼지 측정시스템 |
| CN111239669A (zh) * | 2020-03-17 | 2020-06-05 | 北京环境特性研究所 | 频谱仪档位相对固定误差标定方法及功率测量方法 |
| GB202006311D0 (en) * | 2020-04-29 | 2020-06-10 | Ge Healthcare Bio Sciences Ab | Method for calibrating an apparatus for measuring the absorbance of light by a substance |
| CN114047149B (zh) * | 2021-11-09 | 2024-04-26 | 宁波市计量测试研究院(宁波新材料检验检测中心) | 一种食品检测中的趋同性风险预警方法 |
| CN120225843A (zh) | 2022-09-14 | 2025-06-27 | 特里纳米克斯股份有限公司 | 用于校准成批光谱仪装置中的光谱仪装置的方法 |
| CN116105854B (zh) * | 2022-12-20 | 2025-09-05 | 武汉颐光科技有限公司 | 一种光学测量设备测量数据的修正方法 |
| CN116007754B (zh) * | 2023-03-24 | 2023-06-02 | 加维纳米(北京)科技有限公司 | 光谱仪标定方法、装置、电子设备和存储介质 |
| KR20250022361A (ko) | 2023-08-08 | 2025-02-17 | 주식회사 액세스나인 | 조립식 계단 |
| CN118936626B (zh) * | 2024-07-30 | 2025-01-24 | 重庆鹰谷光电股份有限公司 | 一种适用于宽温度范围的630nm硅基PIN探测器校准方法和系统 |
| CN118960958B (zh) * | 2024-08-07 | 2025-03-21 | 中国计量科学研究院 | 基于动态时间和纵向缩放的仪器校准方法、系统及装置 |
| CN120446020B (zh) * | 2025-07-07 | 2025-09-16 | 天津中科谱光信息技术有限公司 | 一种水体紫外可见光光谱校准方法和系统 |
Family Cites Families (13)
| Publication number | Priority date | Publication date | Assignee | Title |
|---|---|---|---|---|
| US3646331A (en) * | 1970-09-03 | 1972-02-29 | Kollmorgen Corp | Automatic 100{11 line adjustment of spectrophotometers |
| US3682528A (en) * | 1970-09-10 | 1972-08-08 | Optical Coating Laboratory Inc | Infra-red interference filter |
| US3668406A (en) * | 1970-11-16 | 1972-06-06 | Texas Instruments Inc | Light processing device utilizing beamsplitter having first region reflective from both sides and second region which is transparent |
| US3698814A (en) * | 1971-01-25 | 1972-10-17 | John B Clark | Aberration-free compensator for use in white light interferometry |
| US3734621A (en) * | 1971-12-06 | 1973-05-22 | Hewlett Packard Co | Spectrophotometer utilizing memory storage calibration techniques |
| US4005937A (en) * | 1974-11-26 | 1977-02-01 | Allied Chemical Corporation | Simultaneous interferometric transmission of periodic spectral components |
| US4409512A (en) * | 1979-06-05 | 1983-10-11 | Duro-Test Corporation | Incandescent electric lamp with etalon type transparent heat mirror |
| US4482251A (en) * | 1981-10-19 | 1984-11-13 | Electro-Nucleonics, Inc. | Clinical analyzer |
| US4692883A (en) * | 1985-02-21 | 1987-09-08 | The Perkin-Elmer Corporation | Automatic digital wavelength calibration system for a spectrophotometer |
| FR2588656B1 (fr) * | 1985-10-16 | 1990-02-09 | Bertin & Cie | Appareil de spectro-colorimetrie a fibres optiques |
| US4782492A (en) * | 1986-05-05 | 1988-11-01 | Polaroid Corporation | Thermally controllable optical devices and system |
| US4916645A (en) * | 1988-06-02 | 1990-04-10 | The Perkin-Elmer Corporation | Continuous monochrometer drift compensation of a spectral monochromator |
| EP0463600B1 (fr) * | 1990-06-22 | 1995-12-20 | Matsushita Electric Industrial Co., Ltd. | Méthode de mesurage spectral |
-
1992
- 1992-02-12 US US07/834,448 patent/US5303165A/en not_active Expired - Lifetime
-
1993
- 1993-01-07 EP EP93100106A patent/EP0560006B1/fr not_active Expired - Lifetime
- 1993-01-07 DE DE69315607T patent/DE69315607T2/de not_active Expired - Lifetime
- 1993-01-07 EP EP97250178A patent/EP0800066B1/fr not_active Expired - Lifetime
- 1993-01-07 DE DE69333054T patent/DE69333054T2/de not_active Expired - Lifetime
- 1993-01-15 CA CA002087360A patent/CA2087360C/fr not_active Expired - Fee Related
- 1993-02-12 KR KR1019930001937A patent/KR100264163B1/ko not_active Expired - Fee Related
-
2001
- 2001-12-20 JP JP2001387604A patent/JP3768873B2/ja not_active Expired - Lifetime
Non-Patent Citations (5)
| Title |
|---|
| "Fiber Optics in Astronomy", vol. 3, 1988, ASTRO. SOC. OF THE PACIFIC, pages: 218 - 223 |
| BENJAMIN; TERRY; MOOS: "High spectral resolution, photon counting detector for Doppler temperature measurement in magnetically confined plasmas", REV. SCI. INSTRUM.N, vol. 58, no. 4, 1987, pages 520 - 527 |
| M. LYSAGHT; J. VAN ZEE; J. B. CALLIS: "Laptop Chemistry: A Fiber-Optic, Field Portable, Near-Infrared Spectrometer", REVIEWS OF SCIENTIFIC INSTRUM., vol. 62, no. 2, 1991, pages 507 - 515, XP000219390, DOI: doi:10.1063/1.1142095 |
| S. S. VOGT; R. G. TULL; P. KELTON: "Self-Scanned Photodiode Array: High Performance Operation in High Dispersion Astronomical Spectrophotometry", APPLIED OPTICS, vol. 17, 1978, pages 574 - 592 |
| Y. TALMI; R.W. SIMPSON: "Self-Scanned Photodiode Array: A Multichannel Spectrometric Detector", APPLIED OPTICS, vol. 19, 1980, pages 1401 - 1414, XP000197210, DOI: doi:10.1364/AO.19.001401 |
Cited By (17)
| Publication number | Priority date | Publication date | Assignee | Title |
|---|---|---|---|---|
| EP0692703A1 (fr) * | 1994-07-15 | 1996-01-17 | Unicam Limited | Etallonage en longueurs d'ondes d'un spectromètre optique |
| US5914875A (en) * | 1996-01-11 | 1999-06-22 | Kabushiki Kaisha Toshiba | Method and apparatus for diagnosing plant anomaly |
| EP0834725A3 (fr) * | 1996-10-03 | 1999-06-02 | The Perkin-Elmer Corporation | Analyse de données spectrométriques |
| US6029115A (en) * | 1996-10-03 | 2000-02-22 | Perkin Elmer Llc | Analyzing spectrometric data |
| WO1999064829A1 (fr) * | 1998-06-12 | 1999-12-16 | Varian, Inc. | Procede d'ajustement spectral automatise rapide |
| US6137104A (en) * | 1998-06-12 | 2000-10-24 | Varian, Inc. | Fast automated spectral fitting method |
| AU742485B2 (en) * | 1998-06-12 | 2002-01-03 | Agilent Technologies, Inc. | Fast automated spectral fitting method |
| WO2000071980A1 (fr) * | 1999-05-21 | 2000-11-30 | Bookham Technology Plc | Procede et systeme pour l'interpretation adaptative de donnees spectrometriques, combinee a un reetalonnage continu |
| EP1879684A4 (fr) * | 2005-04-11 | 2009-07-15 | Cerno Bioscience Llc | Analyse de donnees chromatographiques et de spectre de masse |
| EP2780546B1 (fr) * | 2011-11-15 | 2020-02-26 | Halliburton Energy Services Inc. | Commande d'une opération de forage au moyen d'un élément de calcul optique |
| EP2972152A4 (fr) * | 2013-03-15 | 2018-02-14 | P&P Optica Inc. | Appareil et procédé permettant d'optimiser la capture et la correction de données en vue d'une analyse spectroscopique |
| CN103776531A (zh) * | 2014-01-01 | 2014-05-07 | 西安应用光学研究所 | 近红外微弱脉冲光谱辐亮度校准装置 |
| EP3161436A4 (fr) * | 2014-06-27 | 2018-03-07 | Spectral Engines OY | Procédé de détermination d'échelle spectrale d'un spectromètre et appareil |
| CN109211415A (zh) * | 2018-11-20 | 2019-01-15 | 电子科技大学 | 一种基于光源光谱特征波长的波长标定方法 |
| WO2021126077A1 (fr) * | 2019-12-19 | 2021-06-24 | Ams Sensors Singapore Pte. Ltd. | Étalonnage de longueur d'onde de détecteur |
| US12320699B2 (en) | 2019-12-19 | 2025-06-03 | Ams Sensors Singapore Pte. Ltd. | Detector wavelength calibration |
| WO2025147640A1 (fr) * | 2024-01-04 | 2025-07-10 | Nirrin Technologies, Inc. | Systèmes et procédés de référencement de longueur d'onde et d'intensité |
Also Published As
| Publication number | Publication date |
|---|---|
| KR100264163B1 (ko) | 2000-08-16 |
| EP0800066B1 (fr) | 2003-06-18 |
| DE69315607T2 (de) | 1998-04-30 |
| JP2002196130A (ja) | 2002-07-10 |
| EP0800066A3 (fr) | 1998-02-25 |
| JP3768873B2 (ja) | 2006-04-19 |
| CA2087360A1 (fr) | 1993-08-13 |
| JPH0682307A (ja) | 1994-03-22 |
| DE69333054T2 (de) | 2004-04-29 |
| KR930018264A (ko) | 1993-09-21 |
| JP3547771B2 (ja) | 2004-07-28 |
| CA2087360C (fr) | 2005-04-12 |
| US5303165A (en) | 1994-04-12 |
| DE69333054D1 (de) | 2003-07-24 |
| DE69315607D1 (de) | 1998-01-22 |
| EP0560006A3 (en) | 1993-12-15 |
| EP0560006B1 (fr) | 1997-12-10 |
| EP0800066A2 (fr) | 1997-10-08 |
Similar Documents
| Publication | Publication Date | Title |
|---|---|---|
| US5303165A (en) | Standardizing and calibrating a spectrometric instrument | |
| US8352205B2 (en) | Multivariate optical elements for nonlinear calibration | |
| US6029115A (en) | Analyzing spectrometric data | |
| US5991023A (en) | Method of interpreting spectrometric data | |
| US4916645A (en) | Continuous monochrometer drift compensation of a spectral monochromator | |
| US6049762A (en) | Standardizing a spectrometric instrument | |
| JP3378679B2 (ja) | スペクトルにおける散乱放射の補正方法および装置 | |
| CN101813519B (zh) | 光谱仪杂散光校正方法 | |
| CN112710393A (zh) | 光学测定装置、波长校正方法以及标准试样 | |
| CA2111963A1 (fr) | Methode et appareil de caracterisation multivariable de la reponse d'un instrument optique | |
| CA2455136C (fr) | Normalisation et etalonnage d'un appareil spectrometrique | |
| CN105004707B (zh) | Ccd阵列在线拉曼光谱仪谱图标准化方法 | |
| KR101683465B1 (ko) | 다중 선방출원을 이용한 실시간 분광기 보정방법 | |
| JP3547771B6 (ja) | 分光機器の標準化方法および分光機器 | |
| JP4041199B2 (ja) | スペクトル情報を標準化する方法及び装置及び標準化されたスペクトル情報を利用するためのコンピュータ読み取り可能な記憶媒体 | |
| JP2762775B2 (ja) | 分光測定方法 | |
| KR100273009B1 (ko) | 에탈론 구조물 | |
| Milton et al. | Estimating the spectral response function of the CASI-2 | |
| US20070179729A1 (en) | Numerical data processing dedicated to an integrated microspetrometer | |
| CA2237944C (fr) | Methode d'interpretation de donnees spectrales | |
| Park et al. | Slit function measurements of an imaging spectrograph using Fourier transform techniques | |
| Nicodemus | Self-study Manual on Optical Radiation Measurements: Concepts, Chapters 7, 8, and 9 | |
| Drummond et al. | Evaluation of the simulated solar spectrum in the jpl 25-ft space simulator | |
| Underhill | Spectrophotometric Techniques | |
| MXPA96005847A (en) | Raman and met spectrometry apparatus |
Legal Events
| Date | Code | Title | Description |
|---|---|---|---|
| PUAI | Public reference made under article 153(3) epc to a published international application that has entered the european phase |
Free format text: ORIGINAL CODE: 0009012 |
|
| AK | Designated contracting states |
Kind code of ref document: A2 Designated state(s): DE FR GB IT NL |
|
| PUAL | Search report despatched |
Free format text: ORIGINAL CODE: 0009013 |
|
| RHK1 | Main classification (correction) |
Ipc: G01J 3/28 |
|
| AK | Designated contracting states |
Kind code of ref document: A3 Designated state(s): DE FR GB IT NL |
|
| 17P | Request for examination filed |
Effective date: 19940608 |
|
| 17Q | First examination report despatched |
Effective date: 19960625 |
|
| GRAG | Despatch of communication of intention to grant |
Free format text: ORIGINAL CODE: EPIDOS AGRA |
|
| GRAG | Despatch of communication of intention to grant |
Free format text: ORIGINAL CODE: EPIDOS AGRA |
|
| GRAH | Despatch of communication of intention to grant a patent |
Free format text: ORIGINAL CODE: EPIDOS IGRA |
|
| GRAH | Despatch of communication of intention to grant a patent |
Free format text: ORIGINAL CODE: EPIDOS IGRA |
|
| GRAA | (expected) grant |
Free format text: ORIGINAL CODE: 0009210 |
|
| AK | Designated contracting states |
Kind code of ref document: B1 Designated state(s): DE FR GB IT NL |
|
| DX | Miscellaneous (deleted) | ||
| REF | Corresponds to: |
Ref document number: 69315607 Country of ref document: DE Date of ref document: 19980122 |
|
| ITF | It: translation for a ep patent filed | ||
| ET | Fr: translation filed | ||
| PLBE | No opposition filed within time limit |
Free format text: ORIGINAL CODE: 0009261 |
|
| STAA | Information on the status of an ep patent application or granted ep patent |
Free format text: STATUS: NO OPPOSITION FILED WITHIN TIME LIMIT |
|
| 26N | No opposition filed | ||
| REG | Reference to a national code |
Ref country code: GB Ref legal event code: 732E |
|
| PGFP | Annual fee paid to national office [announced via postgrant information from national office to epo] |
Ref country code: NL Payment date: 20001228 Year of fee payment: 9 |
|
| REG | Reference to a national code |
Ref country code: GB Ref legal event code: IF02 |
|
| PG25 | Lapsed in a contracting state [announced via postgrant information from national office to epo] |
Ref country code: NL Free format text: LAPSE BECAUSE OF NON-PAYMENT OF DUE FEES Effective date: 20020801 |
|
| NLV4 | Nl: lapsed or anulled due to non-payment of the annual fee |
Effective date: 20020801 |
|
| PGFP | Annual fee paid to national office [announced via postgrant information from national office to epo] |
Ref country code: FR Payment date: 20120130 Year of fee payment: 20 |
|
| PGFP | Annual fee paid to national office [announced via postgrant information from national office to epo] |
Ref country code: DE Payment date: 20120127 Year of fee payment: 20 |
|
| PGFP | Annual fee paid to national office [announced via postgrant information from national office to epo] |
Ref country code: GB Payment date: 20120126 Year of fee payment: 20 Ref country code: IT Payment date: 20120124 Year of fee payment: 20 |
|
| REG | Reference to a national code |
Ref country code: DE Ref legal event code: R071 Ref document number: 69315607 Country of ref document: DE |
|
| REG | Reference to a national code |
Ref country code: GB Ref legal event code: PE20 Expiry date: 20130106 |
|
| PG25 | Lapsed in a contracting state [announced via postgrant information from national office to epo] |
Ref country code: DE Free format text: LAPSE BECAUSE OF EXPIRATION OF PROTECTION Effective date: 20130108 Ref country code: GB Free format text: LAPSE BECAUSE OF EXPIRATION OF PROTECTION Effective date: 20130106 |