EP0593667B1 - Messung von materialeigenschaften mit optisch induzierten phononen - Google Patents
Messung von materialeigenschaften mit optisch induzierten phononen Download PDFInfo
- Publication number
- EP0593667B1 EP0593667B1 EP92916231A EP92916231A EP0593667B1 EP 0593667 B1 EP0593667 B1 EP 0593667B1 EP 92916231 A EP92916231 A EP 92916231A EP 92916231 A EP92916231 A EP 92916231A EP 0593667 B1 EP0593667 B1 EP 0593667B1
- Authority
- EP
- European Patent Office
- Prior art keywords
- radiation
- sample
- probe
- excitation
- diffraction
- Prior art date
- Legal status (The legal status is an assumption and is not a legal conclusion. Google has not performed a legal analysis and makes no representation as to the accuracy of the status listed.)
- Expired - Lifetime
Links
- 239000000463 material Substances 0.000 title claims description 28
- 238000005259 measurement Methods 0.000 title description 16
- 239000000523 sample Substances 0.000 claims description 261
- 230000005284 excitation Effects 0.000 claims description 118
- 239000000758 substrate Substances 0.000 claims description 77
- 230000005855 radiation Effects 0.000 claims description 61
- 238000000034 method Methods 0.000 claims description 30
- 230000001052 transient effect Effects 0.000 claims description 27
- 230000036962 time dependent Effects 0.000 claims description 19
- 238000001514 detection method Methods 0.000 claims description 11
- 230000000737 periodic effect Effects 0.000 claims description 11
- 238000010438 heat treatment Methods 0.000 claims description 8
- 238000012935 Averaging Methods 0.000 claims description 5
- 239000010408 film Substances 0.000 description 109
- 238000006073 displacement reaction Methods 0.000 description 42
- 238000002474 experimental method Methods 0.000 description 30
- 239000006185 dispersion Substances 0.000 description 27
- 229920000642 polymer Polymers 0.000 description 26
- 229920002160 Celluloid Polymers 0.000 description 23
- 238000004458 analytical method Methods 0.000 description 21
- XUIMIQQOPSSXEZ-UHFFFAOYSA-N Silicon Chemical compound [Si] XUIMIQQOPSSXEZ-UHFFFAOYSA-N 0.000 description 19
- 239000010703 silicon Substances 0.000 description 19
- 229910052710 silicon Inorganic materials 0.000 description 19
- 239000010409 thin film Substances 0.000 description 19
- 230000033001 locomotion Effects 0.000 description 15
- 230000000694 effects Effects 0.000 description 13
- 230000003287 optical effect Effects 0.000 description 13
- 230000004044 response Effects 0.000 description 13
- 238000010521 absorption reaction Methods 0.000 description 12
- 238000002835 absorbance Methods 0.000 description 11
- 230000008901 benefit Effects 0.000 description 10
- 238000009792 diffusion process Methods 0.000 description 10
- 230000006870 function Effects 0.000 description 9
- 230000014509 gene expression Effects 0.000 description 9
- 230000010355 oscillation Effects 0.000 description 9
- 239000011159 matrix material Substances 0.000 description 8
- 230000010287 polarization Effects 0.000 description 8
- 230000001902 propagating effect Effects 0.000 description 8
- 238000004364 calculation method Methods 0.000 description 7
- 230000008859 change Effects 0.000 description 7
- 230000008878 coupling Effects 0.000 description 7
- 238000010168 coupling process Methods 0.000 description 7
- 238000005859 coupling reaction Methods 0.000 description 7
- 239000013078 crystal Substances 0.000 description 7
- 229920001721 polyimide Polymers 0.000 description 7
- 230000002829 reductive effect Effects 0.000 description 7
- 230000002123 temporal effect Effects 0.000 description 7
- 238000013459 approach Methods 0.000 description 6
- 230000007423 decrease Effects 0.000 description 6
- 230000001965 increasing effect Effects 0.000 description 6
- 229920006254 polymer film Polymers 0.000 description 6
- XKRFYHLGVUSROY-UHFFFAOYSA-N argon Substances [Ar] XKRFYHLGVUSROY-UHFFFAOYSA-N 0.000 description 5
- 238000009826 distribution Methods 0.000 description 5
- 239000004642 Polyimide Substances 0.000 description 4
- 229910052786 argon Inorganic materials 0.000 description 4
- -1 argon ion Chemical class 0.000 description 4
- 238000004422 calculation algorithm Methods 0.000 description 4
- 230000003247 decreasing effect Effects 0.000 description 4
- 230000001419 dependent effect Effects 0.000 description 4
- 230000008569 process Effects 0.000 description 4
- 238000001228 spectrum Methods 0.000 description 4
- 230000005540 biological transmission Effects 0.000 description 3
- 230000003111 delayed effect Effects 0.000 description 3
- 238000009501 film coating Methods 0.000 description 3
- 230000007246 mechanism Effects 0.000 description 3
- 238000000862 absorption spectrum Methods 0.000 description 2
- 239000000654 additive Substances 0.000 description 2
- 238000012512 characterization method Methods 0.000 description 2
- 238000013016 damping Methods 0.000 description 2
- 230000005684 electric field Effects 0.000 description 2
- 238000001125 extrusion Methods 0.000 description 2
- 230000010354 integration Effects 0.000 description 2
- 238000004519 manufacturing process Methods 0.000 description 2
- 238000012544 monitoring process Methods 0.000 description 2
- 238000005457 optimization Methods 0.000 description 2
- 238000012545 processing Methods 0.000 description 2
- 238000004445 quantitative analysis Methods 0.000 description 2
- 235000012431 wafers Nutrition 0.000 description 2
- OKTJSMMVPCPJKN-UHFFFAOYSA-N Carbon Chemical compound [C] OKTJSMMVPCPJKN-UHFFFAOYSA-N 0.000 description 1
- 239000004698 Polyethylene Substances 0.000 description 1
- VYPSYNLAJGMNEJ-UHFFFAOYSA-N Silicium dioxide Chemical compound O=[Si]=O VYPSYNLAJGMNEJ-UHFFFAOYSA-N 0.000 description 1
- 230000000996 additive effect Effects 0.000 description 1
- 239000003570 air Substances 0.000 description 1
- 239000003963 antioxidant agent Substances 0.000 description 1
- 235000006708 antioxidants Nutrition 0.000 description 1
- 238000010009 beating Methods 0.000 description 1
- 229910052799 carbon Inorganic materials 0.000 description 1
- 208000007287 cheilitis Diseases 0.000 description 1
- 238000006243 chemical reaction Methods 0.000 description 1
- 238000000576 coating method Methods 0.000 description 1
- 230000000295 complement effect Effects 0.000 description 1
- 230000006835 compression Effects 0.000 description 1
- 238000007906 compression Methods 0.000 description 1
- 229920001577 copolymer Polymers 0.000 description 1
- 238000012937 correction Methods 0.000 description 1
- 238000007405 data analysis Methods 0.000 description 1
- 230000007547 defect Effects 0.000 description 1
- 230000032798 delamination Effects 0.000 description 1
- 230000008021 deposition Effects 0.000 description 1
- 238000009795 derivation Methods 0.000 description 1
- 229910003460 diamond Inorganic materials 0.000 description 1
- 239000010432 diamond Substances 0.000 description 1
- 229920001971 elastomer Polymers 0.000 description 1
- 239000000806 elastomer Substances 0.000 description 1
- 230000005670 electromagnetic radiation Effects 0.000 description 1
- 230000009881 electrostatic interaction Effects 0.000 description 1
- 230000002708 enhancing effect Effects 0.000 description 1
- 238000011156 evaluation Methods 0.000 description 1
- 230000005281 excited state Effects 0.000 description 1
- 239000007888 film coating Substances 0.000 description 1
- 239000005350 fused silica glass Substances 0.000 description 1
- 239000011521 glass Substances 0.000 description 1
- 230000005283 ground state Effects 0.000 description 1
- 229920001519 homopolymer Polymers 0.000 description 1
- 239000001257 hydrogen Substances 0.000 description 1
- 229910052739 hydrogen Inorganic materials 0.000 description 1
- 238000011065 in-situ storage Methods 0.000 description 1
- 230000003993 interaction Effects 0.000 description 1
- 238000004093 laser heating Methods 0.000 description 1
- 230000000670 limiting effect Effects 0.000 description 1
- 239000000314 lubricant Substances 0.000 description 1
- 229920002521 macromolecule Polymers 0.000 description 1
- 238000011326 mechanical measurement Methods 0.000 description 1
- 230000003278 mimic effect Effects 0.000 description 1
- 239000000203 mixture Substances 0.000 description 1
- 230000004048 modification Effects 0.000 description 1
- 238000012986 modification Methods 0.000 description 1
- 238000005442 molecular electronic Methods 0.000 description 1
- 239000000178 monomer Substances 0.000 description 1
- 239000004014 plasticizer Substances 0.000 description 1
- 229920000573 polyethylene Polymers 0.000 description 1
- 238000010094 polymer processing Methods 0.000 description 1
- 229920002635 polyurethane Polymers 0.000 description 1
- 239000004814 polyurethane Substances 0.000 description 1
- 239000011253 protective coating Substances 0.000 description 1
- 230000009467 reduction Effects 0.000 description 1
- 239000013074 reference sample Substances 0.000 description 1
- 238000002310 reflectometry Methods 0.000 description 1
- 230000002040 relaxant effect Effects 0.000 description 1
- 230000000717 retained effect Effects 0.000 description 1
- 238000005070 sampling Methods 0.000 description 1
- 238000004088 simulation Methods 0.000 description 1
- 230000003595 spectral effect Effects 0.000 description 1
- 239000003381 stabilizer Substances 0.000 description 1
- 239000000126 substance Substances 0.000 description 1
- 238000010897 surface acoustic wave method Methods 0.000 description 1
- 229920001169 thermoplastic Polymers 0.000 description 1
- 239000004416 thermosoftening plastic Substances 0.000 description 1
- 230000009466 transformation Effects 0.000 description 1
Images










Classifications
-
- G—PHYSICS
- G01—MEASURING; TESTING
- G01N—INVESTIGATING OR ANALYSING MATERIALS BY DETERMINING THEIR CHEMICAL OR PHYSICAL PROPERTIES
- G01N33/00—Investigating or analysing materials by specific methods not covered by groups G01N1/00 - G01N31/00
- G01N33/44—Resins; Plastics; Rubber; Leather
- G01N33/442—Resins; Plastics
-
- G—PHYSICS
- G01—MEASURING; TESTING
- G01N—INVESTIGATING OR ANALYSING MATERIALS BY DETERMINING THEIR CHEMICAL OR PHYSICAL PROPERTIES
- G01N21/00—Investigating or analysing materials by the use of optical means, i.e. using sub-millimetre waves, infrared, visible or ultraviolet light
- G01N21/62—Systems in which the material investigated is excited whereby it emits light or causes a change in wavelength of the incident light
- G01N21/63—Systems in which the material investigated is excited whereby it emits light or causes a change in wavelength of the incident light optically excited
- G01N21/636—Systems in which the material investigated is excited whereby it emits light or causes a change in wavelength of the incident light optically excited using an arrangement of pump beam and probe beam; using the measurement of optical non-linear properties
-
- G—PHYSICS
- G01—MEASURING; TESTING
- G01N—INVESTIGATING OR ANALYSING MATERIALS BY DETERMINING THEIR CHEMICAL OR PHYSICAL PROPERTIES
- G01N29/00—Investigating or analysing materials by the use of ultrasonic, sonic or infrasonic waves; Visualisation of the interior of objects by transmitting ultrasonic or sonic waves through the object
- G01N29/22—Details, e.g. general constructional or apparatus details
- G01N29/24—Probes
- G01N29/2418—Probes using optoacoustic interaction with the material, e.g. laser radiation, photoacoustics
-
- G—PHYSICS
- G01—MEASURING; TESTING
- G01N—INVESTIGATING OR ANALYSING MATERIALS BY DETERMINING THEIR CHEMICAL OR PHYSICAL PROPERTIES
- G01N21/00—Investigating or analysing materials by the use of optical means, i.e. using sub-millimetre waves, infrared, visible or ultraviolet light
- G01N21/17—Systems in which incident light is modified in accordance with the properties of the material investigated
- G01N21/1702—Systems in which incident light is modified in accordance with the properties of the material investigated with opto-acoustic detection, e.g. for gases or analysing solids
- G01N2021/1706—Systems in which incident light is modified in accordance with the properties of the material investigated with opto-acoustic detection, e.g. for gases or analysing solids in solids
-
- G—PHYSICS
- G01—MEASURING; TESTING
- G01N—INVESTIGATING OR ANALYSING MATERIALS BY DETERMINING THEIR CHEMICAL OR PHYSICAL PROPERTIES
- G01N21/00—Investigating or analysing materials by the use of optical means, i.e. using sub-millimetre waves, infrared, visible or ultraviolet light
- G01N21/84—Systems specially adapted for particular applications
- G01N21/8422—Investigating thin films, e.g. matrix isolation method
-
- G—PHYSICS
- G01—MEASURING; TESTING
- G01N—INVESTIGATING OR ANALYSING MATERIALS BY DETERMINING THEIR CHEMICAL OR PHYSICAL PROPERTIES
- G01N2291/00—Indexing codes associated with group G01N29/00
- G01N2291/04—Wave modes and trajectories
- G01N2291/042—Wave modes
- G01N2291/0422—Shear waves, transverse waves, horizontally polarised waves
-
- G—PHYSICS
- G01—MEASURING; TESTING
- G01N—INVESTIGATING OR ANALYSING MATERIALS BY DETERMINING THEIR CHEMICAL OR PHYSICAL PROPERTIES
- G01N33/00—Investigating or analysing materials by specific methods not covered by groups G01N1/00 - G01N31/00
- G01N33/44—Resins; Plastics; Rubber; Leather
Definitions
- This invention relates to an apparatus for measuring the properties of a sample of material, comprising a first, excitation, source for producing excitation radiation adapted to impinge upon said sample of material, said excitation radiation comprising pulsed radiation composed of at least two component beams which interfere within said ample , each incidence of interference of said excitation radiation being sufficient to induce transient phonons in said material which give rise to a transient, time dependent, diffraction grating, and further comprising a detection system for detecting, by diffraction of radiation, said diffraction grating, said detection system including: a second, probe, source operatively arranged to direct incident probe radiation from the probe source towards said sample, a detector positioned to detect a diffraction signal from said probe source radiation as diffracted by said diffraction grating and an analyzer for analyzing said diffraction signal
- the invention also relates to a method for measuring the properties of a sample of material.
- Laser Induced Phonons are produced by time-coincident laser pulses intersecting inside a sample, setting up on optical interference pattern, i.e. alternating intensity peaks and nulls.
- Energy deposited into the system via optical absorption or stimulated Brillouin scattering results in the launching of counter propagating ultrasonic waves (phonons) whose wavelength and orientation match the interference pattern geometry.
- the mechanism by which LIPS ultrasonic waves are generated depends upon whether the sample is optically absorbing or transparent at the excitation wavelength. If the excitation pulses are absorbed e.g. into high-lying vibronic levels, rapid radiation less relaxation and local heating at the interference maxima (the transient grating peaks) occurs. Thermal expansion then drives the material in phase away from the grating peaks and toward the grating nulls, setting up counter propagating waves.
- optical energy is coupled directly into the sample's acoustic field via stimulated Brillouin scattering. This process takes advantage of the inherent spectral line width in 100 picosecond (psec) excitation pulses. Higher frequency photons from each pulse are annihilated to create lower-frequency photons in the opposite pulse and phonons of the difference frequency and wave vector in the medium. Counter propagating waves (a standing wave) are thus produced.
- the acoustic wave propagation which continues after the excitation pulses leave the sample, causes time-dependent, spatially periodic variations in the material density, and since the sample's optical properties (real and imaginary parts of the index of refraction) are density-dependent, the irradiated region of the sample acts as a Bragg diffraction grating.
- This propagation of the optically excited ultrasonic waves can be optically monitored by time-dependent Bragg diffraction of a variably delayed probe laser pulse.
- the present invention arises from our work seeking to make LIPS (alternatively referred to herein as Impulsive Stimulated Thermal Scattering or ISTS) measurements by reflectance of a probe beam from the sample surface without regard to the absorbance of the probe beam by the sample, and to make such LIPS measurements without regard to sample type or thickness.
- LIPS alternatively referred to herein as Impulsive Stimulated Thermal Scattering or ISTS
- ISTS Impulsive Stimulated Thermal Scattering
- the phenomenon which the present invention exploits is believed to be the inducement of a physical surface morphology or 'ripple' in response to laser excitation.
- the surface ripple phenomenon can be selectively induced based on the nature of the sample, e.g. sample stiffness and thickness and the angle of incidence and wavelengths of the excitation radiation and selectively detected or analyzed by control or monitoring of parameters such as angle of incidence, polarization and intensity of a probe beam reflected from the ripple morphology.
- the discovery enables advantages in terms of the samples that can be analyzed, including ultrathin polymer films, in terms of the rate at which data can be obtained, such as obtaining the full transient signal induced by each excitation laser shot, and in terms of the type and accuracy of data that can be obtained, including more accurate subtraction of probe pulse contribution from the signal and the collection of new data such as acoustic dampings rates (attenuation), thermal conductivity and film delamination.
- excitation of a sample using optically absorbing wavelengths can be used to induce the physical morphology, preferably in the form of a periodic grating on the surface of a sample.
- the grating morphology can be interrogated by reflectance of a probe laser from the surface without regard to the probe laser wavelength and in particular, allowing the use of a probe laser not substantially absorbed by the sample.
- the sample may be of various types.
- a particular example is the analysis of thin polymer films.
- the films which may be UV-absorbing and visible-transmitting, may be excited by UV pulses and interrogated by reflectance with visible pulses.
- this operational mode is particularly advantageous since, with a non-absorbing probe laser, sample heating which can easily damage thin samples, is reduced. It is also an advantage that samples can be interchanged without the need for selecting new probe laser wavelengths.
- acoustic waves may also be excited through impulsive Brillouin scattering in which case the excitation pulses need not be absorbed by the sample.
- LIPS measurements may be made in real time.
- An excitation pulse having a short pulse width compared with the phonon oscillation period may be employed in combination with a high power probe laser having a relatively long pulse width such that a substantial time-portion, in many cases all, of a sample's transient time dependent response from each excitation pulse can be measured.
- a high power probe may be particularly useful in some circumstances, alternatively, we have discovered that signal can be obtained using a relatively low power probe, e.g. about 1 watt, provided by a CW source such as an argon ion laser.
- the probe signal from successive excitation pulses may be signal averaged to increase signal to noise.
- the detection electronics are selected so they have sufficiently fast response times to permit time resolution of the phonon oscillations. Operation in these modes is, again, particularly advantageous for thin, polymer samples since the number of excitation pulses can be reduced and thus the number of heating cycles, which can potentially damage thin, fragile samples can also be reduced.
- a temporal delay between excitation and probe pulses may be varied to interrogate the sample at different time segment stages in its response evolution.
- polymers refers to molecules composed of sequences of repeating monomer units connected by covalent bonds.
- a particular polymer is generally not made up of a single molecular species. Rather, polymers are mixtures of macromolecules with similar structures and molecular weights that exhibit some average characteristic properties.
- the polymers may be homopolymers or copolymers, linear or branched, crosslinked or bonded by electrostatic interaction such as hydrogen bonds.
- the polymers may be elastomers, thermoplastics and may include plasticizers, stabilizers, anti-oxidants and lubricants.
- Polymers may be crystalline in the sense that long segments of linear polymer chains are oriented in a regular manner with respect to one another. Such crystalline regions of a polymer are referred to as crystallites. Amorphous, non crystalline regions generally lie between the crystallites and constitute defects in the crystalline structure.
- sample such as a polymer may include additives, e.g. chromophores incorporated within the polymer mass (typically non covalently bonded) for enhancing absorbance of the sample at a particular wavelength such as a desired excitation or probe wavelength.
- additives e.g. chromophores incorporated within the polymer mass (typically non covalently bonded) for enhancing absorbance of the sample at a particular wavelength such as a desired excitation or probe wavelength.
- a “pure sample” as used herein contains no such additive.
- absorption includes absorption of electromagnetic radiation by ground or excited states of the sample molecule.
- Particular aspects of the invention use LIPS in the reflectance mode where the absorbance of the probe is less than the absorbance of the excitation. Particularly the probe absorbance is 50%, 10% or even 1% or less than the excitation absorbance. In some cases, no absorbance of the probe beam by the sample can be detected.
- Molar absorptivities (E) at the probe wavelength may be less than 1000 or 100. Absorption may be less than about 10%of the maximum absorption (which may be relative to the complete absorbance) in a wavelength region (e.g., UV, visible, infrared), typically less than 1%.
- the excitation wavelength is selected such that the absorbance is sufficient to give rise to a periodic morphology on the sample surface, detectable as a diffraction signal.
- an apparatus as defined in the opening paragraph is provided , which apparatus is characterized in that the detection system is adapted operatively to detect a transient, time dependent, periodic ripple morphology of alternating peaks and valleys an a surface of said sample, the ripple morphology forming said diffraction grating, that the probe source is operatively arranged to direct incident probe radiation at an angle of incidence towards said surface and in that the detector is operatively arranged to detect a diffraction signal reflected by said surface and formed by said transient ripple morphology.
- a second aspect of the invention relates to a method for measuring the properties of a sample of material, comprising the steps of: impinging a pulse of excitation radiation on said sample, said excitation radiation being composed of at least two component beams which interfere within said sample, the component beams being selected such that each incidence of interference is sufficient to induce transient phonons in said sample which give rise to a transient, time dependent, diffraction grating, detecting said diffraction grating by diffraction of radiation by directing incident probe radiation towards said sample and detecting a diffracted signal diffracted by said diffraction grating and analyzing said diffraction grating by analyzing said detected diffracted signal to measure properties of the sample
- the step of impinging a pulse of radiation comprises directing the incident probe radiation at an angle of incidence on said surface
- the step of detecting comprises detecting a transient, time dependent, ripple morphology of alternating peaks and valleys on a surface of said sample, said ripple
- the radiation from the probe source is absorbed about 50%, 10% or 1% or less than the radiation from the excitation source or there is no detectable or substantial absorbance by the sample at the probe wavelength.
- the excitation source of radiation is in the ultraviolet.
- the probe source is in the visible.
- the sample is a thin sample, e.g., on the order of about 500, 30 or 10 ⁇ or less, and the excitation radiation is absorbed by the sample.
- the sample is a thin polymeric film.
- the film is a free-standing film or disposed on a support.
- the probe radiation is diffracted from the surface of the sample.
- the probe beam and detector are for detecting a substantial time portion of the time-dependent diffraction signal, induced by each excitation pulse such as the entire detectable time-dependent diffraction induced by each excitation pulse.
- the probe radiation is of a selected pulse width and the detector is adapted to detect the time dependent diffraction for the duration of the probe pulse.
- the excitation pulse width is on the order of psec duration and the probe pulse width is on the order of nanosecond (nsec) duration (e.g. generally greater than 10 nsec, e.g. around 100 nsec).
- the detector has a time resolution on the order of 1 nsec.
- a signal averaging means is provided for signal averaging the diffracted radiation from multiple excitation pulses.
- the probe pulse has a peak power output (power during the laser on-time) of about 1000 watts or greater, such as around 10,000 watts.
- the probe laser is a Q-switched YAG laser.
- the excitation pulse is generated from a pulsed laser and the probe pulse can be generated from a CW laser having for example a laser power output of around 1 watt, such as a gated argon ion laser.
- the polymer sample is a pure polymer sample.
- the diffraction signal is analyzed to selectively analyze diffraction from surface ripple.
- the analyzer includes a polarizer for determining change of polarization of the probe beam after diffraction to selectively analyze diffraction from the surface morphology.
- the analyzer may also be for analyzing the signal as a function of wavevector to selectively analyze diffraction signal from the ripple morphology.
- the angle of incidence of the probe beam and/or the excitation beam or the wavelength of the excitation beam may be varied to optimize diffraction from the ripple morphology.
- the diffraction signal is produced by reflection of the probe beam from the back surface of a sample, opposite the radiation sources or the front surface or both.
- the system is adapted for determining adhesion and/or thermal diffusion of the polymer sample on a substrate surface from the diffraction signal.
- ISTS experiments with real-time data acquisition rates are possible and can be applied to studying the pseudo-Rayleigh acoustic modes that propagate in thin film coatings.
- Real-time data acquisition can be crucial in avoiding optical damage to polymer films.
- the diffracted ISTS signal arises predominantly from corrugation or ripple displacements at the film surface and the film/substrate ripple due to the propagating pseudo-Rayleigh modes.
- the relative contribution of each acoustic mode to the ISTS signal depends on the efficiency with which each mode is excited by the excitation pulses and on the efficiency with which each mode diffracts the probe beam due to surface and interface ripple.
- a formalism is developed to quantify both of these factors. Using this formalism a method for extracting the elastic constants of the film by analyzing the dispersion of the pseudo-Rayleigh modes is described and applied to the polyimide/silicon system.
- the techniques have wide applications in nondestructive, real-time characterization of thin films. For many applications, such as monitoring thin-film fabrication and cure or determination of the spatial uniformity of coatings, it is not necessary to determine elastic moduli but merely to monitor changes in acoustic frequency. Finally, characterization of thermal diffusion rates will present a similar range of applications in polymeric, diamond, and other thin films. Other types of materials can be studied, for example, single crystal Fe films and amorphous, plasma deposited carbon films.
- the invention includes methods of use of the techniques described.
- a sample 2 typically a thin T 1 , e.g. 5 ⁇ m thick or less, polymer thin film is provided having a front exposed surface 3 and a back surface 5 which is disposed on a substrate 6.
- the sample is excited by impinging a pair of excitation beams 7,9 from sources E 1 , E 2 .
- the wavelength of radiation from E 1 and E 2 is selected such that it is absorbed by the sample.
- the beams 7,9 interfere within an overlap region 11 within the bulk of the sample, causing rapid local heating in a periodic fashion.
- a periodic ripple-like morphology 13 is generated at the surface 3.
- the morphology has a peak to trough height, H, that is at a maximum soon after absorption of the excitation wavelengths and then oscillates and decays with time.
- maximum heights H are estimated on the order of 5-10 nanometer (nm).
- the morphology 13 may be interrogated by a probe laser pulse 15, from a source P 1 , by diffraction of the pulse in the reflection mode from the surface 3.
- the diffracted beam 15' is detected by a detector D, positioned on the same side of the sample as the source P 1 .
- the angle of incidence of the probe, ⁇ i , and angle of diffraction ⁇ r may be varied and selected based on the spacing of the periodic morphology.
- the source P 1 is preferably selected such that the wavelength of the probe pulse is not substantially absorbed by the sample.
- a component 15'' of the beam 15 may be transmitted through the sample.
- the pulse 15 is typically selected such that its duration is long compared to the excitation pulse and the lifetime of the periodic morphology.
- the pulse may be from a pulsed probe laser of selected pulse width and energy or a continuous wave laser, for example.
- the detector is adapted to receive the signal pulse 15', which is the diffracted beam component from the sample surface, for analyzing the characteristics of the morphology over the course of its existence from each excitation. As illustrated in Fig. 1c, after analysis, the sample 2 returns to its original state.
- the excitation wavelength is preferably in the ultraviolet (about 100-400nm), but may be, e.g., in the visible (about 410-800nm), infrared (about 0.1-50 ⁇ ) or beyond.
- the probe is preferably in the visible, but maybe in other regions, e.g. infrared or ultraviolet, depending on sample absorbance.
- the excitation and probe radiation may be in the same wavelength region.
- An advantage of the invention is that the sample may be probed with a laser wavelength independent of the sample absorption; greater flexibility is provided in the choice of the probe laser.
- analysis times can be reduced by employing a probe pulse width as long as the transient decay of the induced phonons, so that the entire morphology decay is detected from each excitation.
- a particular advantage is the analysis of thin films, especially thin polymer films, e.g. 10 ⁇ m thickness or less, or even 1 ⁇ m thickness or less.
- Typical polymer samples include visible wavelength transmitting polymers such as polyethylene, polyurethane and polyimides.
- Polymer films which may be analyzed include molecular films such as Langmuir-Blodgett films or biological films. The films analyzed may be supported on a substrate or may be freestanding films. In the case of films on a substrate, the support provides both mechanical rigidity and can reduce sample damage when the support acts as a heat sink.
- Sample supports include silicon or glass.
- Applications for the system include analysis of polymer protective coatings on silicon substrates and various applications to polymers in polymer processing, including in-situ processing during e.g.
- the analysis may be carried out at various points in the extruder to determine the progress of the operation and to modify the extrusion in response to the data obtained.
- Other polymer applications include polymer curing and polymer loading (analysis of properties under mechanical load).
- the properties that can be measured by analysis of the raw data include acoustic speeds, determined from the frequency of surface oscillations; attenuation rates determined from decay of the signal; thermal expansion and thermal diffusion rates; thermal expansion coefficients and heat capacities can be determined from signal intensities cases where standard samples are run; compressibility and elastic modulus may be determined from acoustic speed and sample thickness frequency dependencies.
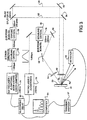
- the pulse width is on the order of picoseconds, in this example 100 psec.
- the beam is modified by crystals, 26,28 for frequency doubling and tripling to produce an excitation beam wavelength in the ultraviolet at about 355 nanometers. Another preferred wavelength is about 266 nanometers.
- the beam from the laser is split by a beam splitter 30 into component beams 32, 34 which are directed by reflecting optics 36, 38 toward a focusing element 40 (about 30 cm focal length cylindrical focus) which focuses component beams 32, 34 such that they overlap in time and location within the sample 20.
- the spot size on the sample is selected to avoid excessive heating and damage therefrom, e.g., the spot size may be 100 microns to 1 millimeter with an energy of about 10 ⁇ J. In this example, the spot size was about 100 ⁇ m high and 2 mm wide (cylindrical focus).
- the probe laser 42 is a YAG laser for probing the surface morphology by reflectance.
- the output beam from the laser 42 passes through a Pockel's cell 44 to isolate a particular pulse with an energy of, for example, about 50 microjoules.
- the probe beam is passed through a doubling crystal 46 to produce a probe pulse 48 having a wavelength generally not absorbed by the sample 20 such as a probe pulse in the visible range, e.g. 532 nm, as in this example.
- the probe pulse 48 is directed to the sample by optical reflectors 50, 52 and focused by focusing element 54 (about 20 cm focal length) such that the beam impinges upon the sample surface at angle ⁇ I about 45° from normal to the unperturbed sample surface.
- Diffracted beams 56 arising from the morphology at the sample surface, may be detected at angle ⁇ R about 45°, by a detector 58 such as an amplified photodiode.
- the pulses from the excitation laser 24 and probe laser 42 are electronically delayed to probe the surface morphology as a function of time.
- a delay control 60 times the sequential pulses of the lasers.
- the excitation laser pulses at about 1 kilohertz.
- the probe laser pulses at delay times (from the excitation pulse) varying from the nanosecond range to 40 microseconds or more, depending on the properties of the sample to be determined.
- the probe pulse width is short relative to the period of the phonon oscillations so that each probe pulse thus represents a single measurement of the instantaneous diffraction signal.
- the signal detected by the detector 58 is filtered via a lock-in amplifier 62 and passed to an analysis means 64, e.g., a microprocessor, which also receives the pulse delay information and which converts the raw data via Fourier transform to a spectrum of intensity versus frequency.
- FIG. 2a an absorbance spectrum of a thin film of Pyralin® is shown. At the excitation wavelength of 355 nm, the material is highly absorbing. At the probe wavelength of 532 nm, on the other hand, radiation is not substantially absorbed.
- the raw LIPS data for the thin Pyralin® sample is shown as a plot of the intensity versus time, being the delay between the excitation beam pulse and the probe beam pulse.
- the processed data is shown after compilation with the Fast Fourier Transform algorithm (FFT). The analysis time for this measurement was about 10 minutes using about 150,000 excitation and probe pulses. The data may be analyzed to yield material properties as described above.
- FFT Fast Fourier Transform algorithm
- a probe laser 70 is adapted to provide a probe beam having a relatively long pulse width such that a substantial time-portion of the transient grating can be measured from each excitation pulse.
- the probe pulse is typically of longer duration than the excitation probe pulse and may be as long or longer than the detectable diffraction signal from the sample surface.
- like numbers refer to the same elements as described in Example 1, Fig. 2.
- the probe laser 70 may be a YAG laser operated in the Q-switch mode with energy of about 3 millijoules in a pulse width of about 300 nanoseconds. (The peak power, therefore, was on the order of 10,000 watts.
- the probe laser beam 76 impinges upon the sample surface simultaneously with the excitation beams and the full time dependent response from each excitation pulse is recorded. (If signal persists after 300 ns, the probe pulse can be delayed as discussed in Example 1.)
- the detector 72 is a fast response (370 psec) amplified photodiode (model ARX-SA, Antel Optronics, Inc., 3325B Mainway, Burlington, Ontario, CANADA).
- the signal is received by a transient digitizer 74 with a 1 GHz bandwidth (digital signal analyzer model 602, Tektronix, Inc., P.O. Box 500, Beaverton, OR 97077).
- the 1 GHz bandwidth and fast photodetector provide about 1 nsec time resolution, so that acoustic waves of up to 1 GHz frequency can be time resolved.
- the detector and electronics are generally selected to be as fast as the sample response of interest.
- a polarizer thin film is preferably positioned between lens 54 and the sample.
- Fig. 3a a plot of raw data the transient signal from a single excitation pulse is shown.
- An advantage of operation in this mode is that, rather than probe a single time point of the transient morphology as in the embodiment of Fig. 2, the diffraction signal from the full duration of the transient morphology produced by each excitation pulse is detected. The time required for signal detection is therefore considerably reduced.
- Fig. 3a also illustrates the probe pulse profile (which can be subtracted from the raw data prior to processing).
- Fig. 3b the processed data (without subtraction of the probe pulse profile) is shown. This data was collected in about 15 seconds, using about 500 excitation shots, the signals from which were collected and signal averaged.
- Pyralin films of various thicknesses have been studied, e.g. from about 0.92 to 5.81 micron (spin coated on a 330 micron thick silicon wafer with thickness determined within ⁇ 0.05 micron by mechanical stylus profilometer).
- the oscillations in the data are due to acoustic oscillations initiated by the crossed excitation pulses.
- the signal intensity depends on the induced time-dependent material displacements (which are described in more detail in the sections that follow), weighted by the probe pulse intensity envelop which is shown in Fig. 3b.
- the first part ( ⁇ 85 ns) of the probe pulse arrive at the sample before the excitation pulse, so there is no signal other than that due to parasitically scattered probe light.
- the excitation pulses heat the sample and initiate acoustic oscillations which are observed in the data. There is also a nonoscillatory component of the signal due to steady-state thermal expansion in the heated regions of the sample.
- the frequency of the surface acoustic wave can be extracted.
- the acoustic response is dominated by one mode with a frequency of 113 ⁇ 2 MHz.
- the dc component of the transform (not shown) is 30 times larger than the acoustic peak.
- Fig. 3d the Fourier transform of diffracted signal is shown taken under identical conditions as the data in Fig. 3a, but with only one laser shot, i.e., no averaging. While this spectrum is noisier than the spectrum of the averaged data, the position of the main peak is identical. (The extra noise seen in Fig. 3d is believed to be due to self-modelocking within the one Q-switched probe pulse.)
- the data clearly illustrates the ability to perform true one-laser shot experiments. Best results can be obtained with a smooth probe pulse temporal profile.
- ISTS raw data and its Fourier transform are shown respectively for the same sample at a larger scattering wavevector. It can clearly be seen that there are at least two surface acoustic modes which contribute to the signal.
- a further embodiment employs a continuous wave probe pulse from, e.g., a CW argon laser generating a CW beam of known duration in place of the YAG laser in Example 2.
- the probe laser wavelength may be in the visible, 514 nm, and probe pulse width controlled by an EO modulator (in place of the doubling crystal shown in Fig. 3). (No electronic delay is necessary for the CW experiments.)
- This embodiment similar to that of Example 2, allows the transient response from each excitation shot to be completely detected. In this method the probe beam has a time-independent profile, thus enabling reduction in noise contribution when subtracting the probe beam profile from the detected signal.
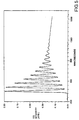
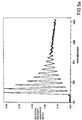
- raw data from an unsupported polyimide film using a YAG laser excitation source at ⁇ 266 nm, 100 psec (a quadrupling crystal is used in place of tripling crystal 28) and a gated (500 ⁇ sec) small frame argon ion CW probe (about 50 - 100 micron beam size, with single line power of about 1 watt) is illustrated for 200 signal averaged excitation shots and a single excitation shot, respectively.
- a Q-polarizer was placed before the EO gate.
- An advantage of the gated CW probe is that thermal process which occur on timescales larger than acoustic processes can be efficiently monitored. Likewise, the long temporal widths available with the CW probe allows the entirety of the sample acoustic profile to be detected. In addition, by including frequency dependent loss modulus, the experiments can account for acoustic dampings. Referring to Fig. 6, a thermal decay curve of the polyimide sample over a microsecond time scale is shown. Similar data can be obtained from a single excitation shot.
- the angles used in this study are 0.48°, 0.68°, 0.72°, 0.92°, 1.07°, 1.17°, 1.62° 1,67°, 1.77°, 1.93°, 2.37°, 3.40°, 3.92°, and 5.85°. (These angles may be measured mechanically using a calibrated rotation stage and are accurate to +-0.05°.)
- the corresponding scattering wavevectors according to (a) are 0.15, 0.21, 0.22, 0.28, 0.33, 0.36, 0.50, 0.52, 0.55, 0.60, 0.73, 1.05, 1.21, and 1.81 inverse microns. These are accurate to ⁇ 0.01 inverse microns.
- the wavevectors were chose to lie along a crystal axis of the silicon substrate. However, experiments performed with a wavevector magnitude of 0.52 ⁇ m -1 on a 5.81 ⁇ m Pyralin film sample showed no dependence on wavevector direction.
- An order of magnitude estimate can be made for the surface ripple generated in an ISTS experiment by calculating the magnitude of the temperature grating set up by the excitation laser pulses and then relating this to a displacement amplitude using the linear thermal expansion coefficient.
- A 1 ⁇ C P a (1-R)I E ⁇ e - ⁇ h
- 2.303 ⁇ is the material absorption coefficient
- I E is the total energy per unit area of the excitation laser pulses
- ⁇ is the mass density
- C is the heat capacity per unit mass
- R is the reflectivity for the material/air interface
- P a is the fraction of absorbed light that is converted to heat.
- This temperature change can be related to the change in the y-direction length of a volume element ⁇ L y (y,z) using the linear thermal expansion coefficient ⁇ T as in eq. (4).
- ⁇ L y (y,z) ⁇ T ⁇ T(y,z)dy
- the total surface ripple R rip (z) can be found by integrating this expression over the sample thickness.
- the integration extends only over the thickness of the film. Performing this integration leads to eq. (5).
- the dispersion of ⁇ (q) for the various modes is to be understood.
- the frequency depends only on the product qh, where h is the film thickness, so that the results of measurements on films of different thickness can be compared.
- the ISTS excitation efficiencies and the probe diffraction efficiencies for each of the modes are to be determined.
- the ISTS signal expected from a supported film is derived below treating the excitation then the probing process.
- An isotropic theory is used since no effects of the elastic anisotropy of silicon or the film were observed.
- u is a vector describing the material displacements
- T is the fluctuation in temperature relative to the equilibrium temperature
- ⁇ is the equilibrium density
- ⁇ is the thermal conductivity
- ⁇ ⁇ T o / ⁇
- C s is the constant strain specific heat per unit mass.
- Q represents the absorbed heat per unit time per unit volume derived from the excitation laser pulses.
- the film/substrate system geometry is depicted in Fig. 7.
- H is considered infinite so that the substrate fills the whole y>0 half space.
- the first step in solving equations (9)-(11) is to determine the temperature distribution set up by the excitation pulses.
- the dynamics of thermal diffusion take place on a much longer timescale than the acoustic dynamics.
- ⁇ can be set to zero in eq. (9).
- the excitation laser pulse duration is short compared to the acoustic oscillation period.
- conversion of optical energy to heat through molecular electronic and vibrational relaxation also occurs on a fast time scale relative to the acoustic oscillation period so that the time dependence of Q in eq. (9) can be approximated by a delta-function at zero time.
- Equation (9) is solved for the temperature distribution set up by the laser excitation beams to yield eq. (12).
- equations (10) and (11) can be solved using transform techniques. Since the temperature distribution is independent of x, all derivatives with respect to x are neglected. From the geometry of the system and the nature of the temperature distribution given in (12), a Laplace transform for the time variable and exponential Fourier transform for the z coordinate are the natural choices. (Notation is such that S is the Laplace variable conjugate to t and k is the Fourier variable conjugate to z.) The transformed solutions for the potentials ⁇ and ⁇ are then found to be, where k is the Fourier transform variable conjugate to z and s is the Laplace variable conjugate to time.
- v Lf, v Tf, v Ls, and v Ts are the bulk longitudinal and transverse velocities in the film and substrate respectively.
- all but the third term in the expression for the longitudinal potential in the film are homogeneous solutions to the equations of motion. This third term is the particular solution of equation (10) and can be thought of as driving the motion of the film and giving rise to a response consisting of a longitudinal disturbance propagating along z, a periodic stress pulse propagating along y, and a dc response.
- the variables A ⁇ (k,s), B ⁇ (k,s), D ⁇ (k,s) etc. are potential constants which are determined by imposing the necessary boundary conditions and physical realizability requirements.
- the terms involving C ⁇ (k,s) and C ⁇ (k,s) represent physically unreasonable solutions. For this reason, they are set to zero.
- the stress tensor is calculated using the Duhamel-Neumann relation shown in eq. (15) in order to properly take into account the contribution from the temperature grating.
- Equation (8), (15) and (12)-(14) the boundary conditions can be imposed.
- the first two rows of the matrix equation ensure that the yy and the yz components of the stress respectively are zero at the surface of the film.
- FIG. 8 An example of typical dispersion curves for the substrate loading case (ie. v Ts > v Tf) is shown for the lowest 16 modes in Fig. 8. As qh approaches zero only one mode, whose velocity approaches only one mode whose velocity approaches that of the substrate pure Rayleigh mode v Rs, exists. At large qh, this lowest mode approaches the pure Rayleigh surface mode of the film with velocity v Rf. Each of the higher velocity modes, often called Sezawa modes, has a limiting qh value below it does not propagate. At this qh value, the velocity of each mode is equal to the substrate transverse velocity v Ts. As shown in Fig. 8, as qh is increased, these modes all asymptotically approach the film transverse velocity.
- I o the intensity of the probe measured in medium 1
- k i the wavevector of the probe measured in vacuum.
- ⁇ i is the angle of the probe relative to the corrugated interface
- a is the unit vector representing the polarization of the probe
- r is the reflection coefficient for transmission from medium 1 to medium 2
- R o is the distance from the point at which the diffraction is generated to the detector.
- q is the wavevector of the corrugation
- ⁇ (t) is the time dependent amplitude of the corrugation.
- the upper signs refer to the +1 diffracted order, while the lower signs refer to -1 diffracted order.
- Fig. 9 For a thin supported film, there are four sources of first order ripple diffraction which must be considered. These are shown schematically in Fig. 9. Parts A and B of this figure represent the probe and diffracted beam paths for the two final signal directions seen experimentally. The first three paths show the components involving diffraction from the film surface ripple. The fourth path describes the component arising from diffraction from the interface ripple. In general, all four components contribute to the diffracted signal in the two signal directions.
- the electric fields at the detector associated with these four diffraction contributions can be obtained using eqs. (29-30), Snell's Law, and taking into account reflective losses at the film-air interface. In the following, it is assumed that all light striking the film-substrate interface is reflected. In addition, due to the spatial size of the probe pulse, the thickness of the film, the index of refraction of the film, the wavevector of the corrugation, and the angle of incidence, it is a good approximation to assume that all of the diffracted beams give in Fig. 9a or 9b emerge from the same point on the film and travel parallel to one another. The results, written in terms of sums over pseudo-Rayleigh mode amplitudes, are shown in the following equations.
- the signal intensity can be written as the square of the sum of the four electric fields given in eqs. (31-34).
- the resulting intensity will exhibit varying interference effects depending on the probing angle and wavelength, the index of refraction and thickness of the film, and the grating excitation wavevector.
- the only important interference occurs between the E-fields derived from the surface ripple (E 1 -E 3 ) and the field derived from the interface ripple (E 4 ).
- Such interference can cause a mode with a large surface corrugation amplitude to only appear as a weak Fourier component in the experimentally measured diffraction signal and vice-versa.
- the final ISTS intensity (I) can be written in a manner which emphasizes this effect as where F and G are functions determined by summing terms in equations (31-34). This expression was obtained by averaging over an optical cycle with the assumption that acoustic terms are constant over this interval. It can be seen that, in general, the measured signal consists of a dc term, a series of heterodyned components oscillating at the pseudo-Rayleigh mode frequencies which arise from a beating against the dc term, and terms oscillating at sums and differences of the normal mode frequencies.
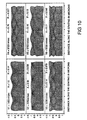
- This figure shows material displacements for the first eight modes that exist at this value of qh.
- the surface ripple amplitude relative to the maximum amplitude for each mode is given by R.
- Modes with large values of the produce AR contribute most to ISTS signal.
- Fig. 10 illustrates bulk and surface ripple amplitudes for a single value of wavevector q, given the film thickness h.
- Fig. 11 is a three-dimensional plot showing the calculated film surface ripple (the product AR) excited through ISTS as a function of qh and velocity for the various modes in 1 ⁇ m film.
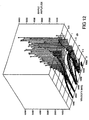
- Fig. 12 displays the analogous results for the interface ripple.
- the x-y plane of these figures shows the mode velocity dispersion as in Fig. 8, while the z axis shows the relative ripple displacements for a given energy density of the ISTS excitation pulses. Note that since the displacements associated with each pseudo-Rayleigh mode are different, the relative ripple displacements for the film surface and the film - substrate interface are also different.
- each pseudo-Rayleigh mode can be calculated using eq. (16) and the ripple information contained in Figs. (11-12).
- the resulting mode intensity ratios can then be compared to the ratios found in the raw ISTS data for each value of qh and h.
- the interface displacements are not negligibly small compared to the surface displacements, interference effects between these two contributions to diffracted signal become important so that with different experimental conditions - such as probe angle of incidence or film thickness - ISTS data can show vastly different mode intensity ratios (cf. eq. 35).
- the dc term dominates the ISTS signal for these experiments.
- the power in the zero-frequency peak of the Fourier transforms ranged from 30 to 200 times greater than the acoustic peaks.
- the heterodyne terms in equation (35) dominate and the frequencies of the most intense Fourier peaks will correspond to the fundamental pseudo-Rayleigh mode frequencies ⁇ j .
- the relative intensities of the two lowest modes can be compared to the film surface displacements of Fig. 11 for qh>0.5.
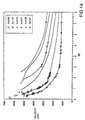
- Fig. 14 shows that at least one of these two modes is present for all the samples.
- the second lowest mode should dominate from qh- ⁇ 0.5 to qh ⁇ 1.5 while at higher qh values, i.e. above the crossover discussed earlier, the lowest mode should have a higher intensity.
- this qualitative behavior definitely obtains since, for all the samples, the density of observed data points is much higher for the second mode than for the first qh values less than the crossover, while at higher qh values the only observed data points correspond to the first mode.
- Polyimide films can exhibit variation in the degree of chain orientation and in density as a function of depth. These measurements yield values which are averaged over the film thickness and so do not provide direct information about depth dependences. Measurements of thinner films may yield different parameters, indicative of differences in film properties very close to the substrate surface. By tilting the grating wavevector so that it has a component perpendicular to the film, it is possible to determine separate in-plane and out-of-plane elastic moduli. The theoretical treatment outlined here could be generalized to take this into account.
- the first parameter is easily determined in the ISTS experiment.
- the indices of refraction and film thickness can be measured by other techniques, or treated as free parameters in a fitting scheme.
- the elastic parameters may be extracted using data from only one qh value at which multiple modes are observed, by fitting both the pseudo-Rayleigh mode velocities and relative intensities. With efficient computing algorithms to accomplish fitting, the elastic parameters may be extracted with the same real-time rates demonstrated for the data acquisition. Generally, the experiment can be optimized with an improved probe pulse temporal profile.
- the film and substrate were modeled such that together they form an acoustic waveguide and together determine the frequencies of the acoustic waveguide modes that propagate in the film-substrate system.
- Figs. 16 and 16a comparing the dispersion curves for a tightly bound film-substrate system with a system in which the substrate is removed (which would be equivalent to a film-substrate system with a substrate that has a very low stiffness) it is seen that the waveguide frequencies change dramatically. These changes can be used to detect regions where the film has become debound from the substrate by sampling the film at various locations.
- the degree of film substrate adhesion can be determined. For example, the absence of a substrate is equivalent to the case where the film is no longer stuck to the substrate. If the film is slightly stuck but not tightly bound, the acoustic waveguide frequencies are intermediate between the case where the substrate is present and where it is removed. By measuring the actual positions of the frequencies, the degree of adhesion can be determined.
- two parameters are introduced (k z , k y , further discussed below). One is a spring stiffness parameter per unit area for motions parallel to the plane of the film (k z ). The other is a spring stiffness parameter per unit area for motions perpendicular to the film (k y ).
- Q represents the heat source
- K is the thermal conductivity
- C is the heat capacity per unit mass
- ⁇ is the density
- heat flow occurs within the film and out of the film into the air and substrate.
- the heat flow out of the film obeys Newton's laws of heat propagation (i.e. heat flow is proportional to the temperature gradient leaving the following boundary conditions on heat flow:
- the displacements are related to the temperature as follows: where ⁇ T is the coefficient of thermal expansion and ⁇ is the displacement.
- the temporal dependence of ⁇ is determined by the temporal dependence of T.
- the signal is a sum of exponentials with the same decay rate in equation (46).
- the different decay rates can be extracted with a linear prediction routine. With the rates determined in this manner, comparison can be made to theory to determine: by changing q and d, then, predictions can be made for the form of the experimental decay. In this way, equation (51) can be compared to experimental values to determine the accuracy of the calculated values.
- the invention enables many embodiments and advantages. While the experiments may be carried out on thin films to particular advantage as discussed above where surface ripple is the predominant phenomenon leading to diffraction of the probe, the ripple effect may also be induced on thicker samples.
- the experiment can be optimized to selectively analyze diffraction from ripple over diffraction from bulk, refractive index modification.
- the ripple effect can be preferentially detected by maximizing the amount of reflected light by increasing the incident angle of the probe beam.
- the optimum incident angle may be determined based on sample thickness and the refractive index to enable a large incident angle while avoiding substantial losses due to total internal refraction.
- the detection of diffraction from the ripple effect can also be optimized on freestanding samples by detection of transmitted and reflected probe radiation and subtracting the former, which contains bulk-properties information, from the latter, which contains ripple information.
- ripple information can also be detected by study of the polarization of the diffracted beam.
- a polarizer can be positioned after the probe focusing optic (e.g. optic 54) and another polarizer positioned before the detector (e.g. detector 58). As discussed above bulk properties vary the incident polarization.
- the polarization can be studied as a function of incident angle to determine the optimum angle for detecting ripple induced diffraction.
- the excitation radiation can be optimized to enhance the diffraction signal arising from ripple.
- the wavevector dependence of the signal can be studied (e.g. with a computer) to determine that the diffraction signal is predominately from ripple.
- a smaller excitation wavevector longer excitation wavelength or smaller angle of incidence of the excitation beams
Landscapes
- Physics & Mathematics (AREA)
- Health & Medical Sciences (AREA)
- Life Sciences & Earth Sciences (AREA)
- Chemical & Material Sciences (AREA)
- Pathology (AREA)
- Immunology (AREA)
- General Physics & Mathematics (AREA)
- Analytical Chemistry (AREA)
- Biochemistry (AREA)
- General Health & Medical Sciences (AREA)
- Optics & Photonics (AREA)
- Food Science & Technology (AREA)
- Medicinal Chemistry (AREA)
- Engineering & Computer Science (AREA)
- Nonlinear Science (AREA)
- Nuclear Medicine, Radiotherapy & Molecular Imaging (AREA)
- Investigating Or Analysing Materials By Optical Means (AREA)
- Investigating Or Analyzing Materials By The Use Of Ultrasonic Waves (AREA)
Claims (19)
- Vorrichtung zur Messung der Eigenschaften einer Materialprobe (20), die folgendes umfasst: eine erste Anregungsquelle (24, 26, 28) zur Erzeugung von Anregungsstrahlung, welche auf die genannte Materialprobe auftrifft, wobei die genannte Anregungsstrahlung gepulste Strahlung bestehend aus mindestens zwei Komponentenstrahlenbündeln (32, 34) umfasst, die innerhalb der genannten Probe Interferenz erzeugen, wobei jedes Auftreten von Interferenz der genannten Anregungsstrahlung ausreicht, um transiente Phononen in das genannte Material zu induzieren, welche zu einem transienten, zeitabhängigen Beugungsmuster führen; ein Detektionssystem, welches zur Detektion des genannten Beugungsgitters durch Beugung der Strahlung folgendes umfasst: eine zweite Abtastquelle (42), die dazu dient, die einfallende Abtaststrahlung (48) von der Abtastquelle auf die genannte Probe zu richten, einen Detektor (58), der so positioniert ist, dass er ein Beugungssignal von der genannten Abtastquellenstrahlung als durch das genannte Beugungsgitter gebeugt erkennt, und einen Analysator (64) zum Analysieren des genannten Beugungssignals, dadurch gekennzeichnet, dass das Detektionssystem funktionell angepasst ist, um eine transiente, zeitabhängige periodische Wellenmorphologie von alternierenden Peaks und Tälern auf einer Oberfläche der genannten Probe zu erkennen, wobei die Wellenmorphologie das genannte Beugungsgitter bildet; dass die Abtastquelle funktionell angeordnet ist, um die einfallende Abtaststrahlung in einem Einfallswinkel auf die genannte Oberfläche zu richten; und dass der Detektor funktionell angeordnet ist, um ein Beugungssignal zu erkennen, das durch die genannte Oberfläche reflektiert wurde und durch die genannte transiente Wellenmorphologie gebildet wurde.
- Vorrichtung nach Anspruch 1, dadurch gekennzeichnet, dass die genannte Abtastquelle Strahlung erzeugt, die im wesentlichen nicht durch die genannte Probe absorbiert wird.
- Vorrichtung nach Anspruch 1 oder 2, dadurch gekennzeichnet, dass die genannte Anregungsquellenstrahlung Ultraviolettstrahlung enthält, die ausreichend durch die Probe absorbiert wird, um Wärme zu induzieren, die zu den genannten Phononen und der genannten Wellenmorphologie führt.
- Vorrichtung nach Anspruch 1, 2 oder 3, dadurch gekennzeichnet, dass sie weiterhin ein Abtaststrahlenbündel und einen Detektor zum Detektieren und Auflösen eines erheblichen Zeitabschnitts der durch jedes Auftreten von Interferenz der genannten Anregungsstrahlung induzierten zeitabhängigen Beugung enthält.
- Vorrichtung nach Anspruch 4, dadurch gekennzeichnet, dass die genannte Abtaststrahlung Impulse mit einer gewählten Impulsbreite enthält und dass der genannte Detektor angepasst ist, um das Beugungssignal für die Dauer des genannten Abtastimpulses zu erkennen.
- Vorrichtung nach Anspruch 5, dadurch gekennzeichnet, dass der genannte Detektor konstruiert ist, um das gesamte detektierbare Beugungssignal zu erkennen, das durch jeden Anregungsimpuls induziert wird.
- Vorrichtung nach Anspruch 6, dadurch gekennzeichnet, dass die Abtaststrahlung kontinuierlich ist oder eine Impulsdauer hat, die mindestens so lang ist wie die Dauer der zeitabhängigen Wellenmorphologie.
- Vorrichtung nach Anspruch 6, dadurch gekennzeichnet, dass die genannte Anregungsstrahlung eine Impulsbreite in der Größenordnung von Pikosekunden hat und die Abtastimpulsbreite in der Größenordnung von Nanosekunden liegt.
- Vorrichtung nach Anspruch 8, dadurch gekennzeichnet, dass der genannte Detektor eine Zeitauflösung in der Größenordnung von 1 ns hat.
- Vorrichtung nach Anspruch 4, dadurch gekennzeichnet, dass die genannte Abtaststrahlung eine Spitzenausgangsleistung von ca. 1.000 Watt oder mehr hat.
- Vorrichtung nach Anspruch 4, dadurch gekennzeichnet, dass die genannte Anregungsstrahlung von einem gepulsten Laser erzeugt wird und die genannte Abtaststrahlung von einem Dauerstrichlaser erzeugt wird.
- Verfahren zur Messung der Eigenschaften einer Materialprobe (20), das die folgenden Schritte umfasst: Aufprallen lassen eines Impulses der Anregungsstrahlung auf die genannte Probe, wobei sich die genannte Anregungsstrahlung aus mindestens zwei Komponentenstrahlenbündeln (32, 34) zusammensetzt, die innerhalb der Probe Interferenz erzeugen, wobei die Komponentenstrahlenbündel so gewählt werden, dass jedes Auftreten einer Interferenz ausreicht, um transiente Phononen in die genannte Probe zu induzieren, die zu einem transienten, zeitabhängigen Beugungsgitter führen; Detektieren des genannten Beugungsgitters durch Beugung der Strahlung, indem die einfallende Abtaststrahlung (48) auf die genannte Probe gerichtet wird und ein gebeugten Signal detektiert wird, das durch das genannte Beugungsgitter gebeugt wurde, und Analysieren des genannten Beugungsgitters durch Analysieren des genannten detektierten gebeugten Signals, um die Eigenschaften der Probe zu messen, dadurch gekennzeichnet, dass der Schritt des Aufprallenlassens eines Strahlungsimpulses das Lenken der einfallenden Abtaststrahlung in einem Einfallswinkel auf die Oberfläche umfasst; dass der Schritt des Detektierens das Detektieren einer transienten zeitabhängigen Wellenmorphologie von alternierenden Peaks und Tälern auf der Oberfläche der genannten Probe umfasst, wobei die genannte Wellenmorphologie das genannte Beugungsgitter bildet; und dass der Schritt des Analysierens das Analysieren der genannten Oberflächen-Wellenmorphologie durch Analysieren des durch die genannte Wellenmorphologie reflektierten gebeugten Signals umfasst.
- Verfahren nach Anspruch 12, wobei die genannte Probe etwa 500 µm oder weniger dick ist.
- Verfahren nach Anspruch 12 oder 13, wobei die genannte Abtaststrahlung so gewählt wird, dass sie im wesentlichen nicht durch die genannte Probe absorbiert wird.
- Verfahren nach Anspruch 14, wobei die genannte Anregungsstrahlung UV-Strahlung enthält und die genannte Abtaststrahlung Strahlung im sichtbaren Bereich des Spektrums enthält.
- Verfahren nach Anspruch 12, wobei ein erheblicher Zeitabschnitt des durch jedes Auftreten von Interferenz der genannten Anregungsstrahlung induzierten Beugungssignals detektiert und aufgelöst wird.
- Verfahren nach Anspruch 16, das weiterhin den Schritt der Signalmittelwertbildung der gebeugten Strahlung von mehreren Anregungsimpulsen umfasst.
- Verfahren nach einem der Ansprüche 12 bis 17, wobei die Beugung von der genannten Wellenmorphologie durch Variieren des Einfallswinkels des genannten Abtaststrahlenbündels optimiert wird.
- Verfahren nach einem der Ansprüche 12 bis 18, das weiterhin das Bestimmten der Adhäsion der genannten Probe auf einer Substratoberfläche aus dem genannten Beugungssignal umfasst.
Applications Claiming Priority (3)
| Application Number | Priority Date | Filing Date | Title |
|---|---|---|---|
| US72675991A | 1991-07-08 | 1991-07-08 | |
| US726759 | 1991-07-08 | ||
| PCT/US1992/005679 WO1993001476A1 (en) | 1991-07-08 | 1992-07-08 | Measurement of material properties with optically induced phonons |
Publications (3)
| Publication Number | Publication Date |
|---|---|
| EP0593667A1 EP0593667A1 (de) | 1994-04-27 |
| EP0593667A4 EP0593667A4 (en) | 1994-06-08 |
| EP0593667B1 true EP0593667B1 (de) | 2001-12-12 |
Family
ID=24919893
Family Applications (1)
| Application Number | Title | Priority Date | Filing Date |
|---|---|---|---|
| EP92916231A Expired - Lifetime EP0593667B1 (de) | 1991-07-08 | 1992-07-08 | Messung von materialeigenschaften mit optisch induzierten phononen |
Country Status (3)
| Country | Link |
|---|---|
| EP (1) | EP0593667B1 (de) |
| DE (1) | DE69232288T2 (de) |
| WO (1) | WO1993001476A1 (de) |
Families Citing this family (8)
| Publication number | Priority date | Publication date | Assignee | Title |
|---|---|---|---|---|
| EP0805947A4 (de) * | 1995-01-24 | 1999-10-20 | Massachusetts Inst Technology | Optisches verfahren und vorrichtung für zeitaufgelöste messungen |
| US6128081A (en) * | 1996-11-22 | 2000-10-03 | Perceptron, Inc. | Method and system for measuring a physical parameter of at least one layer of a multilayer article without damaging the article and sensor head for use therein |
| EP1023595A4 (de) * | 1996-11-22 | 2003-07-09 | Perceptron Inc | Methode und gerät zur signalverarbeitung zur erlangung eines physikalischen parameters |
| EP1679513A3 (de) * | 1996-11-22 | 2007-01-10 | Perceptron, Inc. | Messvorrichtung für physikalische Parameter und Verfahren dafür |
| GB9921970D0 (en) * | 1999-09-16 | 1999-11-17 | Univ London | An optical interferometer sensor array |
| US6668654B2 (en) * | 2001-08-15 | 2003-12-30 | Lockheed Martin Corporation | Method and apparatus for generating specific frequency response for ultrasound testing |
| CN119985336A (zh) | 2019-05-23 | 2025-05-13 | 昂图创新有限公司 | 无损检测及制造计量系统和方法 |
| FR3103896B1 (fr) | 2019-11-29 | 2024-03-08 | Neta | Dispositif de mesure photo-acoustique multipoints |
Family Cites Families (1)
| Publication number | Priority date | Publication date | Assignee | Title |
|---|---|---|---|---|
| US4522510A (en) * | 1982-07-26 | 1985-06-11 | Therma-Wave, Inc. | Thin film thickness measurement with thermal waves |
-
1992
- 1992-07-08 EP EP92916231A patent/EP0593667B1/de not_active Expired - Lifetime
- 1992-07-08 WO PCT/US1992/005679 patent/WO1993001476A1/en not_active Ceased
- 1992-07-08 DE DE69232288T patent/DE69232288T2/de not_active Expired - Lifetime
Also Published As
| Publication number | Publication date |
|---|---|
| EP0593667A1 (de) | 1994-04-27 |
| DE69232288T2 (de) | 2002-08-14 |
| EP0593667A4 (en) | 1994-06-08 |
| DE69232288D1 (de) | 2002-01-24 |
| WO1993001476A1 (en) | 1993-01-21 |
Similar Documents
| Publication | Publication Date | Title |
|---|---|---|
| US5633711A (en) | Measurement of material properties with optically induced phonons | |
| US6208418B1 (en) | Apparatus and method for measurement of the mechanical properties and electromigration of thin films | |
| Duggal et al. | Real‐time optical characterization of surface acoustic modes of polyimide thin‐film coatings | |
| US5748318A (en) | Optical stress generator and detector | |
| US7387027B2 (en) | Characterization of materials with optically shaped acoustic waveforms | |
| Schmidt | Pump-probe thermoreflectance | |
| US6191855B1 (en) | Apparatus and method for the determination of grain size in thin films | |
| Rogers et al. | Study of Lamb acoustic waveguide modes in unsupported polyimide thin films using real‐time impulsive stimulated thermal scattering | |
| Edward et al. | Detection of hidden gratings through multilayer nanostructures using light and sound | |
| IL116788A (en) | Optical measurements of stress in thin film materials | |
| TW201602536A (zh) | 用於判定基板中之應力的光學系統及方法 | |
| US8537363B2 (en) | Picosecond ultrasonic system incorporating an optical cavity | |
| WO1993001476A1 (en) | Measurement of material properties with optically induced phonons | |
| Ozcan et al. | Inverse Fourier transform technique to determine second-order optical nonlinearity spatial profiles | |
| Illienko et al. | Understanding photoacoustic signal formation in the presence of transparent thin films | |
| Nelson et al. | Tabletop deep-ultraviolet transient grating for ultrafast nanoscale carrier-transport measurements in ultrawide-band-gap materials | |
| Malfanti et al. | Propagation of acoustic surface waves on a phononic surface investigated by transient reflecting grating spectroscopy | |
| US6356349B1 (en) | Polariton wave imaging | |
| WO2012172524A1 (en) | Method and photothermal apparatus for contactless determination of thermal and optical properties of material | |
| Rogers et al. | Dis-bond detection and the possibility of interfacial stiffness measurement with real-time impulsive stimulated thermal scattering | |
| Gracewski et al. | Transient grating excitation of interfacial acoustics: treatment of multilayer structures | |
| Rogers et al. | Impulsive stimulated thermal scattering studies of thermally induced cure in thin films of PMDA/ODA | |
| Alcaraz | Elastic guided waves near and far a free edge monitored with laser ultrasonics: dispersion and resonances | |
| Perry et al. | Computer model for transient grating experiments and its application to analysis of LiTaO 3 s | |
| Vollmann et al. | Mechanical wave propagation at phase and material interfaces of microstructures |
Legal Events
| Date | Code | Title | Description |
|---|---|---|---|
| PUAI | Public reference made under article 153(3) epc to a published international application that has entered the european phase |
Free format text: ORIGINAL CODE: 0009012 |
|
| 17P | Request for examination filed |
Effective date: 19940126 |
|
| AK | Designated contracting states |
Kind code of ref document: A1 Designated state(s): DE FR GB |
|
| A4 | Supplementary search report drawn up and despatched |
Effective date: 19940421 |
|
| AK | Designated contracting states |
Kind code of ref document: A4 Designated state(s): DE FR GB |
|
| 17Q | First examination report despatched |
Effective date: 19950511 |
|
| APAB | Appeal dossier modified |
Free format text: ORIGINAL CODE: EPIDOS NOAPE |
|
| APAB | Appeal dossier modified |
Free format text: ORIGINAL CODE: EPIDOS NOAPE |
|
| APAD | Appeal reference recorded |
Free format text: ORIGINAL CODE: EPIDOS REFNE |
|
| APCB | Communication from the board of appeal sent |
Free format text: ORIGINAL CODE: EPIDOS OBAPE |
|
| APCB | Communication from the board of appeal sent |
Free format text: ORIGINAL CODE: EPIDOS OBAPE |
|
| APAB | Appeal dossier modified |
Free format text: ORIGINAL CODE: EPIDOS NOAPE |
|
| GRAG | Despatch of communication of intention to grant |
Free format text: ORIGINAL CODE: EPIDOS AGRA |
|
| GRAH | Despatch of communication of intention to grant a patent |
Free format text: ORIGINAL CODE: EPIDOS IGRA |
|
| GRAH | Despatch of communication of intention to grant a patent |
Free format text: ORIGINAL CODE: EPIDOS IGRA |
|
| GRAH | Despatch of communication of intention to grant a patent |
Free format text: ORIGINAL CODE: EPIDOS IGRA |
|
| GRAA | (expected) grant |
Free format text: ORIGINAL CODE: 0009210 |
|
| AK | Designated contracting states |
Kind code of ref document: B1 Designated state(s): DE FR GB |
|
| REG | Reference to a national code |
Ref country code: GB Ref legal event code: IF02 |
|
| REF | Corresponds to: |
Ref document number: 69232288 Country of ref document: DE Date of ref document: 20020124 |
|
| ET | Fr: translation filed | ||
| PLBE | No opposition filed within time limit |
Free format text: ORIGINAL CODE: 0009261 |
|
| STAA | Information on the status of an ep patent application or granted ep patent |
Free format text: STATUS: NO OPPOSITION FILED WITHIN TIME LIMIT |
|
| 26N | No opposition filed | ||
| APAH | Appeal reference modified |
Free format text: ORIGINAL CODE: EPIDOSCREFNO |
|
| PGFP | Annual fee paid to national office [announced via postgrant information from national office to epo] |
Ref country code: FR Payment date: 20110805 Year of fee payment: 20 |
|
| PGFP | Annual fee paid to national office [announced via postgrant information from national office to epo] |
Ref country code: DE Payment date: 20110727 Year of fee payment: 20 Ref country code: GB Payment date: 20110725 Year of fee payment: 20 |
|
| REG | Reference to a national code |
Ref country code: DE Ref legal event code: R071 Ref document number: 69232288 Country of ref document: DE |
|
| REG | Reference to a national code |
Ref country code: DE Ref legal event code: R071 Ref document number: 69232288 Country of ref document: DE |
|
| REG | Reference to a national code |
Ref country code: GB Ref legal event code: PE20 Expiry date: 20120707 |
|
| PG25 | Lapsed in a contracting state [announced via postgrant information from national office to epo] |
Ref country code: DE Free format text: LAPSE BECAUSE OF EXPIRATION OF PROTECTION Effective date: 20120710 Ref country code: GB Free format text: LAPSE BECAUSE OF EXPIRATION OF PROTECTION Effective date: 20120707 |