EP0607833A1 - Procédé d'analyse utilisant l'électrophorèse capillaire - Google Patents
Procédé d'analyse utilisant l'électrophorèse capillaire Download PDFInfo
- Publication number
- EP0607833A1 EP0607833A1 EP94100250A EP94100250A EP0607833A1 EP 0607833 A1 EP0607833 A1 EP 0607833A1 EP 94100250 A EP94100250 A EP 94100250A EP 94100250 A EP94100250 A EP 94100250A EP 0607833 A1 EP0607833 A1 EP 0607833A1
- Authority
- EP
- European Patent Office
- Prior art keywords
- sample
- time
- capillary
- constant
- high voltage
- Prior art date
- Legal status (The legal status is an assumption and is not a legal conclusion. Google has not performed a legal analysis and makes no representation as to the accuracy of the status listed.)
- Granted
Links
- 238000004458 analytical method Methods 0.000 title claims abstract description 48
- 238000005251 capillar electrophoresis Methods 0.000 title claims abstract description 33
- 238000000034 method Methods 0.000 title claims abstract description 27
- 238000013508 migration Methods 0.000 claims abstract description 71
- 230000005012 migration Effects 0.000 claims abstract description 71
- 238000000926 separation method Methods 0.000 claims abstract description 39
- 239000000523 sample Substances 0.000 claims description 121
- 239000000203 mixture Substances 0.000 claims description 31
- 230000000694 effects Effects 0.000 claims description 22
- 230000008859 change Effects 0.000 claims description 13
- 239000012488 sample solution Substances 0.000 claims description 11
- 230000000977 initiatory effect Effects 0.000 claims description 3
- 239000003792 electrolyte Substances 0.000 abstract description 18
- VEXZGXHMUGYJMC-UHFFFAOYSA-M Chloride anion Chemical compound [Cl-] VEXZGXHMUGYJMC-UHFFFAOYSA-M 0.000 abstract description 17
- KRHYYFGTRYWZRS-UHFFFAOYSA-M Fluoride anion Chemical compound [F-] KRHYYFGTRYWZRS-UHFFFAOYSA-M 0.000 abstract description 16
- 230000001419 dependent effect Effects 0.000 abstract description 5
- VYPSYNLAJGMNEJ-UHFFFAOYSA-N Silicium dioxide Chemical compound O=[Si]=O VYPSYNLAJGMNEJ-UHFFFAOYSA-N 0.000 abstract description 3
- 238000010586 diagram Methods 0.000 abstract description 3
- 239000005350 fused silica glass Substances 0.000 abstract description 3
- 150000001450 anions Chemical class 0.000 abstract description 2
- -1 sulfate anions Chemical class 0.000 abstract description 2
- 150000002500 ions Chemical class 0.000 description 21
- 239000012491 analyte Substances 0.000 description 20
- QAOWNCQODCNURD-UHFFFAOYSA-L Sulfate Chemical compound [O-]S([O-])(=O)=O QAOWNCQODCNURD-UHFFFAOYSA-L 0.000 description 16
- 230000005684 electric field Effects 0.000 description 12
- 238000002835 absorbance Methods 0.000 description 7
- CPELXLSAUQHCOX-UHFFFAOYSA-M Bromide Chemical compound [Br-] CPELXLSAUQHCOX-UHFFFAOYSA-M 0.000 description 5
- 238000001514 detection method Methods 0.000 description 5
- 238000005259 measurement Methods 0.000 description 5
- XLYOFNOQVPJJNP-UHFFFAOYSA-N water Substances O XLYOFNOQVPJJNP-UHFFFAOYSA-N 0.000 description 5
- 238000012937 correction Methods 0.000 description 4
- 230000007423 decrease Effects 0.000 description 4
- 239000008151 electrolyte solution Substances 0.000 description 4
- 230000002706 hydrostatic effect Effects 0.000 description 4
- CXRFDZFCGOPDTD-UHFFFAOYSA-M Cetrimide Chemical compound [Br-].CCCCCCCCCCCCCC[N+](C)(C)C CXRFDZFCGOPDTD-UHFFFAOYSA-M 0.000 description 3
- 230000008901 benefit Effects 0.000 description 3
- 230000006870 function Effects 0.000 description 3
- 230000035945 sensitivity Effects 0.000 description 3
- VEXZGXHMUGYJMC-UHFFFAOYSA-N Hydrochloric acid Chemical compound Cl VEXZGXHMUGYJMC-UHFFFAOYSA-N 0.000 description 2
- 150000001449 anionic compounds Chemical class 0.000 description 2
- 238000013459 approach Methods 0.000 description 2
- 238000004587 chromatography analysis Methods 0.000 description 2
- 230000000875 corresponding effect Effects 0.000 description 2
- 238000005370 electroosmosis Methods 0.000 description 2
- 239000012634 fragment Substances 0.000 description 2
- 229910001412 inorganic anion Inorganic materials 0.000 description 2
- 238000004811 liquid chromatography Methods 0.000 description 2
- 230000037230 mobility Effects 0.000 description 2
- PXLIDIMHPNPGMH-UHFFFAOYSA-N sodium chromate Chemical compound [Na+].[Na+].[O-][Cr]([O-])(=O)=O PXLIDIMHPNPGMH-UHFFFAOYSA-N 0.000 description 2
- 239000000243 solution Substances 0.000 description 2
- 230000003595 spectral effect Effects 0.000 description 2
- 239000003643 water by type Substances 0.000 description 2
- 238000011481 absorbance measurement Methods 0.000 description 1
- 238000000862 absorption spectrum Methods 0.000 description 1
- 238000010420 art technique Methods 0.000 description 1
- 230000033228 biological regulation Effects 0.000 description 1
- 239000003153 chemical reaction reagent Substances 0.000 description 1
- 150000001875 compounds Chemical class 0.000 description 1
- 230000002596 correlated effect Effects 0.000 description 1
- 238000013480 data collection Methods 0.000 description 1
- 230000003247 decreasing effect Effects 0.000 description 1
- 239000003599 detergent Substances 0.000 description 1
- 238000009792 diffusion process Methods 0.000 description 1
- 238000006073 displacement reaction Methods 0.000 description 1
- 230000000482 effect on migration Effects 0.000 description 1
- 238000001962 electrophoresis Methods 0.000 description 1
- 230000008030 elimination Effects 0.000 description 1
- 238000003379 elimination reaction Methods 0.000 description 1
- 230000020169 heat generation Effects 0.000 description 1
- 238000010348 incorporation Methods 0.000 description 1
- 229910001504 inorganic chloride Inorganic materials 0.000 description 1
- 229910001506 inorganic fluoride Inorganic materials 0.000 description 1
- 229910001410 inorganic ion Inorganic materials 0.000 description 1
- 229910052920 inorganic sulfate Inorganic materials 0.000 description 1
- 238000005342 ion exchange Methods 0.000 description 1
- 230000002045 lasting effect Effects 0.000 description 1
- 238000012544 monitoring process Methods 0.000 description 1
- 150000007523 nucleic acids Chemical class 0.000 description 1
- 102000039446 nucleic acids Human genes 0.000 description 1
- 108020004707 nucleic acids Proteins 0.000 description 1
- 150000007524 organic acids Chemical class 0.000 description 1
- 235000005985 organic acids Nutrition 0.000 description 1
- 102000004196 processed proteins & peptides Human genes 0.000 description 1
- 108090000765 processed proteins & peptides Proteins 0.000 description 1
- 102000004169 proteins and genes Human genes 0.000 description 1
- 108090000623 proteins and genes Proteins 0.000 description 1
- 230000004044 response Effects 0.000 description 1
- 159000000000 sodium salts Chemical class 0.000 description 1
- 239000002904 solvent Substances 0.000 description 1
- 230000007704 transition Effects 0.000 description 1
- 230000004304 visual acuity Effects 0.000 description 1
Images



Classifications
-
- G—PHYSICS
- G01—MEASURING; TESTING
- G01N—INVESTIGATING OR ANALYSING MATERIALS BY DETERMINING THEIR CHEMICAL OR PHYSICAL PROPERTIES
- G01N27/00—Investigating or analysing materials by the use of electric, electrochemical, or magnetic means
- G01N27/26—Investigating or analysing materials by the use of electric, electrochemical, or magnetic means by investigating electrochemical variables; by using electrolysis or electrophoresis
- G01N27/416—Systems
- G01N27/447—Systems using electrophoresis
- G01N27/44704—Details; Accessories
-
- G—PHYSICS
- G01—MEASURING; TESTING
- G01N—INVESTIGATING OR ANALYSING MATERIALS BY DETERMINING THEIR CHEMICAL OR PHYSICAL PROPERTIES
- G01N27/00—Investigating or analysing materials by the use of electric, electrochemical, or magnetic means
- G01N27/26—Investigating or analysing materials by the use of electric, electrochemical, or magnetic means by investigating electrochemical variables; by using electrolysis or electrophoresis
- G01N27/416—Systems
- G01N27/447—Systems using electrophoresis
- G01N27/44756—Apparatus specially adapted therefor
- G01N27/44773—Multi-stage electrophoresis, e.g. two-dimensional electrophoresis
Definitions
- Capillary electrophoresis has become a technique of great interest for the separation and analysis of many kinds of ionic species, including inorganic ions, biological mixtures such as proteins, peptides and nucleic acids, detergents, organic acids and many compounds of pharmaceutical nature.
- Capillary electrophoresis offers the benefits of high resolving power, rapid separations, ability to analyze very small volumes of sample and a desirable simplicity from the point of view of the apparatus required when compared to competing analytical techniques such as liquid chromatography.
- the benefits of capillary electrophoresis mentioned above derive to a large extent from the use of narrow diameter capillary tubes in the practice of capillary electrophoresis.
- the narrow diameter tubes permit efficient removal of the heat generated in the separation process and prevent convective mixing which would degrade the separating power.
- the narrow diameter tubes also allow high voltages to be used to generate the electric field in the capillary while limiting current flow and hence heat generation.
- the electric field in the capillary tube which provides the driving force for the separation is produced by the application of high voltage power to the ends of the capillary.
- the high voltage power is generally applied from a high voltage power supply operating at an operator selected constant voltage during the separation.
- the pulsing of the applied voltage results in a greater degree of resolution of the closely related fragments, due to reorientation of analyte molecules in the separating medium during different phases of each pulse.
- the average DC level of the output voltage from the power supply remains constant throughout the analysis.
- the separation that occurs in capillary electrophoresis is generally monitored somewhere along the length of the capillary tube by a detector that responds with a signal that is proportional to the concentration at the monitoring point of the analyte(s) within the sample to be measured.
- Absorbance detectors are commonly used but other kinds of detectors are also possible, such as fluorescence, conductivity, electrochemical and the like.
- the separating medium is modified prior to detection by the addition of reagents to label the analyte or by modifying the conductivity of the medium through ion exchange.
- the detectors employed are to a greater or lesser extent non-specific. That is, they respond with an indication of the concentration of many different analytes thus not directly determining the identity of the analyte.
- additional information is available to aid in identifying the sample components, such as when the detector is capable of measuring absorbance at multiple wavelengths so as to obtain an absorbance spectrum or ratios of absorbances at several wavelengths.
- the separated analytes can be collected as they emerge from the capillary and subjected to further analysis by other techniques.
- multiwavelength detection adds cost and complexity and spectral information may not be available if the analyte is transparent over the spectral range being measured and is being determined instead by an indirect absorbance measurement where the response is due to the displacement of an absorbing species in the separating medium.
- Post separation analysis by other techniques requires additional time and effort and is not always possible due to the small amount of sample analyzed by capillary electrophoresis.
- the detector also permits the measurement of the migration time for each analyte and the migration time can be used to characterize each component of the sample mixture.
- the migration time for each analyte is defined as the time period from the start of the analysis to the appearance at the detector of the concentration peak of that analyte.
- the migration time of each sample component can be compared to the migration times of known standards, and when combined with other knowledge about the origin and character of the sample, allow the identity of the sample components to be inferred.
- each analyte must appear in the separation at its characteristic migration time over the range of experimental conditions that the analysis is to be used for.
- the migration time of each analyte must remain essentially constant over the range of sample compositions that are likely to be encountered.
- the effect of sample composition changes can be magnified, as when it is desired to maximize the sensitivity of a capillary electrophoresis analysis.
- the sample mixture may be analyzed to be dissolved in pure water or other very low conductivity medium rather than, for example, in the separating medium. This causes a phenomenon known as stacking to occur and permits a larger volume of sample mixture to be introduced into the capillary without undesirable broadening of the analyte concentration peaks.
- the sample is dissolved in pure water to achieve this desirable enhancement in sensitivity, the migration time of the analytes becomes even more dependent on the sample composition.
- capillary electrophoresis systems of the prior art includes a capillary electrophoresis system incorporating novel methods of control of the high voltage power supply.
- the control of the high voltage power supply is characterized by initiating a change in its output condition during the analysis, such as the sequential use of two or more of the following high voltage operating modes in a single analysis: constant current, constant voltage, and constant power.
- the change in output condition is appropriately timed to effectuate the substantially complete elimination of migration time changes that are due to varying concentrations of ions in the sample.
- the timing and control of the switching of the power supply output condition may be determined by calculation prior to the analysis and/or initiated by feedback control from the capillary during the analysis.
- the first time segment of the analysis is conducted in the constant current mode, followed by the remainder of the analysis being conducted in the constant voltage mode.
- the length of the time segments is determined prior to analysis.
- the first segment of the analysis is conducted in the constant voltage mode, followed by the remainder of the analysis being conducted in the constant current mode. Again, the segment length is determined prior to analysis.
- on-line migration time measurements of an internal standard are used to determine optimum switching times of the high voltage power supply thereby eliminating residual migration time shifts of the analytes to be measured.
- Fig. 1 shows a block diagram of a CE system 10 of the present invention.
- the system includes a fused silica capillary 12 with an inside diameter having a range of from about 5 to about 500 ⁇ m, and preferably from 25 to 100 ⁇ m, having an inlet end 22 and an outlet end 32.
- Each of the ends of the capillary tube is immersed in respective inlet and outlet reservoirs 23, 33 containing an electrolyte solution 14 which extends to fill the inside volume of the capillary.
- Contacting the electrolyte solution in the reservoirs are separate electrodes 16, 18 that are connected to the output terminals of a high voltage power supply 20.
- the high voltage power supply output is set by a controller 30.
- a sample solution contained in vial 34 is introduced into the capillary 12 by placing the inlet end 22 of the capillary into the sample solution in vial 34 after which a hydrostatic pressure in the range from 0.1 to 1 psig is applied to the sample solution with respect to the outlet end 32 of the capillary.
- the high voltage power supply 20 can be activated for a period of time after the inlet end 22 of the capillary has been immersed in the sample solution in vial 34, with the resulting electric field causing sample to migrate into the capillary.
- the inlet end 22 of the capillary 12 is returned to the electrolyte reservoir 23.
- High voltage is then applied by the power supply 20 to the electrodes 16, 18 contacting the electrolyte solution 14 so that the voltage is applied from one end of the capillary tube to the other.
- the controller 30 can signal the power supply to apply the voltage in different modes.
- mode(s) is used to denote the power supply output regulation and is intended to encompass constant voltage, constant current and constant power operation. Further, the controller can cause the power supply to change mode or output level during the analysis.
- the high voltage creates an electric field within the capillary 12 that causes the components of the sample to move along the length of the capillary tube.
- the velocity of motion of each component is a function of its molecular size and shape, the electrical charge that each molecule carries, the viscosity of the electrolyte solution in the capillary tube, the magnitude of the electric field in the capillary and the rate of bulk flow caused by electroosmosis.
- a UV/Vis absorbance detector 40 is positioned at any convenient location along the length of the capillary, preferably near the outlet end 32 and is adapted to measure the components of the sample in known fashion through the walls of the capillary.
- the detector output signal changes in a manner that is related to the concentration of analyte molecules passing through that segment of the capillary tube.
- the output signal from the detector is connected to a data collection device 50.
- the CE system 10 used for these separations was a QuantaTM 4000 equipped with a Model 860 data system, commercially available from the Waters Chromatography Division of Millipore Corporation.
- the system was used with a Waters AccuSepTM fused silica capillary 12 which had a 75 ⁇ m inner diameter and was 60cm long.
- the system was operated under the following conditions to obtain the separations shown in Figs.
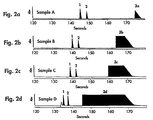
- FIG. 2 a - d Electrolyte: 5mM sodium chromate, 0.5mM tetradecyltrimethylammonium bromide (TTAB), pH 8.0 Sample Introduction: 9.8cm hydrostatic head for 30 seconds Power Supply: negative polarity Potential: 20kV Detector: UV Absorbance located at 52 cm from inlet end Wavelength: 254nm Detector Time Constant: 0.1 second Data Acquisition: 20 pts/sec As indicated, Figs. 2 a - d show the results obtained when the separations were performed according to prior art techniques where the high voltage power was applied in the constant voltage mode. One sees that the migration time of both chloride and sulfate decreases as the concentration of fluoride is increased.
- the migration times of the components of the sample are dependent on the composition of the sample.
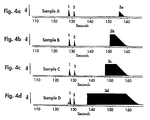
- the migration times in constant voltage mode, the migration times become shorter as the overall concentration of ions in the sample increases (and hence the conductivity of the sample increases), whereas in constant current mode the reverse happens, namely the migration times become longer as the overall concentration of ions in the sample increases.
- Sample introduction into the capillary 12 is by 9.8cm of hydrostatic head applied for 30 seconds.
- the capillary is 60cm long with an inner diameter of 75 ⁇ m.
- the length of the sample zone (i.e. the length of the plug of sample solution that flows into the capillary during the 30 seconds that 9.8 cm of hydrostatic head is applied) can be calculated.
- v avg 2.82x10 ⁇ 2 cm/sec
- L s The sample zone length, L s , is given by the product of the velocity and the duration of the sample introduction period.
- the .842 cm length of the sample zone is big by CE standards, representing 1.4% of the 60cm capillary length. It is possible in this case without undesirable broadening of the sample peaks because the samples are dissolved in pure water. This means that the analyte bands, which move at velocities different from that of the sample zone, will sharpen as they migrate into the electrolyte.
- the electrical resistance of a capillary filled with electrolyte is calculated and the effect on the resistance of introducing the sample zone for the different sample compositions is determined.
- the measured value of the electrolyte conductivity, ⁇ is 1131 ⁇ S/cm.
- R cap the resistance of the capillary, is determined from the following equation (with terms and values as above): Similarly one can calculate the resistance, R s , of the .842cm sample zone for each sample as well as the resistance of the remainder of the capillary, R el , and the total resistance of the two zones (i.e. sample and electrolyte) in series, R tot .
- R tot is given by the sum of R s and R el .
- R el is less than R cap because the length of electrolyte is shorter by the length of the sample zone.
- the sample zone with low fluoride concentrations have higher electrical resistance. It can be seen that the dilute samples have a significant effect on the overall capillary resistance. This means, for example, that in constant voltage operation, the capillary current will be significantly lower when dilute sample is introduced.
- E I R/L
- E the electric field in volts/cm
- I the capillary current (given by V/R tot in the constant voltage case, V being the voltage applied to the capillary)
- R the resistance
- L the length of the zone.
- Table III shows that as the sample becomes more conductive in going from sample A to sample D, the field in the sample zone, E s , decreases. In the rest of the capillary, because the current is always held at the same level, the field, E el , does not change. The overall effect is for migration times to get slightly longer. This is what is experimentally observed.
- the value of the sample conductivity may be used in determining how to change the separation conditions during the analysis run to achieve migration times that are independent of sample composition. In constant voltage mode, for example, where low conductivity samples have slower migration times, one could increase the voltage partway into the separation with the amount of the increase depending on the measured sample conductivity. Such correction could also be applied on the basis of direct measurements of sample conductivity prior to the analysis.
- the value of the sample conductivity would enable the controller to determine from a lookup table stored in its memory the correct time point in the analysis run to effect the increase in separation voltage and the amount of increase to be applied.
- FIG. 5 This graph plots the difference in migration time ( ⁇ MT) for both chloride and sulfate ions.
- ⁇ MT migration time
- Each point on the graph represents a ⁇ MT measurement between sample D of Fig. 2 d and Fig. 3 d having a conductivity of 1519 ⁇ S/cm (i.e. a high concentration of fluoride) and sample A of Fig. 2 a and Fig. 3 a having a conductivity of 56 ⁇ S/cm (i.e.
- a low concentration of fluoride as a function of the duration of time the CE system was run in the constant current mode at 20 ⁇ A, which was chosen as the first time segment of the analysis.
- the second time segment was performed in the constant voltage mode at 20 kV.
- the total analysis time was 180 seconds, and all the other conditions are the same as in Figs. 2 a - d.
- ⁇ MT for sulfate when run at full duration constant voltage, ⁇ MT for sulfate is about -4.8 seconds and ⁇ MT is about -4.3 seconds for chloride.
- the ⁇ MT's for these ions under full duration constant current operation are likewise large but now have a positive shift. Between these extremes are the points in time suitable for switched mode operation. At these points there is a gradual transition from the negative difference values of constant voltage operation to the positive difference values of constant current operation.
- the migration time differences are near zero for both chloride and sulfate ions.
- Variations on this approach can be used to achieve the same result.
- using the two modes (constant current and constant voltage) in the reverse order can also effect the desired result though the time of switching modes will be different.
- Constant power operation by itself is intermediate in its effect on migration time when compared to constant voltage and constant current operation. It can likewise be combined with one of the other two modes to eliminate migration time differences.
- Further enhancement of the method involves the use of on-line migration time measurement and appropriate feedback control to determine optimum high voltage power supply switching times. This can be done by incorporating a reference peak into the separation such as by adding a minor component to the separation medium filling the capillary and the electrolyte reservoirs in Fig. 1. If indirect absorbance detection is being used, the minor component should be substantially non-absorbing at the wavelength being used for detection. Conversely, if direct absorbance detection is used, the minor component should be absorbing at the measuring wavelength. The incorporation of the minor component will result in the appearance of a concentration peak at the detector at a migration time characteristic of the minor component. Alternatively, a known component could be added to the sample solution.
- an on-line measure of the migration time of the reference peak can be directly measured and used to apply further correction. That is, the method detailed above can be used to determine migration times that are substantially independent of variations in sample conductivity. Any residual migration time change in the reference peak can be directly measured and used to apply a correction such as by initiating a further change of the high voltage power supply mode.
- This use of on-line feedback control provides second order correction which further eliminates migration time changes for the remaining sample components.
- bromide is a rapidly migrating species in the analysis of anions by the method illustrated in Figs. 2a-d.
- bromide were added to the sample solution, a peak due to the bromide would be expected to be observed in the detector output at a given time point before the peaks for chloride and sulfate. If after use of the method of switching modes during the analysis run outlined above, a residual migration time shift for the known bromide concentration peak was detected, the measured time shift could be used to initiate another switching of mode to eliminate the residual migration time shift for the remaining peaks. That is if the bromide peak were detected at a point in time later than expected the power supply mode would be switched by the controller 30 back to constant current operation.
- the present invention has been described in terms of constant voltage, current or power conditions.
- the term "constant” is intended to include substantially unvarying DC levels as well as any time varying waveform in which the average value of voltage or current measured over a complete cycle of the waveform remains substantially constant. Examples of such time varying waveforms, which are considered to be within the scope of the present invention, are the application of a pulsed voltage or current waveform to the capillary or the superimposition of an AC voltage or current on a DC separation voltage or current.
- pulsed or AC modulated waveforms it is possible to use pulsed or AC modulated waveforms to obtain the same results in combining modes to eliminate migration time variations in the ways that we have previously described using substantially unvarying DC levels as long as the average value of these time varying waveforms, measured over a full cycle of the waveform, remains substantially constant for the duration of the time segment that mode is applied.
Landscapes
- Health & Medical Sciences (AREA)
- Life Sciences & Earth Sciences (AREA)
- Molecular Biology (AREA)
- Chemical & Material Sciences (AREA)
- Chemical Kinetics & Catalysis (AREA)
- Electrochemistry (AREA)
- Physics & Mathematics (AREA)
- Analytical Chemistry (AREA)
- Biochemistry (AREA)
- General Health & Medical Sciences (AREA)
- General Physics & Mathematics (AREA)
- Immunology (AREA)
- Pathology (AREA)
- Investigating Or Analyzing Materials By The Use Of Electric Means (AREA)
Applications Claiming Priority (2)
| Application Number | Priority Date | Filing Date | Title |
|---|---|---|---|
| US08/006,434 US5286356A (en) | 1993-01-21 | 1993-01-21 | Method for sample analysis using capillary electrophoresis |
| US6434 | 1993-01-21 |
Publications (2)
| Publication Number | Publication Date |
|---|---|
| EP0607833A1 true EP0607833A1 (fr) | 1994-07-27 |
| EP0607833B1 EP0607833B1 (fr) | 1999-09-22 |
Family
ID=21720864
Family Applications (1)
| Application Number | Title | Priority Date | Filing Date |
|---|---|---|---|
| EP94100250A Expired - Lifetime EP0607833B1 (fr) | 1993-01-21 | 1994-01-10 | Procédé d'analyse utilisant l'électrophorèse capillaire |
Country Status (4)
| Country | Link |
|---|---|
| US (1) | US5286356A (fr) |
| EP (1) | EP0607833B1 (fr) |
| JP (1) | JPH06300736A (fr) |
| DE (1) | DE69420750T2 (fr) |
Families Citing this family (15)
| Publication number | Priority date | Publication date | Assignee | Title |
|---|---|---|---|---|
| US5935401A (en) * | 1996-09-18 | 1999-08-10 | Aclara Biosciences | Surface modified electrophoretic chambers |
| US5666048A (en) * | 1995-06-26 | 1997-09-09 | Beckman Instruments, Inc. | Technique and apparatus for measuring a direct current flowing through a conductor at high voltage |
| KR100596953B1 (ko) * | 1996-07-03 | 2006-08-30 | 칼리퍼 라이프 사이언시즈, 인크. | 전기적변수에의한유체-함유구조물내의전기삼투압또는전기영동력의가변제어를위한장치및방법 |
| US5800690A (en) * | 1996-07-03 | 1998-09-01 | Caliper Technologies Corporation | Variable control of electroosmotic and/or electrophoretic forces within a fluid-containing structure via electrical forces |
| US6001231A (en) | 1997-07-15 | 1999-12-14 | Caliper Technologies Corp. | Methods and systems for monitoring and controlling fluid flow rates in microfluidic systems |
| US6149787A (en) * | 1998-10-14 | 2000-11-21 | Caliper Technologies Corp. | External material accession systems and methods |
| KR20010067623A (ko) * | 2001-02-23 | 2001-07-13 | 홍영표 | 전기삼투압을 이용한 무채혈 글루코스 추출법 |
| KR100496977B1 (ko) * | 2002-07-10 | 2005-06-23 | 주식회사 옵트론-텍 | 모세관 전기영동 마이크로 칩을 위한 다기능 시료주입장치. |
| US20050014134A1 (en) * | 2003-03-06 | 2005-01-20 | West Jason Andrew Appleton | Viral identification by generation and detection of protein signatures |
| JP3871689B2 (ja) * | 2004-08-25 | 2007-01-24 | ヒューマン・メタボローム・テクノロジーズ株式会社 | 電気泳動測定によるイオン性化合物の移動時間予測方法 |
| JP2006277818A (ja) * | 2005-03-29 | 2006-10-12 | Fuji Photo Film Co Ltd | 磁気転写用マスターディスクの製造方法、電鋳浴成分濃度管理システム、及び磁気記録媒体 |
| US8366897B2 (en) * | 2006-10-04 | 2013-02-05 | National Institute Of Standards And Technology | Gradient elution electrophoresis and detectorless electrophoresis apparatus |
| DE102009033426A1 (de) | 2009-07-16 | 2011-02-03 | Technische Universität München | Elektrophorese-Messvorrichtung und Messverfahren |
| US8262887B2 (en) * | 2010-04-14 | 2012-09-11 | Chen Han-Min | Method for increasing measurement precision of two-dimensional protein |
| US10761054B2 (en) * | 2016-05-13 | 2020-09-01 | Agilent Technologies, Inc. | Systems and methods for automated alignment, calibration and standardization of electrophoresis data |
Citations (3)
| Publication number | Priority date | Publication date | Assignee | Title |
|---|---|---|---|---|
| EP0070963A1 (fr) * | 1981-07-27 | 1983-02-09 | Shimadzu Corporation | Appareil électrophorétique |
| EP0361750A2 (fr) * | 1988-09-27 | 1990-04-04 | The Board Of Trustees Of The Leland Stanford Junior University | Système d'électrophorèse capillaire |
| EP0457748A1 (fr) * | 1990-05-18 | 1991-11-21 | Northeastern University | Electrophorèse capillaire à champ pulsé |
Family Cites Families (1)
| Publication number | Priority date | Publication date | Assignee | Title |
|---|---|---|---|---|
| US5015350A (en) * | 1989-11-06 | 1991-05-14 | Applied Biosystems, Inc. | Flow-rate-controlled surface-charge coating for capillary electrophoresis |
-
1993
- 1993-01-21 US US08/006,434 patent/US5286356A/en not_active Expired - Lifetime
-
1994
- 1994-01-10 EP EP94100250A patent/EP0607833B1/fr not_active Expired - Lifetime
- 1994-01-10 DE DE69420750T patent/DE69420750T2/de not_active Expired - Fee Related
- 1994-01-20 JP JP6018813A patent/JPH06300736A/ja not_active Withdrawn
Patent Citations (4)
| Publication number | Priority date | Publication date | Assignee | Title |
|---|---|---|---|---|
| EP0070963A1 (fr) * | 1981-07-27 | 1983-02-09 | Shimadzu Corporation | Appareil électrophorétique |
| EP0361750A2 (fr) * | 1988-09-27 | 1990-04-04 | The Board Of Trustees Of The Leland Stanford Junior University | Système d'électrophorèse capillaire |
| EP0457748A1 (fr) * | 1990-05-18 | 1991-11-21 | Northeastern University | Electrophorèse capillaire à champ pulsé |
| US5122248A (en) * | 1990-05-18 | 1992-06-16 | Northeastern University | Pulsed field capillary electrophoresis |
Non-Patent Citations (3)
| Title |
|---|
| DATABASE ANALYTICAL ABSTRACTS ROYAL SOCIETY OF CHEMISTRY, CAMBRIDGE UK; N. CHEN ET AL :: "Influence of column temperature and physico-chemical properties on the electrophoretic behaviour of polyglycine peptides in free-solution capillary electrophoresis" * |
| JOURNAL OF CHROMATOGRAPHY, vol. 644, no. 1, 30 July 1993 (1993-07-30), AMSTERDAM NL, pages 175 - 182 * |
| P. GEBAUER ET AL :: "Sample self-stacking in zone electrophoresis. Theoretical description of the zone electrophoretic separation of minor compounds in the presence of bulk amounts of a sample component with high mobility and like charge", JOURNAL OF CHROMATOGRAPHY, vol. 608, 1992, AMSTERDAM NL, pages 47 - 57 * |
Also Published As
| Publication number | Publication date |
|---|---|
| US5286356A (en) | 1994-02-15 |
| EP0607833B1 (fr) | 1999-09-22 |
| JPH06300736A (ja) | 1994-10-28 |
| DE69420750T2 (de) | 2000-05-11 |
| DE69420750D1 (de) | 1999-10-28 |
Similar Documents
| Publication | Publication Date | Title |
|---|---|---|
| Schwer et al. | Analytical and micropreparative separation of peptides by capillary zone electrophoresis using discontinuous buffer systems | |
| US5286356A (en) | Method for sample analysis using capillary electrophoresis | |
| Paulus et al. | Analysis of oligonucleotides by capillary gel electrophoresis | |
| Krivácsy et al. | Electrokinetic injection in capillary electrophoresis and its application to the analysis of inorganic compounds | |
| EP0560974B1 (fr) | Amelioration des concentrations d'echantillons traites par electrophorese capillaire | |
| VanOrman et al. | Effects of buffer composition on electroosmotic flow in capillary electrophoresis | |
| Křivánková et al. | On-line isotachophoresis–capillary zone electrophoresis versus sample self stacking capillary zone electrophoresis: Analysis of hippurate in serum | |
| Udseth et al. | Capillary isotachophoresis/mass spectrometry | |
| US5464517A (en) | Electrophoresis in low conductivity buffers | |
| EP2467709B1 (fr) | Topographies de concentrations de protons, procédés et dispositifs pour les produire | |
| Goodall et al. | Quantitative aspects of capillary electrophoresis | |
| Curry Jr et al. | Electrochemical detection for capillary electrophoresis | |
| EP0442315A1 (fr) | Procédé de séparation d'espèces ioniques par électrophorèse capillaire | |
| Schwartz et al. | Performance of an automated injection and replenishment system for capillary electrophoresis | |
| Timperman et al. | Dynamic on-column pH monitoring in capillary electrophoresis: application to volume-limited outlet vials | |
| JPH0599898A (ja) | データ分析方法、電気泳動分析方法、電気泳動機構およびdna断片の確認方法 | |
| Šutáček et al. | Simple method for generation of dymanic pH gradient in capillary zone electrophoresis | |
| Copper | Capillary electrophoresis: Part I. Theoretical and experimental background | |
| Vespalec et al. | Identification of peaks in capillary zone electrophoresis based on actual mobilities | |
| Sun et al. | Comparison of micellar electrokinetic capillary chromatography and high-performance liquid chromatography on the separation and determination of caffeine and its analogues in pharmaceutical tablets | |
| Jenkins | Clinical applications of capillary electrophoresis: Status at the new millennium | |
| Marák et al. | Computer-assisted choice of discrete spacers for anionic isotachophoresis separations | |
| JPH0894578A (ja) | キャピラリー電気泳動装置 | |
| Gebauer et al. | Isotachophoresis in open-tubular fused-silica capillaries with on-column multi-wavelength detection | |
| US5466351A (en) | Capillary electrophoretic system for separation of samples containing both positively and negatively charged components |
Legal Events
| Date | Code | Title | Description |
|---|---|---|---|
| PUAI | Public reference made under article 153(3) epc to a published international application that has entered the european phase |
Free format text: ORIGINAL CODE: 0009012 |
|
| AK | Designated contracting states |
Kind code of ref document: A1 Designated state(s): DE FR GB |
|
| 17P | Request for examination filed |
Effective date: 19941010 |
|
| 17Q | First examination report despatched |
Effective date: 19980116 |
|
| GRAG | Despatch of communication of intention to grant |
Free format text: ORIGINAL CODE: EPIDOS AGRA |
|
| GRAG | Despatch of communication of intention to grant |
Free format text: ORIGINAL CODE: EPIDOS AGRA |
|
| GRAH | Despatch of communication of intention to grant a patent |
Free format text: ORIGINAL CODE: EPIDOS IGRA |
|
| GRAH | Despatch of communication of intention to grant a patent |
Free format text: ORIGINAL CODE: EPIDOS IGRA |
|
| GRAA | (expected) grant |
Free format text: ORIGINAL CODE: 0009210 |
|
| AK | Designated contracting states |
Kind code of ref document: B1 Designated state(s): DE FR GB |
|
| REF | Corresponds to: |
Ref document number: 69420750 Country of ref document: DE Date of ref document: 19991028 |
|
| ET | Fr: translation filed | ||
| PLBE | No opposition filed within time limit |
Free format text: ORIGINAL CODE: 0009261 |
|
| STAA | Information on the status of an ep patent application or granted ep patent |
Free format text: STATUS: NO OPPOSITION FILED WITHIN TIME LIMIT |
|
| 26N | No opposition filed | ||
| PGFP | Annual fee paid to national office [announced via postgrant information from national office to epo] |
Ref country code: GB Payment date: 20001220 Year of fee payment: 8 Ref country code: FR Payment date: 20001220 Year of fee payment: 8 Ref country code: DE Payment date: 20001220 Year of fee payment: 8 |
|
| REG | Reference to a national code |
Ref country code: GB Ref legal event code: IF02 |
|
| PG25 | Lapsed in a contracting state [announced via postgrant information from national office to epo] |
Ref country code: GB Free format text: LAPSE BECAUSE OF NON-PAYMENT OF DUE FEES Effective date: 20020110 |
|
| PG25 | Lapsed in a contracting state [announced via postgrant information from national office to epo] |
Ref country code: DE Free format text: LAPSE BECAUSE OF NON-PAYMENT OF DUE FEES Effective date: 20020801 |
|
| GBPC | Gb: european patent ceased through non-payment of renewal fee |
Effective date: 20020110 |
|
| PG25 | Lapsed in a contracting state [announced via postgrant information from national office to epo] |
Ref country code: FR Free format text: LAPSE BECAUSE OF NON-PAYMENT OF DUE FEES Effective date: 20020930 |
|
| REG | Reference to a national code |
Ref country code: FR Ref legal event code: ST |