EP0623882A2 - System und Verfahren für die stabile Analyse von willkürlich verschobenen Datenmustern - Google Patents
System und Verfahren für die stabile Analyse von willkürlich verschobenen Datenmustern Download PDFInfo
- Publication number
- EP0623882A2 EP0623882A2 EP94303141A EP94303141A EP0623882A2 EP 0623882 A2 EP0623882 A2 EP 0623882A2 EP 94303141 A EP94303141 A EP 94303141A EP 94303141 A EP94303141 A EP 94303141A EP 0623882 A2 EP0623882 A2 EP 0623882A2
- Authority
- EP
- European Patent Office
- Prior art keywords
- location
- isolated
- detected
- data set
- data pattern
- Prior art date
- Legal status (The legal status is an assumption and is not a legal conclusion. Google has not performed a legal analysis and makes no representation as to the accuracy of the status listed.)
- Withdrawn
Links
Images



Classifications
-
- G—PHYSICS
- G06—COMPUTING OR CALCULATING; COUNTING
- G06F—ELECTRIC DIGITAL DATA PROCESSING
- G06F17/00—Digital computing or data processing equipment or methods, specially adapted for specific functions
- G06F17/10—Complex mathematical operations
- G06F17/14—Fourier, Walsh or analogous domain transformations, e.g. Laplace, Hilbert, Karhunen-Loeve, transforms
- G06F17/148—Wavelet transforms
-
- G—PHYSICS
- G06—COMPUTING OR CALCULATING; COUNTING
- G06F—ELECTRIC DIGITAL DATA PROCESSING
- G06F2218/00—Aspects of pattern recognition specially adapted for signal processing
Definitions
- the present invention generally relates to a system and method for analyzing isolated data patterns in a signal, and more specifically to such a system and method for analyzing a signal having isolated data patterns which are arbitrarily shifted.
- a data pattern such as a digital signal
- a signal processing function such as correlation, convolution, or transform
- an arbitrary shift in the input signal causes changes in the output of the signal processing function, as well. This effect is aggravated when the signal is sampled at a rate close to the critical sampling rate.
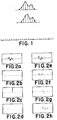
- Fig. 1 illustrates an arbitrary shift in the sampling of a signal. For many digital signal processes, such shifts produce a significant change in the output of the signal processing function. For example, the discrete Fourier transform computes inner products of time data and a complex exponential.
- FIG. 2 shows a transient (Fig. 2a) and its wavelet decomposition (Figs. 2b, 2c and 2d) before and after a shift (Figs. 2e, 2f, 2g, 2h).
- the decomposition is totally different because of a shift of just one sample.
- FIG. 2 illustrates that the discrete wavelet transform is sensitive to the exact positioning of signals in a sampled time record. In many cases the discrete wavelet transform can yield dramatically different coefficients depending on where the transient happens to occur in the time record. In practice, the location of the signal in the time record is usually unknown and completely arbitrary. Thus, the discrete wavelet transform (used in digital signal processing) is unreliable in its ability to detect, characterize and classify signals.
- Oversampling reduces the sampling interval so that the extent of arbitrary shifting is confined. For example, if the original sampling rate were 1 KHz, the worst case subsample positional shift would be 0.5 msec in the time record. If the sampling rate were increased to 10 KHz, the worse case would be 0.05 msec. However, such improvement is achieved at the expense of the need to process a much greater amount of data. Note that the oversampling approach makes no attempt to solve the underlying problem. Rather, the oversampling approach simply bounds the error. Oversampling can be implemented in hardware by increasing the rate of the analog-to-digital converter, or in software by interpolation (such as upsampling with zeroes followed by low pass filtering). In either case, the cost to achieve oversampling is significant. In summary, oversampling is flawed because it does not optimally solve the shift variance problem, it greatly increases the burden of computation and it is expensive.
- Wavelets are defined as the sets of functions: The sets are formed by dilations, a, and translations, b, of a function g(x), called the analyzing wavelet.
- the set of functions maintains the shape of the analyzing wavelet throughout the time-frequency or time-scale plane.
- T the sampling interval
- scale is the level of detail provided at dilation a.
- the first approach estimates the positions of the zero crossings in the record, then resamples the data in software in order to stabilize the samples. While this approach is an improvement over prior art, it experiences the following difficulties: (a) forming the resampled representation and reconstruction is very mathematically intensive; (b) it cannot be used with scale-envelopes because envelopes do not have zero-crossings; (c) it is designed for shift-correcting global patterns and thus is of questionable applicability for isolated transients and other isolated patterns; (d) it does not always produce a unique representation and reconstruction.
- the second approach is a variation of the first method. Instead of using zero-crossings, the second approach uses signal maxima as the basis for resampling. The second approach is an improvement upon the first approach, but is still mathematically intensive, of questionable applicability for isolated patterns, and does not guarantee uniqueness.
- the present invention is directed to a method of enhancing stability of a discrete data pattern resulting from performing a predefined mathematical operation on a first data set subject to arbitrary shifts.
- the method comprises the steps of analyzing the first data set using a predefined mathematical operator to produce a second data set and detecting and isolating the discrete data pattern in the second data set.
- a location of the detected and isolated data pattern in the second data set is determined and then a difference between the location of the detected and isolated data pattern and a predetermined location of the mathematical operator is measured.
- preselected parameters of the mathematical operator are adjusted in accordance with the measured location difference such that the adjusted mathematical operator is aligned with the detected and isolated data pattern.
- the first data set is analyzed using the aligned mathematical operator.
- the present invention is directed to methods of enhancing stability of a discrete data pattern resulting from performing a predefined mathematical operation on a first data set subject to arbitrary shifts.
- the present invention is applicable to other types of processing, such as image processing, and to signals of any number of dimensions.
- Fig. 3 a block diagram of a preferred computer-based system 302 which operates in accordance with the methods of the present invention.
- the system 302 includes a sensor 304, such as an accelerometer, pressure transducer, microphone, etc.
- the sensor 304 receives and converts a dynamic physical phenomena (not shown) into an analogous standard instrumentation signal (not shown) using a medium such as electricity, fluid, or light.
- the signal may represent, for example, an image or element thereof which is being analyzed. More generally, the signal may represent any localized or discrete data pattern.
- the system 302 also includes signal conditioning equipment 306, which amplifies, impedance matches, filters, and otherwise improves the signal received from the sensor 304.
- the system 302 further includes an analog-to-digital (A/D) converter 308, which digitizes the analog signal received from the signal conditioning equipment 306.
- A/D analog-to-digital
- a processor 310 receives and analyzes the digital signal from the A/D converter 308 in accordance with the methods of the present invention.
- the steps of the methods of the present invention are preferably embodied in computer software (not shown) which resides in a random access memory (RAM) 316, or ROM (320), described below.
- RAM random access memory
- ROM ROM
- the processor 310 operates in accordance with the computer software.
- the methods of the present invention may be implemented using other means, such as hard wired logic circuits used in combination with or instead of the processor 310 and software (not shown).
- the system 302 also includes a keyboard, mouse, or other input device 322, a read only memory (ROM) 320 (for storing fixed information), a communication port 318 (for receiving from another location or sending to another location, signals for analysis by the processor 310), a display 314 and a printer 312.
- ROM read only memory
- the RAM 316 may store signals for analysis by the processor 310.
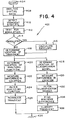
- Fig. 4 is a flow chart showing a method of enhancing stability of a discrete data pattern resulting from performing a predefined mathematical operation on a first data set subject to arbitrary shifts, in accordance with a first embodiment of the present invention.
- the processor 310 analyzes the first data set using a predefined mathematical operator to produce a second data set. More particularly, in step 408 the processor 310 analyzes the digital signal (also called herein the raw signal, or first data set) received from the A/D converter 308 (or retrieved from RAM 316, or received from another location via the communication port 318). Such analysis may include the use of an analysis function such as a convolution or correlation, for example.
- the convolution operation is: where s(.) is the sequence of signal samples, h(.) is the filter impulse response, and c(.) is the output of the convolution.
- the processor 310 detects and isolates the discrete data pattern (such as a transient) in the second data set (that is, the output of the analysis function). More particularly, in step 410 the processor 310 detects unmodulated transients in the analysis function output (also called herein the analyzed signal, or second data set). Modulated transients are also preferably detected in step 410 but they can alternatively be detected after amplitude demodulation (step 416). Any conventional detection technique can be used such as comparing the absolute or squared value of every sample against a threshold. Such detection can be enhanced by requiring that several adjacent samples must exceed the threshold before being counted. Another improvement includes ignoring occasional dropouts below the threshold.
- the discrete data pattern such as a transient
- the processor 310 detects and isolates the discrete data pattern (such as a transient) in the second data set (that is, the output of the analysis function). More particularly, in step 410 the processor 310 detects unmodulated transients in the analysis function output (also called herein the
- the detection process in step 410 may be further enhanced by passing demodulated transients through a non-linear filter that triggers only when a high energy level exists within a certain time restriction (i.e., trigger when a ⁇ ⁇ t ⁇ b, where a and b are predefined time durations based on some general knowledge of the characteristics of the transients).
- the upper limit may be long enough to include the possibility that two close transients may superficially appear to be one long signal.
- detection of an event can be confirmed by looking for simultaneous threshold exceedances on neighboring scales.
- the detected transient is isolated in step 410 by estimating the boundary of the detected transient.
- the transient boundary is estimated based on, for example, the region of significant energy above background level.
- the processor 310 tests the analyzed signal to determine if the analyzed signal is modulated, i.e., has the form of a modulated carrier.
- An auto-regression moving average (ARMA) or fast fourier transform (FFT) approach can be used, for example, to detect modulation.
- the modulation test can alternatively be done on the raw (unanalyzed) signal, but it is preferably performed after analysis (i.e., after step 408) for better reliability. It should be understood that the sequence of detection (step 410) and testing for modulation (steps 412 and 414) is not critical and should be tailored to the particular application.
- the processor 310 in step 416 envelope detects the second data set. That is, the processor 310 calculates the envelope of the transient detected in the analyzed signal.
- amplitude demodulation is performed by creating an analytic signal on each scale. The envelope is then calculated as the magnitude of the analytic signal on each scale.
- Amplitude demodulation is preferably accomplished by well-known time domain techniques such as using the Hilbert transform, or by using well-known frequency domain techniques which typically include the steps of calculating the FFT of the analyzed signal, zeroing negative components and doubling positive components, and then taking the inverse FFT. While the analytic signal approach to demodulation has been identified as the preferred technique, other amplitude demodulation techniques may also be used in step 416.
- step 418 the processor 310 determines a location of the detected and isolated data pattern in the second data set. That is, the processor 310 determines a location of each transient detected in step 410.
- the determination (or measurement) conducted in step 418 must be such that small changes in the shape of the analyzed signal should result in small changes in the coefficients, and small errors in the measurement (step 418) should result in small changes in the resulting coefficients.
- Many techniques satisfying the above criteria exist for measuring the locations of detected transients including:
- the processor 310 determines the location of the analyzing function.
- the location of the analyzing function is generally known in advance and is preferably the location parameter used to generate the analyzing function. For example, if a gaussian enveloped sinusoid is the analyzing function, then the center of the envelope is preferably used as the location.
- the processor 310 measures a difference between the location of the detected and isolated data pattern and the location of the analyzing function. That is, the processor 310 measures the distance between the location of each transient (determined in step 418) and the location of the analyzing function (determined in step 420). If the analyzing function has several allowed locations (the usual case), then the nearest location is preferred as reference. An example of a distance measure is the Euclidean.
- step 424 the processor 310 adjusts preselected parameters of the mathematical operator in accordance with the measured location difference such that the adjusted mathematical operator is aligned with the detected and isolated data pattern. That is, in step 424 the processor 310 shifts the analyzing function to bring the location of the analyzing function into alignment with the location of each transient. Since the analyzing function is a mathematical function, step 424 is easily done by adjusting the location parameter of the analyzing function in accordance with the location difference measured in step 422. For example, if the analyzing function is a gaussian modulated cosine, the gaussian envelope as well as the cosine are both shifted by the same amount.
- step 426 the processor 310 analyzes the first data set using the aligned mathematical operator. That is, the processor 310 reanalyzes the raw signal using the shifted analysis function. Note that the entire raw signal is not reanalyzed, only those portions containing transients. For signals containing multiple transients, the analysis function is shifted and applied independently for each transient. As a result of step 426, a set of shift invariant analysis coefficients for each transient is produced.
- the same section of the signal is reanalyzed twice.
- the analyzing function is shifted to bring it into alignment with the first transient, and then the analyzing function is shifted again but by a different amount to bring it into alignment with the second transient.
- step 428 the processor 310 determines the nominal location of each classification model.
- the measure used in step 428 for determining the locations of the classification models should be the same as used in step 418 to determine the locations of the transients.
- step 430 the processor 310 measures the difference between the location (determined in step 418) of the transient which is being classified (called herein the transient of interest) and the location of each classification model (determined in step 428).
- step 432 the processor 310 brings each classification model into alignment with the transient. If the classification model is analytic, such alignment is performed by adjusting the location parameter of the classification model to compensate for the difference measured in step 430. For empirical classification models, such alignment is performed by interpolating the classification model, and then synthetically resampling to bring the classification model into alignment with the transient.
- step 434 the processor 310 measures the difference between each aligned model and the transient of interest.
- step 436 the processor 310 identifies the classification model having the smallest difference with the transient of interest and classifies the transient of interest using the identified classification model.
- Well-known goodness of fit measures or procedures may be used in step 436. Note that steps 430-436 must be performed for each transient.
- classification of the transient occurs in parallel to aligning of the analyzing function and reanalysis of the transient.
- classification may occur after the transient has been reanalyzed to thereby bypass (i.e., eliminate) steps 428 through 434.
- classification step 436) is directly accomplished on the reanalyzed transient.
- the full classification procedure of Fig. 4, including steps 428-436 are used to provide the best results.
- the procedure of the alternate embodiment will typically be both accurate and faster.
- steps 410 and 414-426 are iteratively performed (after a first pass through steps 408-426) until the location difference determined in step 422 is less than a predetermined amount. If the location difference of step 422 is greater than the predetermined amount, then another iteration is performed starting with step 424 and proceeding through steps 426, 410, and 414-422. If the location difference is less than the predetermined amount, then step 436 is performed as described above to classify the transient based on the reanalyzed transient (thereby eliminating steps 428-434). Note that after the first pass is performed, step 414 can be bypassed since it will be known whether the signal is modulated.
- step 410 can be bypassed since it will be known that the transient exists (although it will still be necessary to perform the isolating procedure of step 410). Further, note that it is expected that in many, if not most, situations, a single pass through the steps of Fig. 4 will be sufficient. However, the iterative procedure just described offers the dual benefits of: (1) increased accuracy, and (2) measurement of convergence.
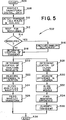
- Fig. 5 is a flow chart of a method of enhancing stability of a discrete data pattern resulting from performing a predefined mathematical operation on a first data set subject to arbitrary shifts, in accordance with a second embodiment of the present invention.
- the flow chart of Fig. 5 is generally similar to the flow chart of Fig. 4.
- step 508 of the second embodiment is generally the same as step 408 of the first embodiment, except that in step 508 the processor 310 analyzes the signal (or first data set) using a wavelet transform.
- Step 510 of the second embodiment is generally the same as step 410 of the first embodiment, except that in step 510 the processor 310 must process multiple scales.
- Step 512 of the second embodiment is generally the same as step 412 of the first embodiment, except that in step 512, the information needed to determine whether the analyzed signal is modulated may be available directly from the wavelet decomposition. For example, if the energy is much higher on a scale (except for the lowest frequency scale used) relative to its neighboring scales, then a modulated signal is present.
- Steps 514 and 516 of the second embodiment are generally the same as steps 414 and 416 of the first embodiment.
- Step 518 of the second embodiment is generally the same as step 418 of the first embodiment, except that in step 518 two-dimensional measures may be used to accommodate the fact that the energy is distributed over two dimensions (time and scale).
- the time location estimate can be enhanced by using only those scales in which the signal predominates. The estimated scale location can be useful for classification.
- Steps 520 and 522 in the second embodiment are generally the same as steps 420 and 422 in the first embodiment, except that in steps 520 and 522 the processor 310 must process multiple scales.
- Step 524 in the second embodiment is generally the same as step 424 in the first embodiment, except that in step 524 the analyzing wavelet must be shifted on each scale by the same time increment (not necessarily by the same number of samples since the sampling interval changes on different scales in some decompositions). Also, the whole wavelet is shifted as a rigid unit: the real, imaginary, and envelope. This applies also in those cases for which an explicit wavelet is not used, such as multiresolution analysis. In multiresolution, low and high pass quadrature mirror filters are utilized in a coordinated fashion to accomplish the same end effect as if bandpass filters (analyzing wavelets) had been used, such that the high and low pass filter impulse responses are convolved with the signal. To be equivalent to a shift in the wavelet, the impulse response must be shifted with respect to the samples.
- Step 526 of the second embodiment is generally the same as step 426 of the first embodiment.
- Steps 528-536 of the second embodiment are generally the same as steps 428-436 of the first embodiment; however, if classification models (also called prototypes) are developed in the time domain, then they must be decomposed by means of the wavelet transform. Prototypes can also be developed in the time-scale plane if sufficient knowledge is available about their time-scale plane characteristics. If the prototypes are developed in the time-scale plane, then further decomposition is not necessary.
- classification models also called prototypes
- Prototypes can also be developed in the time-scale plane if sufficient knowledge is available about their time-scale plane characteristics. If the prototypes are developed in the time-scale plane, then further decomposition is not necessary.
- the processor 310 must decide whether to use or not use the envelopes of the scale data. If envelopes are used for the transients (calculated in step 516), then envelopes must also be used for the prototypes.
- the prototype is characterized by either a regular wavelet decomposition or a decomposition that has been demodulated on each scale.
- step 534 must take into account multiple scales.
- Step 534 preferably operates as follows. The difference in value between corresponding samples of each prototype is squared, multiplied by the sampling interval, and then summed over all samples. This is done on each scale for each prototype, and the results summed over all scales. Finally, the square root is taken of the grand total. The operation just described represents the numerator (less the factor 100) in equation (6) below. Low pass residue may also be used in the distance measure (step 530), although it is not shown in equation (6).
- the percentage difference is calculated (in step 534) as the distance (or difference) divided by the sum of the norms of the two functions, times 100, as shown in equation (6):
- Wf j and Wg j are the wavelet transforms of functions f and g on scale j, and n ⁇ t is the discretized time.
- the percent difference always remains between 0% and 100%, inclusive.
- the low pass residue may also be used to calculate the norms, and should be used if the distance measure utilizes it.
- step 510 The exact order of detection (i.e., step 510) and modulation (i.e., steps 512, 514, and 516) is not crucial, nor are the exact measures used for location (steps 518, 520, and 528) or difference in location (i.e., steps 522 and 530).
- step 518, 520, and 528) or difference in location i.e., steps 522 and 530.
- steps 518, 520, and 528 the exact measures used for location
- steps 522 and 530 The optimal approach may vary with particular applications.
- the above mathematical formulas are presented herein for illustrative purposes only and are not limiting.
- Fig. 6a illustrates a signal 602 which is to be analyzed by the system 302 in accordance with the second embodiment of the present invention (i.e., Fig. 5).
- the signal 602 of Fig. 6a contains considerable noise and two barely visible transients.
- Fig. 6b illustrates a wavelet transform decomposition of the signal 602 after the processor 310 has performed step 508 (as described above). For simplicity purposes, only three scales are shown. Note in Fig. 6b that the signal to noise ratio has increased due to the decomposition because, in the example of Fig. 6b, the noise is divided among all three scales, each signal resides on only one scale.
- steps 510, 512, 514, and 516 are not important.
- the processor 310 performs steps 512, 514, and 516 before performing step 510.
- the result of performing steps 512, 514, and 516 is shown in Fig. 6c where the envelopes are indicated by 604.
- Step 510 is performed by comparing the envelopes 604 with thresholds 606.
- transients are defined as the regions where the envelopes 604 exceed the thresholds 606. Conditions can be associated with this, such that the envelopes 604 must exceed the thresholds 606 for a certain minimum number of samples (in order to avoid irrelevant spikes, for example), or for less than a certain maximum number of samples (in order to discriminate transients from trends, for example). There are many well-known, appropriate detection methods which may be applied.
- Fig. 6e depicts the transients themselves (in this case, meaning that part of the envelopes 604, on each scale, that is above the thresholds 606).
- the processor 310 isolates the transients, as depicted in Fig. 6f. Isolation of the transients is relatively simple if the transients are well separated. Overlapping transients on the same scale can be recognized if their combined length is too long for any kind of transient of interest. If such overlapping transients are discovered, they are separated by, for example, splitting them at their minimum point, or by treating them as mixed distributions and using such well-known techniques as expectation maximization.
- Fig. 6g depicts the locations 608 of the transients as determined by the processor in step 518.
- the locations are calculated over multiple scales if the transients cover multiple scales.
- the bivariate centroid is used.
- Fig. 6h depicts the real part of the analyzing wavelet, wherein the envelope and the sinusoid peak occur on the same sample. Note that the analyzing wavelet is generated from a mathematical expression and thus can be centered at any location with respect to the sampling. Fig. 6h generally represents the operation of step 520.
- Fig. 6i depicts the shifted and aligned analyzing wavelet after operation of steps 522 and 524.
- the analyzing wavelet has been shifted by the amount that the analyzing wavelet centroid (determined in step 520) is different from the nearest sample in order to bring the center of the analyzing wavelet into exact alignment with the center of the transient.
- step 526 the processor 310 reanalyzes the original signal 602 using the shifted analyzing wavelets.
- An upper transient 610 of the reanalyzed signal is shown in Fig. 6j.
- Fig. 6j shows the upper transient 610 being compared to a prototype 612 of the wrong class.
- Fig. 6k shows the upper transient 610 being compared to a prototype 614 of the correct class.
- the present invention may be embodied in many forms, for example, as a system to detect rubbing in a journal bearing supporting a steam turbine shaft.
- the system includes one or more accelerometers mounted on a bearing cap.
- the contact that occurs during a rub is momentary, and is in the nature of an impulse.
- the rubbing impact being very brief in time, creates a broad spectrum and excites the natural frequencies in the bearing housing.
- the system of the present invention detects and analyzes these natural frequency transients. Note that in the earliest stages the rub occurs only occasionally and has low energy content.
- the system of the present invention further distinguishes the rubbing from the following transients: a) electrical transients that occasionally disturb the electrical circuit; b) transients caused by sudden changes in generator load; c) transients caused by sudden motion of injection and extraction valves in the turbine.
- the latter effects produce a weak reaction at the bearing, but may be in the same order of magnitude as rubbing in incipient stages.
- classification models may be developed in the time-frequency or time-scale plane. In the latter case either an analytic or empirical example of each type of transient is developed or captured and this is analyzed by means of, for instance, the well known affine wavelet transform.
- the distribution of energy following scale decomposition helps to distinguish the transients (some transients will have more energy on some scales while others may have more energy on other scales). Even after this, however, some transients may be hard to distinguish. Here information regarding the exact shape of the transient may be crucial. To reduce the amount of data without losing essential information, the signal on each scale may be demodulated with a high quality technique such as use of the analytic signal.
- two transients may be very close in wavelet coefficients but distinguishable. They may take different times to reach full amplitude and to ringdown, and one may have a secondary peak. However when the actual signals are seen under realistic conditions, in which they are arbitrarily positioned with respect to the time sampling function, they may not be distinguishable at all. Because of the time variance of the discrete wavelet transform, the actual coefficients may differ substantially from the ideal case.
- the results can be stabilized by reanalyzing the data according to the present invention as described above; that is, by shifting the analyzing function by 0.5 for the second case.
- the analyzing function (such as Morlet's wavelet, for example) is expressed analytically as a function of the abscissa, it is usually easy to shift the function by a simple adjustment of the abscissa.
- the offset data When the offset data is reanalyzed, it will have the same coefficients as the centered case and thus will be easily identifiable as belonging to the same class as the centered case. See Fig. 8.
- the system of the present invention provides a simple, effective way of correcting for the shift sensitivity of the discrete signal processing algorithm.
- the present invention provides stable, repeatable coefficients that X Abscissa 0 1 2 3 4 5 6 Y Original Position 0 2 4 3 2 1 0 Y Offset by 0.112 sample 0.224 2.224 3.888 2.888 1.888 0.888 0 TABLE 2 can be compared with previous occurrences of the rubbing, thereby allowing for correct classification so that the transient of interest is not confused with other transients.
- the system of the present invention other transients.
- the system of the present invention also allows for trending in order to determine if the transients are slowly changing in shape or growing in magnitude.
Landscapes
- Engineering & Computer Science (AREA)
- Physics & Mathematics (AREA)
- Mathematical Physics (AREA)
- General Physics & Mathematics (AREA)
- Pure & Applied Mathematics (AREA)
- Mathematical Optimization (AREA)
- Mathematical Analysis (AREA)
- Computational Mathematics (AREA)
- Data Mining & Analysis (AREA)
- Theoretical Computer Science (AREA)
- Algebra (AREA)
- Databases & Information Systems (AREA)
- Software Systems (AREA)
- General Engineering & Computer Science (AREA)
- Complex Calculations (AREA)
Applications Claiming Priority (2)
| Application Number | Priority Date | Filing Date | Title |
|---|---|---|---|
| US58113 | 1993-05-05 | ||
| US08/058,113 US5517585A (en) | 1993-05-05 | 1993-05-05 | System and method for stable analysis of sampled transients arbitrarily aligned with their sample points |
Publications (2)
| Publication Number | Publication Date |
|---|---|
| EP0623882A2 true EP0623882A2 (de) | 1994-11-09 |
| EP0623882A3 EP0623882A3 (de) | 1995-02-15 |
Family
ID=22014765
Family Applications (1)
| Application Number | Title | Priority Date | Filing Date |
|---|---|---|---|
| EP94303141A Withdrawn EP0623882A3 (de) | 1993-05-05 | 1994-04-29 | System und Verfahren für die stabile Analyse von willkürlich verschobenen Datenmustern. |
Country Status (3)
| Country | Link |
|---|---|
| US (1) | US5517585A (de) |
| EP (1) | EP0623882A3 (de) |
| CA (1) | CA2122460A1 (de) |
Cited By (3)
| Publication number | Priority date | Publication date | Assignee | Title |
|---|---|---|---|---|
| EP0706142A3 (de) * | 1994-09-30 | 1996-08-07 | Sensormatic Electronics Corp | Verfahren und Vorrichtung zur Entdeckung eines Markierungsetiketts für die Warenüberwachung mit Wavelet-Transformssignalverarbeitung |
| EP0793182A1 (de) * | 1996-02-28 | 1997-09-03 | Liberty Technologies, Inc. | Vorrichtung und Verfahren zur stabilen Analyse von abgetasteten, willkürlich ausgerichteten Transienten |
| WO2000077674A1 (de) * | 1999-06-10 | 2000-12-21 | Koninklijke Philips Electronics N.V. | Erkennung eines nutzsignals in einem messsignal |
Families Citing this family (10)
| Publication number | Priority date | Publication date | Assignee | Title |
|---|---|---|---|---|
| US6353688B1 (en) * | 1993-06-08 | 2002-03-05 | The Regents Of The University Of California | Accelerated signal encoding and reconstruction using pixon method |
| JP2907790B2 (ja) * | 1997-03-25 | 1999-06-21 | 三菱電機株式会社 | 過渡解析方法およびその方法を用いた装置 |
| US6147993A (en) * | 1997-10-14 | 2000-11-14 | Cisco Technology, Inc. | Method and apparatus for implementing forwarding decision shortcuts at a network switch |
| US7085686B1 (en) * | 1999-03-05 | 2006-08-01 | General Electric Company | Method and system for canceling noise and compressing data from a motor phase angle sensor |
| JP2001109738A (ja) * | 1999-10-13 | 2001-04-20 | Toyota Motor Corp | ピーク時刻検出装置およびピーク時刻検出方法 |
| US6691051B2 (en) * | 2001-08-14 | 2004-02-10 | Tektronix, Inc. | Transient distance to fault measurement |
| US6993204B1 (en) | 2002-01-04 | 2006-01-31 | Pixon Llc | High speed signal enhancement using pixons |
| US20080309507A1 (en) * | 2007-06-12 | 2008-12-18 | Paul Gene Anderson | Self-configuring data acquisition system for diagnostic testing |
| US8839664B2 (en) | 2012-04-06 | 2014-09-23 | Siemens Energy, Inc. | Detection and classification of failures of power generating equipment during transient conditions |
| CN116499748B (zh) * | 2023-06-27 | 2023-08-29 | 昆明理工大学 | 基于改进smote和分类器的轴承故障诊断方法、系统 |
Family Cites Families (4)
| Publication number | Priority date | Publication date | Assignee | Title |
|---|---|---|---|---|
| DE3171426D1 (en) * | 1980-11-26 | 1985-08-22 | Studer Willi Ag | Method and circuit for converting the sampling frequency of a series of samples avoiding conversion into a continuous signal |
| FR2620544B1 (fr) * | 1987-09-16 | 1994-02-11 | Commissariat A Energie Atomique | Procede d'interpolation |
| JP2875263B2 (ja) * | 1988-09-21 | 1999-03-31 | ヤマハ発動機株式会社 | 画像処理方法および装置 |
| EP0454445B1 (de) * | 1990-04-26 | 1996-07-03 | Fujitsu Limited | Wellenformentzerrer mit Neuronalnetzwerk |
-
1993
- 1993-05-05 US US08/058,113 patent/US5517585A/en not_active Expired - Fee Related
-
1994
- 1994-04-28 CA CA002122460A patent/CA2122460A1/en not_active Abandoned
- 1994-04-29 EP EP94303141A patent/EP0623882A3/de not_active Withdrawn
Cited By (4)
| Publication number | Priority date | Publication date | Assignee | Title |
|---|---|---|---|---|
| EP0706142A3 (de) * | 1994-09-30 | 1996-08-07 | Sensormatic Electronics Corp | Verfahren und Vorrichtung zur Entdeckung eines Markierungsetiketts für die Warenüberwachung mit Wavelet-Transformssignalverarbeitung |
| EP0793182A1 (de) * | 1996-02-28 | 1997-09-03 | Liberty Technologies, Inc. | Vorrichtung und Verfahren zur stabilen Analyse von abgetasteten, willkürlich ausgerichteten Transienten |
| WO2000077674A1 (de) * | 1999-06-10 | 2000-12-21 | Koninklijke Philips Electronics N.V. | Erkennung eines nutzsignals in einem messsignal |
| US6631281B1 (en) * | 1999-06-10 | 2003-10-07 | Koninklijke Philips Electronics N.V. | Recognition of a useful signal in a measurement signal |
Also Published As
| Publication number | Publication date |
|---|---|
| CA2122460A1 (en) | 1994-11-06 |
| US5517585A (en) | 1996-05-14 |
| EP0623882A3 (de) | 1995-02-15 |
Similar Documents
| Publication | Publication Date | Title |
|---|---|---|
| US5517585A (en) | System and method for stable analysis of sampled transients arbitrarily aligned with their sample points | |
| CA2401685C (en) | Complex signal decomposition and modeling | |
| US5799114A (en) | System and method for stable analysis of sampled transients arbitrarily aligned with their sample points | |
| Kostelich et al. | Noise reduction in chaotic time-series data: A survey of common methods | |
| US7634382B2 (en) | Diagnostic device for use in process control system | |
| CN102944583B (zh) | 基于漂移补偿的金属氧化物气体传感器阵列浓度检测方法 | |
| CN108414240B (zh) | 一种检测机器异常振动的方法与装置 | |
| US20040078160A1 (en) | Method, computer program, and system for intrinsic timescale decomposition, filtering, and automated analysis of signals of arbitrary origin or timescale | |
| Whitcher et al. | Multiscale detection and location of multiple variance changes in the presence of long memory | |
| US20180252741A1 (en) | Method and device for determining machine speeds | |
| CN119845486B (zh) | 一种石油测井传感器综合检测系统及方法 | |
| CN118427731A (zh) | 电力检测方法、装置、设备及存储介质 | |
| CN115736906A (zh) | 一种利用谱估计法提高dpoae测试正确率的方法 | |
| CN117390568B (zh) | 基于增强Transformer模型的芯片封装丝网印刷机的异常检测方法 | |
| US20260104318A1 (en) | Method and monitoring system for detecting a fault in a machine | |
| Simon et al. | On the TT-transform and its diagonal elements | |
| US6463388B1 (en) | Method and system for attenuation of acquisition geometry imprint in seismic data | |
| Skarlatoudis et al. | Determination of noise spectra from strong motion data recorded in Greece | |
| Nyunt et al. | Parametric Wiener filter based on image power spectrum sparsity | |
| Aiello et al. | A comparison of spectrum estimation techniques for nonstationary signals in induction motor drive measurements | |
| US7702143B2 (en) | Method and apparatus for identifying MICR characters | |
| EP3242127A1 (de) | Verfahren und system zur flüssigkeitsdetektion | |
| CN111883141B (zh) | 一种文本半相关的声纹识别方法及系统 | |
| Tumer et al. | Monitoring of signals from manufacturing processes using the Karhunen–Loeve transform | |
| US20050076072A1 (en) | Symbol points estimating device, method and program, recording medium on which the program is recorded, and modulation analyzing device |
Legal Events
| Date | Code | Title | Description |
|---|---|---|---|
| PUAI | Public reference made under article 153(3) epc to a published international application that has entered the european phase |
Free format text: ORIGINAL CODE: 0009012 |
|
| AK | Designated contracting states |
Kind code of ref document: A2 Designated state(s): AT BE CH DE DK ES FR GB GR IE IT LI LU MC NL PT SE |
|
| PUAL | Search report despatched |
Free format text: ORIGINAL CODE: 0009013 |
|
| AK | Designated contracting states |
Kind code of ref document: A3 Designated state(s): AT BE CH DE DK ES FR GB GR IE IT LI LU MC NL PT SE |
|
| 17P | Request for examination filed |
Effective date: 19950815 |
|
| STAA | Information on the status of an ep patent application or granted ep patent |
Free format text: STATUS: THE APPLICATION IS DEEMED TO BE WITHDRAWN |
|
| 18D | Application deemed to be withdrawn |
Effective date: 19981103 |