EP0652449A2 - Méthode de mesure de rayonnement gamma dans un sondage par utilisant de décroissance de neutrons pulsés pour la collisions non-élastique à neutrons rapide et la capture de neutrons thermique - Google Patents
Méthode de mesure de rayonnement gamma dans un sondage par utilisant de décroissance de neutrons pulsés pour la collisions non-élastique à neutrons rapide et la capture de neutrons thermique Download PDFInfo
- Publication number
- EP0652449A2 EP0652449A2 EP94630043A EP94630043A EP0652449A2 EP 0652449 A2 EP0652449 A2 EP 0652449A2 EP 94630043 A EP94630043 A EP 94630043A EP 94630043 A EP94630043 A EP 94630043A EP 0652449 A2 EP0652449 A2 EP 0652449A2
- Authority
- EP
- European Patent Office
- Prior art keywords
- logging
- well
- burst
- energy spectrum
- tool
- Prior art date
- Legal status (The legal status is an assumption and is not a legal conclusion. Google has not performed a legal analysis and makes no representation as to the accuracy of the status listed.)
- Granted
Links
- 238000001228 spectrum Methods 0.000 title claims abstract description 140
- 230000005855 radiation Effects 0.000 title claims description 72
- 230000003595 spectral effect Effects 0.000 claims description 92
- 238000013500 data storage Methods 0.000 claims description 79
- 238000004611 spectroscopical analysis Methods 0.000 claims description 71
- 230000005251 gamma ray Effects 0.000 claims description 68
- 230000015572 biosynthetic process Effects 0.000 claims description 55
- 238000000034 method Methods 0.000 claims description 35
- 238000010304 firing Methods 0.000 claims description 32
- 230000008569 process Effects 0.000 claims description 3
- 230000001939 inductive effect Effects 0.000 claims 2
- 238000005755 formation reaction Methods 0.000 description 35
- 238000010586 diagram Methods 0.000 description 27
- 230000004044 response Effects 0.000 description 17
- 238000012163 sequencing technique Methods 0.000 description 11
- 230000008901 benefit Effects 0.000 description 7
- FVAUCKIRQBBSSJ-UHFFFAOYSA-M sodium iodide Chemical compound [Na+].[I-] FVAUCKIRQBBSSJ-UHFFFAOYSA-M 0.000 description 6
- OKTJSMMVPCPJKN-UHFFFAOYSA-N Carbon Chemical compound [C] OKTJSMMVPCPJKN-UHFFFAOYSA-N 0.000 description 5
- 230000004913 activation Effects 0.000 description 5
- QVGXLLKOCUKJST-UHFFFAOYSA-N atomic oxygen Chemical compound [O] QVGXLLKOCUKJST-UHFFFAOYSA-N 0.000 description 5
- 229910052799 carbon Inorganic materials 0.000 description 5
- 230000006870 function Effects 0.000 description 5
- 229910052760 oxygen Inorganic materials 0.000 description 5
- 239000001301 oxygen Substances 0.000 description 5
- VYPSYNLAJGMNEJ-UHFFFAOYSA-N Silicium dioxide Chemical compound O=[Si]=O VYPSYNLAJGMNEJ-UHFFFAOYSA-N 0.000 description 4
- 238000005259 measurement Methods 0.000 description 4
- 239000004215 Carbon black (E152) Substances 0.000 description 3
- 230000009977 dual effect Effects 0.000 description 3
- 239000013505 freshwater Substances 0.000 description 3
- 229930195733 hydrocarbon Natural products 0.000 description 3
- 150000002430 hydrocarbons Chemical class 0.000 description 3
- 235000019738 Limestone Nutrition 0.000 description 2
- 230000009172 bursting Effects 0.000 description 2
- 230000008859 change Effects 0.000 description 2
- 239000013078 crystal Substances 0.000 description 2
- 238000001514 detection method Methods 0.000 description 2
- 230000006872 improvement Effects 0.000 description 2
- 230000010354 integration Effects 0.000 description 2
- 230000003993 interaction Effects 0.000 description 2
- 239000006028 limestone Substances 0.000 description 2
- 230000004048 modification Effects 0.000 description 2
- 238000012986 modification Methods 0.000 description 2
- 239000003027 oil sand Substances 0.000 description 2
- 239000004576 sand Substances 0.000 description 2
- 229940083599 sodium iodide Drugs 0.000 description 2
- 235000009518 sodium iodide Nutrition 0.000 description 2
- XLYOFNOQVPJJNP-UHFFFAOYSA-N water Substances O XLYOFNOQVPJJNP-UHFFFAOYSA-N 0.000 description 2
- OYPRJOBELJOOCE-UHFFFAOYSA-N Calcium Chemical compound [Ca] OYPRJOBELJOOCE-UHFFFAOYSA-N 0.000 description 1
- 101000970561 Homo sapiens Myc box-dependent-interacting protein 1 Proteins 0.000 description 1
- 102100021970 Myc box-dependent-interacting protein 1 Human genes 0.000 description 1
- 229910052791 calcium Inorganic materials 0.000 description 1
- 239000011575 calcium Substances 0.000 description 1
- 230000007423 decrease Effects 0.000 description 1
- 230000000694 effects Effects 0.000 description 1
- 230000004907 flux Effects 0.000 description 1
- 239000007789 gas Substances 0.000 description 1
- 239000000203 mixture Substances 0.000 description 1
- 239000002245 particle Substances 0.000 description 1
- 239000000377 silicon dioxide Substances 0.000 description 1
- BKVIYDNLLOSFOA-UHFFFAOYSA-N thallium Chemical compound [Tl] BKVIYDNLLOSFOA-UHFFFAOYSA-N 0.000 description 1
- 229910052716 thallium Inorganic materials 0.000 description 1
Images


Classifications
-
- G—PHYSICS
- G01—MEASURING; TESTING
- G01V—GEOPHYSICS; GRAVITATIONAL MEASUREMENTS; DETECTING MASSES OR OBJECTS; TAGS
- G01V5/00—Prospecting or detecting by the use of ionising radiation, e.g. of natural or induced radioactivity
- G01V5/04—Prospecting or detecting by the use of ionising radiation, e.g. of natural or induced radioactivity specially adapted for well-logging
- G01V5/08—Prospecting or detecting by the use of ionising radiation, e.g. of natural or induced radioactivity specially adapted for well-logging using primary nuclear radiation sources or X-rays
- G01V5/10—Prospecting or detecting by the use of ionising radiation, e.g. of natural or induced radioactivity specially adapted for well-logging using primary nuclear radiation sources or X-rays using neutron sources
- G01V5/104—Prospecting or detecting by the use of ionising radiation, e.g. of natural or induced radioactivity specially adapted for well-logging using primary nuclear radiation sources or X-rays using neutron sources and detecting secondary Y-rays as well as reflected or back-scattered neutrons
Definitions
- This invention relates to well logging tools for emitting a series of neutron bursts into a formation and detecting gamma radiation emitted by the formation in response to the neutron bursts, and in particular, to a well logging tool for measuring inelastic energy spectra of the resultant gamma radiation.
- Prior art well logging tools have been used for emitting pulses of fast neutrons and detecting a resultant gamma radiation from a formation.
- Fast neutrons are generated in pulses, or bursts, of neutron emissions and typically have an initial energy level of 14 MeV.
- the detected resultant gamma radiation is utilized to determine various formation parameters, such as porosity, lithology, water saturation, and hydrocarbon saturation.
- prior art well logging tools are typically operated in either a sigma logging mode or a spectroscopy logging mode.
- Prior art well logging tools which are operated in the sigma logging mode have been used during the last thirty years for logging wells to determine thermal neutron capture cross sections, or sigma, for formations.
- prior art well logging tools which are operated in the spectroscopy logging mode have been developed for measuring inelastic energy spectra for the gamma rays which are emitted as a result of inelastic collisions between the fast neutrons and formation nuclei.
- the inelastic energy spectra measured during a spectroscopy logging mode contain signature energy peaks which may be processed to determine the relative amounts of particular types of nuclei included within a formation. For example, when nuclei of carbon and oxygen are impacted by fast neutrons having energy levels which range from 5 MeV to 14 MeV, or greater, gamma radiation having gamma rays at discrete energy levels are emitted as a result of the impacts, or collisions. These discrete energy levels of emitted gamma rays are different for nuclei of carbon than for nuclei of oxygen, providing signature peaks in the detected energy spectra for a formation interval.
- Prior art logging tool detectors have been used for measuring inelastic spectra to determine the relative amounts of these discrete energy levels from gamma radiation energy spectrum data samples. Although these discrete energy levels are “smeared” together by compton scattering and the response characteristics of logging tool detector means, they still may be used to provide characteristics of the formation, such as, for example, a Carbon/Oxygen ratio, or "C/O" ratio. Other ratios may also be determined. These ratios may then be used for determining formation parameters, such as distinguishing tight formations from gas, oil from fresh water, and determining lithology.
- Prior art well logging tools typically determine an inelastic energy spectrum by taking a total gamma ray energy spectrum data sample during a series of neutron bursts, and then deducting a thermal neutron capture energy spectrum from the total gamma ray energy spectrum.
- the thermal neutron capture energy spectrum is determined by detecting thermal neutron capture energy spectral counts during the decay periods following the neutron bursts, and then, in some instances, multiplying these spectral counts by a fixed scaling factor. This method for determining the thermal neutron capture energy spectrum is less accurate than if a gamma ray energy decay rate were to be determined for the decay periods of the data sample and used for determining the capture component of the gamma ray energy spectrum.
- spectroscopy logging modes for tool operating cycles of prior art well logging tools include firing cycles which have decay periods which do not extend for several lifetimes of thermal neutrons within a formation. This results in data samples which are less accurate for determining thermal neutron decay rates during prior art spectroscopy logging modes than if the decay periods were extended for several lifetimes, as some prior art well logging tools do when operated in a capture operating mode.
- tool operating cycles for operating prior art well logging tools in spectroscopy logging modes generally include firing cycles having short neutron burst durations, as compared to some prior art well logging tools when operated in sigma mode.
- a longer spectroscopy mode neutron burst duration allows for more accurate measurement of inelastic energy spectra.
- a well logging tool for emitting neutron bursts, and determining inelastic energy spectra and thermal neutron capture cross sections during a single logging pass over a well depth interval.
- Inelastic energy spectra are determined, in part, by measuring exponential decay rates for thermal neutron capture events which occur during decay periods extending for at least several thermal neutron lifetimes following each of the neutron bursts, and by using the measured exponential decay rates to project from thermal neutron capture spectra detected during the decay periods a value for thermal neutron capture components of the total energy spectra detected during neutron burst periods.
- the well logging tool of the preferred embodiment of the present invention detects gamma radiation induced in response to interaction of the neutron bursts with earth formations.
- the well logging tool is operable in a dual logging mode having a tool timing cycle in which the duration of the neutron bursts is varied between a spectroscopy logging mode and a sigma logging mode for detecting inelastic energy spectra and thermal neutron capture cross section, respectively, during a single logging pass over a well depth interval.
- inelastic energy spectra are determined by subtracting from a total gamma ray energy spectrum detected during the neutron bursts a burst thermal neutron capture energy spectrum.
- the burst thermal neutron capture energy spectra are determined by projecting, into the burst measurement time frame, a measured exponential thermal neutron decay rate curve from thermal neutron capture gamma ray energy spectra detected in decay periods following the neutron bursts.
- the preferred tool timing cycle for the spectroscopy logging mode includes a decay period which extends after each burst of fast neutrons for at least several lifetimes of the thermal neutrons to provide adequate time for measuring the exponential thermal neutron decay rate of gamma radiation emitted by the formation in response to thermal neutron capture.
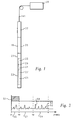
- Figure 1 is an elevational view which schematically depicts the well logging tool of the preferred embodiment of the present invention.
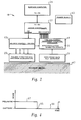
- Figure 2 is a block diagram which schematically depicts hardware for the well logging tool of the preferred embodiment of the present invention.
- Figure 3 is timing diagram depicting operation of the well logging tool of the preferred embodiment of the present invention in a spectroscopy logging mode firing cycle to illustrate the sequence for emitting a neutron burst and detecting gamma radiation emitted in response to inelastic and capture events resulting from the neutron burst.
- Figure 4 is a timing diagram depicting operation of the well logging tool of the preferred embodiment of the present invention over a tool operating cycle.
- Figure 5 is a timing diagram which depicts sequencing of gamma ray spectral energy channel counts into particular data storage bins during a spectroscopy firing cycle, during which the well logging tool of the preferred embodiment of the present invention is operated in the spectroscopy logging mode.
- Figure 6 is a timing diagram which depicts sequencing of gamma ray spectral energy channel counts into particular data storage bins during a sigma firing cycle, during which the well logging tool of the preferred embodiment of the present invention is operated in the sigma logging mode.
- Figure 7 is an illustrative diagram depicting hypothetical inelastic energy spectra for gamma radiation detected by the well logging tool of the preferred embodiment of the present invention.
- Figure 8 is an illustrative diagram depicting hypothetical thermal neutron capture energy spectra for gamma radiation detected by the well logging tool of the preferred embodiment of the present invention.
- Figure 9 is a synchronization diagram which graphically depicts a preferred method of the present invention for processing a data sample collected during the spectroscopy logging mode and determining the inelastic component of the energy spectrum detected during the burst periods.
- Figure 10 is a synchronization diagram which graphically depicts an alternative method of the present invention for processing a data sample collected during the spectroscopy logging mode and determining the inelastic component of the energy spectrum detected during the burst periods.
- Figure 11 is a block diagram depicting application of the preferred method of Figure 9 for processing a data sample recorded during the spectroscopy logging mode with the well logging tool of the present invention.
- Figure 12 is a block diagram depicting application of the alternative method of Figure 10 for processing a data sample recorded during the spectroscopy logging mode with a well logging tool of the alternative embodiment of the present invention.
- FIG. 1 an elevational view schematically depicts well logging tool 19 of the preferred embodiment of the present invention.
- Well logging tool 19 includes housing 21 within which various tool components are included for operating within wells.
- Well logging tool 19 includes sonde 23 .
- Sonde 23 includes pulsed neutron source 25 , radiation shield 27 , and gamma ray detector 29 .
- Gamma ray detector 29 includes scintillation crystal 31 and photo-multiplier tube 33 .
- pulsed neutron source 25 is a prior art particle accelerator for creating pulses of fourteen MeV neutrons.
- gamma ray detector 29 is a prior art detector in which the scintillation crystal is formed from sodium-iodide which is doped with thallium.
- Photomultiplier tube 33 is a prior art high count rate photomultiplier tube.
- Well logging tool 19 further includes downhole hardware 35 , sonde controller 37 , and surface computer 39 .
- Surface computer 39 is connected to the downhole portion of well logging tool 19 by wireline 41 .
- Downhole hardware 35 provides counter hardware for operation of well logging tool 19
- sonde controller 37 provides downhole control for operation of well logging tool 19 .
- FIG. 2 a block diagram schematically depicts well logging tool 19 of the preferred embodiment of the present invention.
- Power supply 43 powers well logging tool 19 .
- Sonde controller 37 controls downhole operation of well logging tool 19 , in conjunction with surface computer 39 .
- controller 37 sends a pulse to source control/driver 45 to cause neutron source 25 to emit a burst of fast neutrons, having an energy level of 14 MeV.
- the burst of neutrons interacts with nuclei within incident media 47 , which include both the borehole and adjoining formation, to induce emission of gamma radiation.
- This emitted gamma radiation is caused by activation of nuclei, inelastic collisions between neutrons having energy levels ranging from 5 to 14 MeV and above with nuclei, and capture of thermal neutrons by nuclei.
- Detector 29 detects gamma radiation and emits an output data signal, or pulse, having a voltage which is proportional to the energy level of particular gamma rays of the gamma radiation detected.
- Gamma ray detector 29 then emits the gamma ray pulses to downhole hardware 35 , which includes counting hardware 49 .
- a discriminator and data storage bins are provided by counting hardware 49 .
- the discriminator and counting hardware 49 receive output data signals from detector 29 , and sort these output signals according to output voltage values for storing as counts in the different data storage bins over time. Since the output voltage values for the output signals from detector 29 are proportional to the energy of gamma radiation detected, counts above a certain minimum energy level are output in at least one of five spectral energy channels. Each separate spectral energy channel passes detected counts into a specific data storage bin within counting hardware 49 . Counts are therein accumulated for storage over several firing cycles to provide a data sample.
- Surface computer 39 periodically signals controller 37 to output a data sample from counting hardware 49 for passing uphole for processing within surface computer 39 .
- computer 39 serves as a processor for processing the data and outputting processed data which includes certain formation parameters.
- Output data includes parameters which can be further processed to indicate formation properties such as porosity, water saturation, and hydrocarbon saturation.
- FIG. 3 a timing diagram schematically depicts operation of well logging tool 19 in a spectroscopy logging mode firing cycle to illustrate the sequence for emitting a neutron burst and detecting gamma radiation emitted in response to inelastic collisions and capture events resulting from the neutron burst.
- Neutron burst 51 occurs, emitting fast neutrons into a borehole and formation.
- Output data signal 53 is passed from detector 29 to downhole hardware 35 (shown in Figure 2 ).
- Burst time period 55 occurs during neutron burst 51 , between T1 and T0 . Then follows intermediate time period 57 between T0 and T2 .
- capture time period 59 after T2 .
- burst time period 55 gamma radiation is detected which results from a mixture of both inelastic and capture events.
- gamma radiation emitted in response to thermal neutron capture events predominates.
- high energy output data signal 61 is shown which represents detection of a high energy gamma ray photon.
- Low energy output data signal 63 is shown which represents detection of a lower energy gamma ray photon.
- Output data signal 53 is processed by counting hardware 49 (shown in Figure 2 ) to determine which spectral channel, during a measurement time frame, output data signal 53 will be passed through for storing in the data storage bins of counting hardware 49 (shown in Figure 2 ).
- Tool operating cycle 65 includes a spectroscopy logging mode period 67 , and sigma logging mode period 69 .
- spectroscopy logging mode period 67 a data sample is accumulated by measuring gamma radiation which occurs in response to a number of neutron bursts. The number of neutron bursts typically depends on when surface computer 39 (shown in Figure 2 ) instructs controller 37 (shown in Figure 2 ) to pass a data sample uphole.
- a data sample may be accumulated from gamma rays emitted in response to around 500 neutron bursts.
- a value for sigma ( ⁇ ) is determined by measuring the decay rate tau ( ⁇ ), in microseconds ( ⁇ sec), for a well depth interval, and then dividing the value for tau ( ⁇ ), in microseconds, into 4550 to determine the value for sigma ( ⁇ ) in capture units (c.u.).
- a timing diagram depicts sequencing of gamma ray spectral channel energy counts into particular data storage bins during spectroscopy neutron burst firing cycle 71 when the well logging tool of the preferred embodiment of the present invention is operated in the spectroscopy logging mode.
- Data is sorted into five spectral channels, spectral channel 77 , spectral channel 79 , spectral channel 81 , spectral channel 83 and spectral channel 85 .
- Spectral channel 77 passes counts which represents gamma ray photons having an energy above 105 KeV, for indicating a total number of, or bulk, thermal neutron capture events.
- Spectral channel 79 passes counts which represent gamma ray photons having an energy level between 1.6 and 2.4 MeV, and the number of counts representing inelastic events is an indicator of the amount of silica in a formation.
- Spectral channel 81 passes counts which represent gamma ray photons having an energy level ranging from 2.4 to 3.4 MeV, of which the number of counts from inelastic events is representative of the amount of calcium in formation.
- Spectral channel 83 passes counts representing gamma ray photons having an energy level ranging from 3.4 to 4.5 MeV, and the number of counts representing inelastic events is indicative of the amount of carbon in a formation.
- Spectral channel 85 passes counts which represent detected gamma ray photons having energy levels ranging from 4.5 to 8 MeV, and the number of counts from inelastic events is representative of the amount of oxygen in a formation.
- Combinations of the ratios of the number of counts accumulated in data storage bins after passing through the different spectral channels can be analyzed for determining different formation parameters. For example, the number of counts accumulated in a sample after passing through spectral channel 83 into a specific data storage bin, such as data storage bin I3 , can be divided by the number of counts accumulated in a data sample after passing through spectral channel 85 and into data storage bin I4 to determine a carbon/oxygen ratio, abbreviated as "C/O ratio”.
- C/O ratio carbon/oxygen ratio
- data storage bins 1 through 12 are utilized over various time intervals for accumulating counts which pass through spectral channel 77 .
- Bins 1 and 2 store counts which are accumulated during initial neutron burst 75 .
- Bins I1 and C1 store counts accumulated during the time intervals as shown.
- Data storage bins I1 , I2 , I3 , and I4 are utilized for accumulating a total gamma ray energy spectrum detected during a spectroscopy logging mode period of a tool operating cycle.
- Bins C1 , C2 , C3 , and C4 accumulate counts for determining a thermal neutron capture gamma ray energy spectrum detected during a plurality of decay periods which provide a sample collected during a spectroscopy logging mode period of the tool operating cycle. Bins 1 through 12 , which collect counts from spectral channel 77 over different times, are provided for determining a thermal neutron capture event gamma ray decay rate, as is discussed below.
- Table A listed below, identifies the data storage time intervals for sequencing gamma ray spectral channel counts into particular data storage bins during spectroscopy firing cycle 71 of the spectroscopy logging mode depicted in Figure 5 . It should be noted that during the spectroscopy logging mode, in which spectroscopy burst firing cycle 71 is utilized, the value for tau ( ⁇ ) is held at a constant value of 70 microseconds.
- the first column indicates a particular data storage bin alphanumeric identifier.
- the second column indicates the time between the beginning of an initial neutron burst and the beginning of sequencing counts into the indicated bin.
- the third column indicates the time interval over which counts are sequenced into a particular data storage bin.
- a timing diagram depicts sequencing of gamma ray spectral energy channel counts into particular data storage bins during sigma firing cycle 73 when the well logging tool 19 is operated in the sigma logging mode.
- Operation of well logging tool 19 in the sigma logging mode for sequencing data storage counts from spectral channels 77 , 79 , 81 , 83 and 85 into the appropriate data storage bins occurs as discussed for the spectroscopy logging mode, except that timing for the different events is changed.
- tau ( ⁇ ) from the previous sigma logging mode data sample is utilized for controlling the data storage time intervals.
- spectral channels 1 through 12 are utilized for determining formation parameters in the sigma logging mode.
- Table B listed below, identifies the data storage time intervals for sequencing gamma ray spectral channel counts into particular data storage bins during sigma firing cycle 73 of the sigma logging mode depicted in Figure 6 . It should be noted that during the sigma logging mode, in which sigma firing cycle 73 is utilized, the first column indicates the bin numeric identifier. The second column indicates the time between the beginning of an initial neutron burst and the beginning of sequencing counts into the indicated bin. The third column indicates the width or time interval over which counts are sequenced into the particular data storage bin.
- an illustrative diagram depicts hypothetical inelastic energy spectra for gamma radiation detected by well logging tool 19 .
- the inelastic energy spectra includes three separate spectrums, spectrum 93 which is representative of a saltwater sand, spectrum 95 which is representative of an oil sand, and spectrum 97 which is representative of a freshwater limestone formation.
- First segment 99 of the inelastic spectra represents total counts occurring over an energy range which corresponds to spectral channel 79 , which would be accumulated in data storage bin I1 .
- Second segment 101 represents the total counts occurring during a data sample from spectral channel 81 , which would be accumulated in data storage bin I2 .
- Third section 103 represents the total number of counts occurring in a data sample from spectral channel 83 , which would be accumulated in data storage bin I3 .
- fourth segment 105 of the inelastic spectrum represents the total number of counts detected over an energy range which is representative of spectral channel 85 , which would be accumulated in data storage bin I4 .
- an illustrative diagram depicts hypothetical thermal neutron capture energy spectra for gamma radiation detected by well logging tool 19 of the preferred embodiment of the present invention.
- the inelastic energy spectra include three separate spectra, spectrum 107 which is representative of a saltwater sand, spectrum 109 which is representative of an oil sand, and spectrum 111 which is representative of a freshwater limestone formation.
- the different spectral energy channels are represented by different segments of the capture spectrum. Counts accumulated over segment 113 of the capture spectrum from spectral channel 79 would be accumulated within bin C1 during a sigma logging mode period of a tool cycle.
- counts occurring within segment 115 would pass through spectral channel 81 and accumulate in data storage bin C2 .
- Counts plotting within segment 117 pass through spectral channel 83 and accumulate in data storage bin C3 .
- Counts occurring within segment 119 pass through spectral channel 85 and accumulate in data storage bin C4 .
- Figures 7 and 8 depict hypothetical inelastic energy spectrum and hypothetical capture energy spectra.
- the resolution depicted for the spectra in Figures 7 and 8 is for illustrating the spectra which different types of formations would emit.
- These are hypothetical spectra for a logging tool response from a 1-inch sodium-iodide detector run in 7-inch casing which is cemented within a 10-inch borehole.
- well logging tool 19 of the preferred embodiment of the present invention would accumulate only a total count rate for each of the spectral channels in data storage bins, and not the much greater resolution as depicted in Figures 7 and 8 .
- the spectra detected for Figures 7 and 8 would be the number of counts occurring over an energy range corresponding to each of the different segments depicted within each of the different sectors of the Figures 7 and 8 .
- a synchronization diagram graphically depicts a preferred method of the present invention for processing a data sample measured during a spectroscopy logging mode period.
- the synchronization diagram schematically displays the rate of buildup and decay of spectral emissions for a data sample in relation to the timing of the various firing cycle burst and decay periods of the spectroscopy logging mode period over which the data sample is collected.
- a data sample is actually collected over a plurality of firing cycles, and not over a singular firing cycle.
- a data sample for the spectroscopy logging mode is typically collected over approximately 500 firing cycles.
- the natural logarithms of count rates for the data sample are plotted against effective rate times, in microseconds, for sequencing counts into the various data storage bins according to the spectroscopy logging mode firing cycle depicted in Figure 5 .
- This correlates, or synchronizes, the counts collected in various data storage bins with the neutron bursts and decay periods of the different firing cycles of the spectroscopy logging mode period within which the data sample is collected.
- the portion of the synchronization diagram which corresponds to the burst periods is depicted by neutron burst 121 .
- Count rates are determined from each of the various data storage bins by dividing the total number of counts for each bin by the duration, or length of time, for which gamma ray counts are collected within the bin.
- An effective rate time is assigned to the count rate for each bin of a data sample.
- the term effective rate time is herein defined as the time during the spectroscopy logging mode firing cycle at which a count rate for a particular bin is assigned to occur.
- the count rates for each bin are assigned to occur at the median point of the total number of counts for each bin, that is, at a time at which half of the total counts for each bin have occurred. In other embodiments of the present invention, alternative rate times may be assigned.
- a decay equation representing an exponential decay of count rates during the decay periods is fitted to count rates and effective rate times for the data sample.
- the equation chosen for representing an exponential decay of count rates provides a linear plot when the natural logarithm of count rates are plotted against time, as shown in Figure 9 .
- the rate times for the count rates for each bin are determined using the decay equation for an exponential decay of count rates over time, and the actual decay rate, or tau ( ⁇ ), determined from a previous data sample. It should be noted that although the gating, or timing, does not change for sequencing counts into the various data storage bins during the spectroscopy logging mode, the rate times are still determined for each data sample since the decay rate, or the value of tau ( ⁇ ) used in the decay equation, determines the shape of the count rate decay curve for the data sample, and thus determines when half of the counts would be stored in each bin during a firing cycle for the data sample. Thus, the rate times change with the decay rate, which is determined by the value of tau ( ⁇ ) used in the exponential decay rate equation.
- the count rates calculated for data storage bins 5 through 9 , of Figure 5 and Table A are plotted against the rate times determined for each bin to provide data points 133 , 135 , 137 , 139 , and 141 , respectively.
- the decay equation representing an exponential rate of decay in gamma radiation count rates over time is then fitted to data points 133 , 135 , 137 , 139 , and 141 , from first spectral energy channel 77 , to provide curve 123 .
- Curve 123 represents the decay rate over time for detected gamma radiation which would be passed through the first spectral channel 77 .
- the capture count rates at a specific time, for each spectral energy channel are presumed to be a function of the neutron population at that specific time. According to this presumption, the capture count rates for each spectral energy channel are presumed to be a function of the declining neutron population during the decay periods after the neutron bursts. As the neutron population declines, according to the above presumption, the count rates corresponding to different energy levels of gamma radiation will also decline at the same rate as the neutron population.
- the rate of decay of all of the spectral energy channels are presumed to be parallel functions of the same neutron population at any given moment. Thus, the rate of decay for one spectral channel during a particular data sample is presumed to be the same rate of decay for the other spectral energy channels, during that particular data sample.
- curve 123 represents the rate of decay of spectral energy channel 77 .
- Curve 123 is determined by fitting an exponential equation to data points 133 , 135 , 137 , 139 , and 141 . Since the rate of decay is presumed to be the same for all spectral energy channels, curves 125 , 127 , 129 , and 131 are taken to be parallel to curve 123 , which are all determined by parallel functions of the declining neutron population for the data sample.
- Data points 145 , 149 , 153 , and 157 represent the count rates and effective rate times for data storage bins C1 , C2 , C3 , and C4 , respectively.
- the slope of curve 123 which represents the rate of decay of the declining neutron population over time, is used to project through data points 145 , 149 , 153 , and 157 , from the other spectral energy channels, to determine curves 125 , 127 , 129 , and 131 , which extend parallel to curve 123 .
- Curves 125 , 127 , 129 , and 131 represent the rate of decay of the spectral energy channels 79 , 81 , 83 , and 85 , respectively.
- curve 123 is projected from data points representing the counts collected in bins 3 and 4 to the end of neutron burst 121 to determine data point 143 , which represents the rate of thermal neutron capture gamma radiation occurring at the end of neutron burst 121 , at time T0 .
- curve 125 having the slope of curve 123 , is projected through data point 145 to determine data point 147 .
- Data point 147 represents the count rate of thermal neutron capture gamma radiation which is occurring at time T0 , at the end of neutron burst 121 , and which has an energy level which ranges from 1.6 MeV to 2.4 MeV.
- This procedure is repeated to project curve 127 from data point 149 to time T0 and determine data point 151 , to project curve 129 from data point 153 to time T0 and determine data point 155 , and to project curve 131 data point 157 to time T0 and determine data point 159 .
- the count rates attributable to the capture component for the total number of counts accumulated in each of data storage bins 1 and 2 , I1 , I2 , I3 and I4 are determined by solving for integrals of an exponential buildup equation, which represents an exponential rate of buildup during neutron bursts 121 , using count rates 143 , 147 , 151 , 155 , and 159 to represent the final count rate at the end of the bursts.
- the exponential buildup equation is solved to determine a rate for the capture component for each spectral channel, for each of data storage bins 1 and 2 , I1 , I2 , I3 and I4 .
- the integrals for the buildup equation are solved using tau ( ⁇ ) calculated for the data sample and including one of the points 143 , 147 , 151 , 155 , and 159 which each correspond to a particular spectral energy channel.
- the buildup equation is fitted to pass through the particular data point when integrated to determine a count rate attributable to thermal neutron capture gamma radiation which will be stored in each of these different data storage bins during bursts 121 .
- the buildup equation is integrated for the other spectral channels, using data points 147 , 151 , 155 , and 159 , to determine data points 161 , 163 , 165 , 167 and 169 , respectively, which represent the count rates attributable to thermal neutron capture events which would pass through the different spectral channels and be stored in the data storage bins I1 , I2 , I3 and I4 , respectively, during burst 121 , at effective rate time T E .
- the rates for the thermal neutron capture component of the total gamma radiation spectral emissions detected during neutron burst 121 can be stripped out of the rates for the total gamma radiation detected for the combination of data storage bins 1 and 2 , data storage bin I1 , data storage bin I2 , data storage bin I3 , and data storage bin I4 .
- the inelastic component for spectral channel 77 is determined by subtracting the count rate of data point 161 , which is attributable to thermal neutron capture events, from the count rate of data point 171 , representing the total number of counts accumulated in data storage bins 1 and 2 , to determine the inelastic component for spectral channel 77 .
- This procedure is followed to determine the inelastic components for channels 79 , 81 , 83 , and 85 by subtracting count rates represented by data points 163 , 165 , 167 , and 169 from count rates represented by data points 173 , 175 , 177 , and 179 , respectively, at effective rate time T E .
- the inelastic rates can then be processed to determine the ratios from which various formation parameters may be determined.
- a synchronization diagram graphically depicts an alternative method of the present invention for processing a data sample measured during the spectroscopy logging mode with well logging tool 19 .
- the synchronization diagram schematically displays the rate of buildup and decay of spectral emissions for gamma radiation emitted during a spectroscopy logging mode period, over which the data sample is collected, in relation to the timing of the various firing cycle burst and decay periods of the spectrum logging mode period.
- an actual data sample for the spectroscopy logging mode would be collected by detecting and storing count rates over approximately 500 firing cycles to determine a statistically acceptable data sample.
- the equation chosen for representing an exponential decay of count rates provides a linear plot when the natural logarithms of count rates are plotted against time.
- the decay equation is fitted to the data similar to the decay equation for Figure 9 , except that rather than projecting the equation to time T0 at the end of burst 121 , the decay equation is projected to time T ⁇ which is an arbitrarily chosen to occur 10 microseconds ( ⁇ sec) before time T0 , which is at the end of burst 121 .
- Count rates are determined from each of the various data storage bins for counts occurring during the decay periods by dividing the total number of counts for each bin by the duration, or length of time, for which gamma ray counts are collected within the bin.
- An effective rate time is assigned to the count rate for counts stored in each bin during the decay periods of a data sample.
- the count rates for counts occurring during the decay periods are assigned to occur at the median point of the total number of counts for each bin, that is, at a time at which half of the total counts for each bin have occurred.
- the rate times for the count rates for counts occurring during the decay periods are determined using the decay equation for an exponential decay of count rates over time, and the actual decay rate, or tau ( ⁇ ), determined from a previous data sample.
- rate curves 181 , 183 , 185 , 187 , and 189 represent the count rate of thermal neutron capture gamma radiation emissions occurring for spectral energy channels 77 , 79 , 81 , 83 and 85 , respectively. Similar to curve 123 discussed in reference to Figure 9 above, curve 181 in Figure 10 is determined using data points 191 , 193 , 133 , 135 , and 137 which represent data storage bins 3 , 4 , 5 , 6 and 7 , respectively. The slope of curve 181 is then used in conjunction with data points 145 , 149 , 153 , and 157 to determine rate curves 183 , 185 , 187 , and 189 , respectively.
- rate curves are projected through points 145 , 149 , 153 , 157 for each of the different spectral channels, using the slope of rate curve 181 , to determine data points 195 , 197 , 199 , 201 and 203 , respectively, which are arbitrarily assigned an effective rate time T ⁇ occurring 10 microseconds before time T0 .
- Data points 195 , 197 , 199 , 201 and 203 of Figure 10 differ from data points 143 , 147 , 151 , 155 , and 159 of Figure 9 .
- Data points 195 , 197 , 199 , 201 and 203 of Figure 10 represent the rate of gamma radiation emitted in response to thermal neutron capture, for each spectral energy channel, and are assigned effective rate times T ⁇ of 10 microseconds before the end of burst 121 , which occurs at T0 .
- Data points 143 , 147 , 151 , 155 , and 159 of Figure 9 represent the rates of gamma radiation emitted in response to thermal neutron capture, for each spectral energy channel, which occur at time T0 at the end of burst 121 , and not at T ⁇ which occurs at 10 microseconds before the end of burst 121 .
- time T ⁇ of 10 microseconds prior to the end of the burst was arbitrarily chosen as the effective rate time for the count rates measured in data storage bins 1 and 2 , I1 , I2 , I3 , and I4 .
- This effective rate time for T ⁇ was arbitrarily chosen to correspond with typical values for the effective rate times for the bins occurring during the bursts.
- assignment of an effective rate time for the counts measured in a particular bin, over a particular time interval depends on the shape of either the decay curve or buildup curve, depending upon which part of the firing cycle the bin is located. With an exponential buildup curve, the effective rate time for a 40 microsecond data storage bin during the burst would be between the end of the bin and the midpoint in time of the bin.
- the arbitrary assignment of an effective rate time T ⁇ of 10 microseconds prior to T0 in this alternative method of the present invention merely reflects that this rate time occurs in the middle portion of the last half of the data storage bins occurring during the neutron bursts.
- Data points 205 , 207 , 209 , 211 , and 213 represent the count rates for data storage bins 1 and 2 , I1 , I2 , I3 , and I4 , which are plotted as having effective rate time T ⁇ of 10 microseconds before T0 , at the end of burst 121 , as discussed above.
- the average count rates for bins 1 and 2 , I1 , I2 , I3 , and I4 are determined by dividing the total number of counts accumulated in these bins by the total time in a data sample for accumulating count in the bins.
- Data points 195 , 197 , 199 , 201 , and 203 represent the capture component of the total energy spectrum, expressed in count rates, and measured during burst 121 . As discussed above, they are determined by projecting curves 181 , 183 , 185 , 187 , and 189 from the decay period to effective rate time T ⁇ occurring 10 microsecond before T0 is at the end of burst 121 , and which corresponds to effective rate time T ⁇ for count rates from data storage bins 1 and 2 , I1 , I2 , I3 , and I4 .
- the count rate represented by data points 195 , 197 , 199 , 201 , and 203 are directly subtracted from the count rates represented by data points 205 , 207 , 209 , 211 , and 213 , respectively, to determine the count rates for the inelastic capture component of the total counts detected in spectral energy channels 77 , 79 , 81 , 83 , and 85 , respectively.
- ratios between these different count rates may be taken. These ratios for the inelastic count rates for the different spectral energy channels may be further processed to determine formation parameters, such as hydrocarbon saturation and lithology for a well depth interval over which they were recorded.
- the present invention includes other hybrid models.
- a different model could be used for the instantaneous shape of the capture time signature, such as a buildup model based on the thermal neutron lifetime (tau), and the epithermal neutron lifetime (tau S ) .
- tau thermal neutron lifetime
- tau S epithermal neutron lifetime
- a block diagram depicts operation of well logging tool 19 of the preferred embodiment for processing a data sample, collected during the spectroscopy logging mode, according to the preferred method of processing depicted in Figure 9 .
- a data sample is input for processing.
- a light one-pole filter is applied to the input data.
- the activation background is subtracted from the data sample using the counts in bin 12 to determine the level of background activation radiation.
- the effective rate times are determined for the counts collected in data storage bins 5 through 9 , using the previous value of tau ( ⁇ ) from the prior spectroscopy logging mode data sample.
- the effective rate times of the various bins are offset for a virtual time ⁇ at the end of the source pulse.
- the effective rate times are determined by assuming that the point is median to the population of counts occurring and sequenced into a particular bin.
- N SAT N ⁇ (1- e - 40 ⁇ ) which is solved to determine the count rate for the capture component (C ⁇ ), and, substituting 40 microseconds for the active firing time of the pulse width during which the counts are collected in bins 1 and 2 , provides the equation:
- the limits of 40 microseconds were chosen as the limits for this integration since, although the source is activated for 70 microseconds, there is a 30 microsecond strike time before neutrons actually begin to be emitted, and thus an active pulse width, or actual burst duration, of 40 microseconds.
- a block diagram depicts operation of well logging tool 19 to process a data sample according to the alternative method of Figure 10 during the spectroscopy logging mode.
- Figure 12 depicts application of the alternative method of projecting rates for thermal neutron capture events during the bursts directly to a point in time occurring within the bursts.
- a data sample is input for processing.
- a light one-pole filter is applied to the input data.
- Block 239 depicts the activation background being subtracted from the data sample using the counts in bin 12 to determine the level of background activation radiation for a data sample.
- the count rates are determined for the different time intervals over which bins 3 through 7 are collected using the previous value of tau ( ⁇ ) from a the prior spectroscopy logging mode data sample, similar to block 221 of Figure 11 .
- the effective rate times for bins 3 through 7 are calculated using the effective rate time equation described above for block 221 .
- N ⁇ solved for in block 243 is used for the rate of capture for spectral channel 77 , which occurs at time T ⁇ , 10 microseconds prior to the end of the bursts, rather than using an equation for an exponential buildup during the neutron bursts, as was discussed above in reference to blocks 225 and 227 of Figure 11 .
- an actual tau ( ⁇ ) could be calculated for each spectral energy channel of a data sample, rather than using the actual tau ( ⁇ ) for spectral energy channel 77 .
- energy counts could be sequenced into additional data storage bins during the decay period. These additional storage bins would be similar to bins 3 through 12 , as depicted in Figure 5 for spectral energy channel 77 , to determine a rate of decay for each spectral energy channel.
- the rate of decay is presumed to be the same for each channel, since the rate of decay at any moment is presumed to be representative of the thermal neutron population at that moment, as discussed above.
- the well logging tool of the preferred embodiment of the present invention offers several advantages over prior art well logging tools.
- the advantages include improvements in statistical resolution, which provide greater tool accuracy and better tool operating efficiency, which are discussed in the following.
- One advantage of the present invention over the prior art is that an actual gamma ray decay rate is measured and then used for determining a burst thermal neutron capture energy spectrum for a data sample.
- the gamma ray decay rate is measured by collecting counts in more than two data storage bins, and is represented by an exponential curve which is fitted to the counts from the more than two data storage bins.
- a burst thermal neutron capture energy spectrum can be more accurately determined, with an improved statistical resolution, for subtracting from a burst total gamma ray energy spectrum to determine an inelastic energy spectrum for a data sample.
- the well logging tool of the present invention determines a burst thermal neutron capture energy spectra by projecting a measured exponential decay rate curve from thermal neutron capture gamma ray energy spectra detected in decay periods following the neutron bursts. Inelastic energy spectra are then determined by subtracting the burst thermal neutron capture energy spectra from a total gamma ray energy spectra detected during the neutron bursts. An exponential decay rate curve is determined for the capture spectral energy. The values determined for the inelastic energy spectra are more accurate than if the burst thermal neutron capture energy spectra were estimated by linear approximation from a total number of counts sequenced into data storage bins during tool operating cycle decay periods.
- the well logging tool of the present invention can be operated in a spectroscopy logging mode which includes a longer inelastic firing cycle for further improving statistical resolution to provide more accurate data samples.
- the inelastic firing cycle has both a longer burst period and a longer decay period for allowing a broader formation response time.
- the longer decay period extends for several thermal neutron lifetimes which allows a longer period of time for the formation to capture thermal neutrons and emit capture gamma radiation for more accurately determining the decay rate in the spectroscopy logging mode.
- the longer burst period allows more time for inelastic collisions to occur, and thus improves the statistical resolution, or accuracy, of collected data samples.
- the well logging tool of the present invention provides improvements in operating efficiency since the better statistical resolution allows both inelastic energy spectra and thermal neutron capture cross sections to be measured in a single logging pass, with acceptable accuracies.
- the present invention may be operated in a dual logging mode in which the tool automatically alternates between inelastic firing cycles in a spectroscopy logging mode and capture firing cycles in a sigma logging mode during the same logging pass through a well depth interval.
Landscapes
- Physics & Mathematics (AREA)
- High Energy & Nuclear Physics (AREA)
- Life Sciences & Earth Sciences (AREA)
- General Life Sciences & Earth Sciences (AREA)
- General Physics & Mathematics (AREA)
- Geophysics (AREA)
- Measurement Of Radiation (AREA)
- Analysing Materials By The Use Of Radiation (AREA)
- Geophysics And Detection Of Objects (AREA)
Applications Claiming Priority (2)
| Application Number | Priority Date | Filing Date | Title |
|---|---|---|---|
| US08/144,304 US5374823A (en) | 1993-10-28 | 1993-10-28 | Pulsed neutron decay tool for measuring gamma radiation energy spectra for fast neutron inelastic collisions and thermal neutron capture events |
| US144304 | 1993-10-28 |
Publications (3)
| Publication Number | Publication Date |
|---|---|
| EP0652449A2 true EP0652449A2 (fr) | 1995-05-10 |
| EP0652449A3 EP0652449A3 (fr) | 1999-05-26 |
| EP0652449B1 EP0652449B1 (fr) | 2004-02-25 |
Family
ID=22508000
Family Applications (1)
| Application Number | Title | Priority Date | Filing Date |
|---|---|---|---|
| EP94630043A Expired - Lifetime EP0652449B1 (fr) | 1993-10-28 | 1994-07-06 | Dispositif utilisant la décroissance de neutrons pulsés, a fin de mesurer des spectres d'énergie de rayonnement gamma pour des collisions inélastiques de neutrons rapides et pour des captures de neutrons thermiques |
Country Status (5)
| Country | Link |
|---|---|
| US (1) | US5374823A (fr) |
| EP (1) | EP0652449B1 (fr) |
| AT (1) | ATE260473T1 (fr) |
| CA (1) | CA2126606C (fr) |
| DE (1) | DE69433570D1 (fr) |
Cited By (1)
| Publication number | Priority date | Publication date | Assignee | Title |
|---|---|---|---|---|
| WO2025188329A1 (fr) * | 2024-03-07 | 2025-09-12 | Halliburton Energy Services, Inc. | Outil de diagraphie à spectroscopie gamma |
Families Citing this family (37)
| Publication number | Priority date | Publication date | Assignee | Title |
|---|---|---|---|---|
| US5608215A (en) * | 1994-09-16 | 1997-03-04 | Schlumberger Technology Corporation | Method and apparatus for determining density of earth formations |
| US5808298A (en) * | 1997-02-11 | 1998-09-15 | Western Atlas International, Inc. | Method for determining formation hydrocarbon saturation and wellbore hydrocarbon holdup from multidetector carbon-oxygen measurements |
| US5900627A (en) * | 1997-06-19 | 1999-05-04 | Computalog Research, Inc. | Formation density measurement utilizing pulse neutrons |
| US8050866B2 (en) * | 2003-09-25 | 2011-11-01 | Halliburton Energy Services, Inc. | Pulsed-neutron formation density |
| US7117092B2 (en) * | 2003-09-25 | 2006-10-03 | Halliburton Energy Services, Inc. | Pulsed-neutron formation density |
| US7166834B2 (en) * | 2003-12-08 | 2007-01-23 | Baker Hughes Incorporated | Method and apparatus for determining the thermal neutron capture cross-section of a subsurface formation from a borehole |
| US7613665B2 (en) * | 2005-06-24 | 2009-11-03 | Halliburton Energy Services, Inc. | Ensembles of neural networks with different input sets |
| US7587373B2 (en) * | 2005-06-24 | 2009-09-08 | Halliburton Energy Services, Inc. | Neural network based well log synthesis with reduced usage of radioisotopic sources |
| US7365308B2 (en) * | 2005-07-26 | 2008-04-29 | Baker Hughes Incorporated | Measurement of formation gas saturation in cased wellbores using pulsed neutron instrumentation |
| US7566869B2 (en) * | 2005-07-26 | 2009-07-28 | Baker Hughes Incorporated | Measurement of water-oil saturation using pulsed neutron instrumentation |
| US7361887B2 (en) * | 2005-07-26 | 2008-04-22 | Baker Hughes Incorporated | Measurement of formation gas pressure in cased wellbores using pulsed neutron instrumentation |
| US7372018B2 (en) * | 2005-07-26 | 2008-05-13 | Baker Hughes Incorporated | Determination of gas pressure and saturation simultaneously |
| US8065244B2 (en) * | 2007-03-14 | 2011-11-22 | Halliburton Energy Services, Inc. | Neural-network based surrogate model construction methods and applications thereof |
| US20090182693A1 (en) * | 2008-01-14 | 2009-07-16 | Halliburton Energy Services, Inc. | Determining stimulation design parameters using artificial neural networks optimized with a genetic algorithm |
| US7718955B2 (en) * | 2008-03-26 | 2010-05-18 | Baker Hughes Incorporated | Inelastic background correction for a pulsed-neutron instrument |
| US20100228483A1 (en) * | 2009-03-03 | 2010-09-09 | Baker Hughes Incorporated | Method of detecting gas in a formation using capture cross-section from a pulsed neutron device |
| CA2763285C (fr) | 2009-05-22 | 2018-01-09 | Schlumberger Canada Limited | Optimisation d'instruments emetteurs de neutron-gamma pour diagraphie a rayon gamma inelastique |
| GB2531473B (en) | 2010-06-30 | 2016-07-13 | Schlumberger Holdings | Identification of neutron capture from a pulsed neutron logging tool |
| BR112013001390A2 (pt) | 2010-07-21 | 2016-05-24 | Halliburton Energy Services Inc | método, e, sistema |
| US10324224B2 (en) | 2010-09-02 | 2019-06-18 | Baker Huges, A Ge Company, Llc | Elemental concentration determination using neutron-induced activation gamma radiation |
| CA2793472C (fr) | 2011-10-27 | 2015-12-15 | Weatherford/Lamb, Inc. | Outil de mesure de neutrons dote de detecteurs multiples |
| RU2523770C1 (ru) * | 2012-12-06 | 2014-07-20 | Общество с ограниченной ответственностью "Научно-производственное предприятие ЭНЕРГИЯ" | Способ импульсного нейтронного каротажа и устройство для его осуществления |
| US9400340B2 (en) | 2013-05-13 | 2016-07-26 | Baker Hughes Incorporated | Sourceless density measurements with neutron induced gamma normalization |
| US10208582B2 (en) | 2016-08-24 | 2019-02-19 | Saudi Arabian Oil Company | Formation water salinity from borehole measurements |
| RU2650794C1 (ru) * | 2017-02-01 | 2018-04-17 | Общество с ограниченной ответственностью Научно-производственное предприятие "ИНГЕО" | Способ и устройство для проведения импульсного нейтронного гамма-каротажа (Варианты) |
| AU2017398448B2 (en) | 2017-02-08 | 2021-04-29 | Visuray Intech Ltd (Bvi) | Methods and means for azimuthal neutron porosity imaging of formation and cement volumes surrounding a borehole |
| RU172839U1 (ru) * | 2017-03-01 | 2017-07-26 | Общество с ограниченной ответственностью Научно-производственное предприятие "ИНГЕО" | Устройство для проведения импульсного нейтронного гамма-каротажа |
| WO2019093917A1 (fr) | 2017-11-08 | 2019-05-16 | Baker Hughes, A Ge Company, Llc | Évaluation d'une composition de formation à l'aide d'outils de spectroscopie gamma induite par neutrons |
| WO2020023080A2 (fr) | 2018-02-14 | 2020-01-30 | Philip Teague | Procédés et moyens d'imagerie neutronique dans un trou de forage |
| WO2020009701A1 (fr) | 2018-07-05 | 2020-01-09 | Halliburton Energy Services, Inc. | Mesures de rapport du carbone à l'oxygène intrinsèque de formation géologique |
| CN111123379B (zh) * | 2019-12-18 | 2023-02-03 | 中国石油大学(华东) | 一种基于双谱联合的纯净非弹伽马能谱获取方法 |
| CN112360428B (zh) * | 2020-10-13 | 2024-02-20 | 长江大学 | 一种针对中子寿命测井的俘获截面计算方法及装置 |
| US11733421B2 (en) * | 2021-08-31 | 2023-08-22 | China Petroleum & Chemical Corporation | Method for obtaining near-wellbore true borehole sigma and true formation sigma by using a nuclear logging tool during oil and gas exploration |
| US11703611B2 (en) * | 2021-09-16 | 2023-07-18 | China Petroleum & Chemical Corporation | Computer-implemented method of using a non-transitory computer readable memory device with a pre programmed neural network and a trained neural network computer program product for obtaining a true borehole sigma and a true formation sigma |
| CN119907930A (zh) * | 2022-09-21 | 2025-04-29 | 贝克休斯油田作业有限责任公司 | 用于井下操作中的数据处理的系统和方法 |
| EP4587866A4 (fr) | 2022-10-04 | 2026-01-21 | Services Petroliers Schlumberger | Procédé d'alignement spectral pour diagraphie de rayonnement gamma induite |
| AR130675A1 (es) | 2022-10-04 | 2025-01-08 | Schlumberger Technology Bv | SUPRESIÓN DEL RENDIMIENTO ELEMENTAL DE RAYOS g FUERA DE RANGO |
Family Cites Families (12)
| Publication number | Priority date | Publication date | Assignee | Title |
|---|---|---|---|---|
| US3164720A (en) * | 1962-04-02 | 1965-01-05 | Texaco Development Corp | Radioactivity bore hole fluid logging |
| US4122338A (en) * | 1977-06-24 | 1978-10-24 | Texaco Inc. | Thermal neutron die away logging system with optimized gating |
| US4326129A (en) * | 1978-05-10 | 1982-04-20 | Jacob Neufeld | Evaluation of the interaction with radiant energy of substances traversed by a bore hole |
| US4232220A (en) * | 1979-05-04 | 1980-11-04 | Schlumberger Technology Corporation | Background subtraction system for pulsed neutron logging of earth boreholes |
| JPS5745481A (en) * | 1980-08-04 | 1982-03-15 | Schlumberger Overseas | Method of and apparatus for spectroscopic analysis on elements of stratum |
| US4390783A (en) * | 1980-08-04 | 1983-06-28 | Schlumberger Technology Corporation | Spectroscopic analysis with background compensation |
| US4424444A (en) * | 1980-08-28 | 1984-01-03 | Halliburton Company | Method for simultaneous measurement of borehole and formation neutron lifetimes |
| US4712007A (en) * | 1985-04-01 | 1987-12-08 | S.I.E., Inc. | Pulsed neutron logging method using cumulative count curves |
| US4721853A (en) * | 1986-01-31 | 1988-01-26 | Schlumberger Technology Corporation | Thermal decay time logging method and apparatus |
| US5128541A (en) * | 1986-10-03 | 1992-07-07 | Schlumberger Technology Corporation | Thermal decay time logging method |
| US4947040A (en) * | 1989-07-14 | 1990-08-07 | Schlumberger Technology Corporation | Thermal decay time logging method and tool |
| US5055676A (en) * | 1990-05-09 | 1991-10-08 | Schlumberger Technology Corporation | Method for determining oil and water saturation in earth formation surrounding a borehole |
-
1993
- 1993-10-28 US US08/144,304 patent/US5374823A/en not_active Expired - Lifetime
-
1994
- 1994-06-23 CA CA002126606A patent/CA2126606C/fr not_active Expired - Lifetime
- 1994-07-06 EP EP94630043A patent/EP0652449B1/fr not_active Expired - Lifetime
- 1994-07-06 DE DE69433570T patent/DE69433570D1/de not_active Expired - Lifetime
- 1994-07-06 AT AT94630043T patent/ATE260473T1/de not_active IP Right Cessation
Cited By (1)
| Publication number | Priority date | Publication date | Assignee | Title |
|---|---|---|---|---|
| WO2025188329A1 (fr) * | 2024-03-07 | 2025-09-12 | Halliburton Energy Services, Inc. | Outil de diagraphie à spectroscopie gamma |
Also Published As
| Publication number | Publication date |
|---|---|
| CA2126606C (fr) | 2003-12-16 |
| ATE260473T1 (de) | 2004-03-15 |
| EP0652449A3 (fr) | 1999-05-26 |
| CA2126606A1 (fr) | 1995-04-29 |
| US5374823A (en) | 1994-12-20 |
| EP0652449B1 (fr) | 2004-02-25 |
| DE69433570D1 (de) | 2004-04-01 |
Similar Documents
| Publication | Publication Date | Title |
|---|---|---|
| US5374823A (en) | Pulsed neutron decay tool for measuring gamma radiation energy spectra for fast neutron inelastic collisions and thermal neutron capture events | |
| Atkins et al. | The high-energy gamma-ray fluence and energy spectrum of GRB 970417a from observations with Milagrito | |
| CA2356742C (fr) | Methode de synchronisation de bouffees de neutrons et systeme de mesures multiples pour l'evaluation de la formation de neutrons pulses | |
| EP1119781B1 (fr) | Mesure de la densite des formations par utilisation de neutrons pulses | |
| US5081351A (en) | Method and apparatus for borehole correction in capture gamma ray spectroscopy measurements | |
| US3780303A (en) | Pulsed neutron logging with background compensation | |
| US5068532A (en) | Analysis using neutrons | |
| US6150655A (en) | Inferential measurement of photoelectric absorption cross-section of geologic formations from neutron-induced, gamma-ray spectroscopy | |
| US3739171A (en) | Gamma ray spectroscopy with quantitative analysis | |
| JPH07301610A (ja) | 土壌中の有毒元素の濃度の深さプロフィールを求める方法及び装置 | |
| US3930154A (en) | Measurement of subsurface formation lithology, including composition and fluids, using gamma spectroscopy and thermal neutron decay | |
| US4020342A (en) | Earth formation salinity by comparison of inelastic and capture gamma ray spectra | |
| US10466384B2 (en) | Techniques for determining formation composition from measured nuclear spectra | |
| US3780302A (en) | Pulsed neutron logging system | |
| US3336476A (en) | Detecting radioactive potassium in the presence of uranium and thorium | |
| US5420422A (en) | Methods and apparatus for epithermal neutron porosity logging | |
| US5973321A (en) | Method for determining multiple thermal neutron decay components from the capture gamma ray spectrum measured by a pulsed neutron instrument | |
| RU2441259C2 (ru) | Способ определения плотности и фотоэлектрического поглощения пласта с использованием прибора плотностного каротажа литологического разреза на основе импульсного ускорителя | |
| US6005244A (en) | Detecting bypassed hydrocarbons in subsurface formations | |
| US5053620A (en) | Logging apparatus and method for determining concentrations of subsurface formation elements | |
| US3800150A (en) | Method and apparatus for radioactive well logging employing partially overlapping time windows for detection of radiation | |
| US4625111A (en) | Method and apparatus for pulsed neutron capture measurement of borehole conditions and formation hydrogen index | |
| CA1225754A (fr) | Mesure de la porosite au moyen de neutrons epithermiques | |
| US5808298A (en) | Method for determining formation hydrocarbon saturation and wellbore hydrocarbon holdup from multidetector carbon-oxygen measurements | |
| US4814610A (en) | Method for more accurately determining thermal neutron decay time constants |
Legal Events
| Date | Code | Title | Description |
|---|---|---|---|
| PUAI | Public reference made under article 153(3) epc to a published international application that has entered the european phase |
Free format text: ORIGINAL CODE: 0009012 |
|
| AK | Designated contracting states |
Kind code of ref document: A2 Designated state(s): AT DE FR GB IT |
|
| PUAL | Search report despatched |
Free format text: ORIGINAL CODE: 0009013 |
|
| AK | Designated contracting states |
Kind code of ref document: A3 Designated state(s): AT DE FR GB IT |
|
| 17P | Request for examination filed |
Effective date: 19991122 |
|
| 17Q | First examination report despatched |
Effective date: 20020729 |
|
| GRAP | Despatch of communication of intention to grant a patent |
Free format text: ORIGINAL CODE: EPIDOSNIGR1 |
|
| GRAS | Grant fee paid |
Free format text: ORIGINAL CODE: EPIDOSNIGR3 |
|
| GRAA | (expected) grant |
Free format text: ORIGINAL CODE: 0009210 |
|
| AK | Designated contracting states |
Kind code of ref document: B1 Designated state(s): AT DE FR GB IT |
|
| PG25 | Lapsed in a contracting state [announced via postgrant information from national office to epo] |
Ref country code: IT Free format text: LAPSE BECAUSE OF FAILURE TO SUBMIT A TRANSLATION OF THE DESCRIPTION OR TO PAY THE FEE WITHIN THE PRESCRIBED TIME-LIMIT;WARNING: LAPSES OF ITALIAN PATENTS WITH EFFECTIVE DATE BEFORE 2007 MAY HAVE OCCURRED AT ANY TIME BEFORE 2007. THE CORRECT EFFECTIVE DATE MAY BE DIFFERENT FROM THE ONE RECORDED. Effective date: 20040225 Ref country code: FR Free format text: LAPSE BECAUSE OF FAILURE TO SUBMIT A TRANSLATION OF THE DESCRIPTION OR TO PAY THE FEE WITHIN THE PRESCRIBED TIME-LIMIT Effective date: 20040225 Ref country code: AT Free format text: LAPSE BECAUSE OF FAILURE TO SUBMIT A TRANSLATION OF THE DESCRIPTION OR TO PAY THE FEE WITHIN THE PRESCRIBED TIME-LIMIT Effective date: 20040225 |
|
| REG | Reference to a national code |
Ref country code: GB Ref legal event code: FG4D |
|
| REF | Corresponds to: |
Ref document number: 69433570 Country of ref document: DE Date of ref document: 20040401 Kind code of ref document: P |
|
| PG25 | Lapsed in a contracting state [announced via postgrant information from national office to epo] |
Ref country code: DE Free format text: LAPSE BECAUSE OF FAILURE TO SUBMIT A TRANSLATION OF THE DESCRIPTION OR TO PAY THE FEE WITHIN THE PRESCRIBED TIME-LIMIT Effective date: 20040526 |
|
| PLBE | No opposition filed within time limit |
Free format text: ORIGINAL CODE: 0009261 |
|
| STAA | Information on the status of an ep patent application or granted ep patent |
Free format text: STATUS: NO OPPOSITION FILED WITHIN TIME LIMIT |
|
| EN | Fr: translation not filed | ||
| 26N | No opposition filed |
Effective date: 20041126 |
|
| PGFP | Annual fee paid to national office [announced via postgrant information from national office to epo] |
Ref country code: GB Payment date: 20130703 Year of fee payment: 20 |
|
| REG | Reference to a national code |
Ref country code: GB Ref legal event code: PE20 Expiry date: 20140705 |
|
| PG25 | Lapsed in a contracting state [announced via postgrant information from national office to epo] |
Ref country code: GB Free format text: LAPSE BECAUSE OF EXPIRATION OF PROTECTION Effective date: 20140705 |