EP0657731A1 - Procédé et appareil pour déterminer une absorption caractéristique d'une substance - Google Patents
Procédé et appareil pour déterminer une absorption caractéristique d'une substance Download PDFInfo
- Publication number
- EP0657731A1 EP0657731A1 EP93120005A EP93120005A EP0657731A1 EP 0657731 A1 EP0657731 A1 EP 0657731A1 EP 93120005 A EP93120005 A EP 93120005A EP 93120005 A EP93120005 A EP 93120005A EP 0657731 A1 EP0657731 A1 EP 0657731A1
- Authority
- EP
- European Patent Office
- Prior art keywords
- signal
- signals
- characteristic
- pulse
- path
- Prior art date
- Legal status (The legal status is an assumption and is not a legal conclusion. Google has not performed a legal analysis and makes no representation as to the accuracy of the status listed.)
- Granted
Links
Images












Classifications
-
- G—PHYSICS
- G01—MEASURING; TESTING
- G01N—INVESTIGATING OR ANALYSING MATERIALS BY DETERMINING THEIR CHEMICAL OR PHYSICAL PROPERTIES
- G01N21/00—Investigating or analysing materials by the use of optical means, i.e. using sub-millimetre waves, infrared, visible or ultraviolet light
- G01N21/17—Systems in which incident light is modified in accordance with the properties of the material investigated
- G01N21/25—Colour; Spectral properties, i.e. comparison of effect of material on the light at two or more different wavelengths or wavelength bands
- G01N21/31—Investigating relative effect of material at wavelengths characteristic of specific elements or molecules, e.g. atomic absorption spectrometry
- G01N21/39—Investigating relative effect of material at wavelengths characteristic of specific elements or molecules, e.g. atomic absorption spectrometry using tunable lasers
-
- G—PHYSICS
- G01—MEASURING; TESTING
- G01N—INVESTIGATING OR ANALYSING MATERIALS BY DETERMINING THEIR CHEMICAL OR PHYSICAL PROPERTIES
- G01N21/00—Investigating or analysing materials by the use of optical means, i.e. using sub-millimetre waves, infrared, visible or ultraviolet light
- G01N21/17—Systems in which incident light is modified in accordance with the properties of the material investigated
- G01N21/25—Colour; Spectral properties, i.e. comparison of effect of material on the light at two or more different wavelengths or wavelength bands
- G01N21/31—Investigating relative effect of material at wavelengths characteristic of specific elements or molecules, e.g. atomic absorption spectrometry
- G01N21/314—Investigating relative effect of material at wavelengths characteristic of specific elements or molecules, e.g. atomic absorption spectrometry with comparison of measurements at specific and non-specific wavelengths
Definitions
- the present invention relates to methods for evaluating a characteristic absorption according to the preambles of claims 1 and 4, and to methods for radiation source stabilization, in particular laser stabilization according to the preambles of claims 8 and 11, and finally to an apparatus for carrying out such methods.
- the weakening of radiation - wave or corpuscular radiation - when interacting with matter forms the basis for measurement applications, with some of the radiation being absorbed or attenuated. The rest is reflected or goes through matter. Depending on the nature and composition of matter, only radiation with a certain energy or wavelength is completely absorbed or attenuated. The absorbed energy is characteristic of the matter to be examined. The evaluation of this characteristic absorption allows far-reaching conclusions to be drawn about the nature of the material, for example, radiation: for example, any substances in a mixture of substances can be detected with high accuracy. Furthermore, the concentration of a substance in a mixture of substances can be determined from the level of attenuation of the characteristic radiation.
- An example is a method known from EP 89 906 096.6 for determining the concentration of a gas in a gas mixture.
- the pulsed light of a laser the wavelength of which is switched after each pulse, is sent through the measuring section.
- One wavelength or absorption wavelength is characteristic of a gas whose concentration is to be determined, the other wavelength is not characteristic of any substance that is on the measuring section.
- the light pulse, the wavelength of which is characteristic of a selected gas, is slightly weakened by the characteristic absorption on the measuring section.
- noise components from the light detectors and the downstream electronics there are significant noise components from the laser radiation itself. Depending on the type of laser, this noise component can be minimized with considerable expenditure on equipment, but it can never be completely ruled out.
- sources of noise in the laser come e.g. B. the power supply, influence of pressure or temperature changes on the emission and the influence of any laser cooling on the emission into consideration.
- the aim of the present invention is to minimize the interference on the measured value.
- the measured value is formed from the difference between the signals of two paths, the reference path and the measuring path (measurement value formation).
- the difference signal obtained is preferably frequency and / or time selected before it is output as a corrected measured value (claim 2).
- a radiation source in particular a laser, emits radiation on more than two wavelengths.
- Signals are generated electronically, each consisting only of the electrical signals of two light pulses.
- the detector signal with more than two pulses is divided into several signals, each signal consisting of a characteristic and there is an uncharacteristic pulse (signal division) (claim 5).
- the difference from the signal level at the time of the maximum of the characteristic and at the time of the maximum of the uncharacteristic signal pulse is preferably formed from the difference signal and finally output as a measured value signal (claim 3).
- the aim of the invention is also achieved by a method according to claim 4.
- the signal of the measuring path and the reference path is evaluated and corrected before a measurement value is formed, preferably from the difference between the measuring and reference path signals (interference suppression).
- the concentration of a substance is also measured in a measurement cycle, which ensures cross-sensitivity and corrects the actual measurement result with this measurement result (cross-sensitivity correction) (claim 7).
- each individual pulse of the electrical signal is evaluated for faults and corrected if necessary.
- the influence of the light source and all other sources of interference in the measuring system itself on the measured value is minimized by forming the difference between the signal of the measuring section and the excitation signal.
- This difference signal is then selected in the frequency domain and / or in the time domain, evaluated again and possibly corrected before it is output as a measured value.
- the method can be expanded. Using additional light pulses, the wavelength of which is characteristic of the other gases, a signal sequence is generated that consists of several pulses. After several signals have been extracted from this signal sequence and each contain only two pulses each, the further signal processing takes place in the manner shown above. One measurement value is obtained for each characteristic light wavelength. The influence of the other substances on the actual measured value - the concentration of the selected gas - can then be excluded by means of simple mathematical processes.
- the present method can be used, for example, in power plants for exhaust gas analysis.
- the caloric power plants generate nitrogen oxides that are harmful to the environment.
- Ammonia is used to reduce them.
- Ammonia itself is also an environmentally harmful substance.
- the ammonia injection can take place so precisely that on the one hand extremely little nitrogen oxides leave the flue gas duct and on the other hand only a minimal amount of ammonia escapes.
- the method can be used particularly advantageously, for example for the counterfeit protection of check cards and for access controls, in particular on account of the low outlay on equipment and the high measurement accuracy.
- a plastic card e.g. B. check or credit card
- a clear identification can be made with the help of the present method. If the coating is carried out in such a way that identification is not possible for the human eye and other measuring instruments that are not as sensitive, a high level of counterfeit security is achieved.
- Another particularly advantageous application of the invention is the mixture control in continuous processes.
- a discontinuous mixing process is used. The individual components are put together in a container, mixed and then the container is emptied.
- the substance composition can be checked continuously during the mixing process and the quantity of individual substances can be adjusted exactly to the current needs.
- the aim according to the invention is achieved by a method for radiation source stabilization according to claim 8.
- Another idea of the invention consists in radiation source stabilization, in particular laser stabilization, which is divided into measures according to the invention for automatic commissioning and long-term stabilization. Commissioning is also carried out using the rectifier in the reference path. Only the Sample & Hold devices are used for long-term stabilization.
- the laser In particular, it is controlled with any signal. This is changed until there is an adapted signal level behind the two rectifiers in the reference path. Now the sample & hold circuits in the reference path can be used to Curve shape and the phase position of the signal are checked (claim 9).
- the signal from the reference path can now be checked.
- the signal can be completely captured by shifting the individual clock pulses. If the signal from the reference path does not consist of three relative maxima, the laser control must be varied and the scanning repeated.
- the signal also consists of four minima, it is checked whether the maxima are embedded symmetrically between two minima.
- the laser control must be varied further.
- the sample and hold devices in the calibration paths are used to check whether the required light wavelengths are emitted by the laser and at what times it emits light with them.
- the other two signal pulses will each be weakened in at least one cuvette.
- the light pulse the wavelength of which is characteristic of the gas, the concentration of which is to be determined on the measuring section, will also be weakened in the second calibration cell.
- the reason is cross sensitivity.
- the light pulse the wavelength of which is characteristic of the substance which is the cause of the cross-sensitivity, may only be weakened when it passes through the cuvette which is filled with this substance. The light rays become characteristic of both If the wavelengths of light are weakened when they pass through the calibration cells, the laser is incorrectly tuned.
- Emission wavelength and emission times of the radiation source are repeatedly determined by sampling the calibration path signals (32, 42) using sample & hold circuits and corrected again if necessary (claim 10).
- the control of the laser in particular, is continuously varied during operation.
- the changes are to be kept so small that there is no effect on the measurement result or this must be taken into account when forming the measured values.
- Is z. B the laser by means of a mechanically moved tuning element to the different light wavelengths, it is more favorable to let the tuning element perform a cyclical movement without jumps. If the tuning element is moved back and forth with a uniform movement between the two end points without a jump, the emission spectrum is swept once from the low to the high and once from the high to the low wavelength.
- the laser also emits on all emission lines in between. This does not lead to any further difficulties, but must be taken into account when demultiplexing in the evaluation and correction device.
- the unwanted signal pulses are simply omitted during demultiplexing - the division into different signals from two signal pulses each.
- the invention can also be used for methods for path length measurement.
- the distance between two points can be precisely determined by means of radiation, the wavelength of which is precisely known. Compliance with the path length used is essential for reliable path length determination.
- the radiation source can be inexpensively set to the desired wavelength predetermined by the substance in the calibration path without drift.
- the aim according to the invention is also achieved by a method according to claim 11.
- the electrical signal of a detector can be broken down into its Fourier components.
- the light beam on the reference path on which the gas is not located is whose concentration is to be determined on the test section, not damped.
- the light beam on the calibration path, on which there is a cuvette filled with the selected gas, will not be attenuated with one light pulse and will be attenuated with the other.
- the Fourier spectrum of the electrical signal from the detector of the reference path will therefore primarily contain only parts of the frequency which are derived from the pulse repetition frequency.
- the other spectral components result primarily from the different emission of the laser at the two wavelengths used.
- the Fourier spectrum of the electrical signal from the detector of the calibration path will therefore contain signal components which are derived from the pulse repetition frequency and half the pulse repetition frequency.
- the laser is then correctly adjusted according to the invention when the portions in the spectrum from the signal of the reference path assume a maximum that were derived from the pulse repetition frequency and the portions assume a minimum that were derived from half the pulse repetition frequency.
- the odd-numbered spectral components assume a minimum
- the even-numbered components assume a maximum.
- all even and odd parts in the spectrum from the signal of the calibration path must assume a relative maximum. If there is such a high concentration of the selected gas or of the calibration substance in the calibration path, the characteristic radiation pulse is completely absorbed. In the spectrum of the calibration path signal, there are no longer even-numbered components - even with correct laser adjustment. It is then no longer possible to clearly check whether the laser is correctly adjusted.
- the present invention is procedurally divided into three mutually independent aspects or function blocks: the radiation source stabilization, the evaluation and correction (interference suppression) and the measurement value formation itself.
- a signal division preferably takes place in such a way that at least one calibration path signal and the reference signal are supplied to the radiation source stabilization, in particular laser stabilization, and a pair of signals comprising reference and measurement path signals) is subjected to the evaluation and, if necessary, correction (claim 6).
- the laser can be tuned so that it emits on at least three lines.
- other cuvettes are placed in their own calibration path, each containing the substance that leads to cross-sensitivity.
- another cuvette is used to compensate for cross-sensitivities. Basically nothing changes in the procedure if more cuvettes are used for cross sensitivity correction. A further characteristic light pulse is generated for each further cuvette and a further circuit for measuring value correction and correction is introduced in each case. The signal timing must be adjusted accordingly. If correction of the cross sensitivity is not desired, the cuvette and the associated signal processing can be omitted without replacement.
- the invention works - e.g. in a device for determining the concentration of gases in a gas mixture - from a system consisting of a radiation source, in particular a laser, one or more calibration cells, a reference path and a measuring path.
- the laser in particular emits light with at least two different wavelengths. One wavelength is characteristic for a selected substance, another wavelength is uncharacteristic for all substances on the measuring section. The other light wavelengths that may be used are characteristic of the other substances. All wavelengths used are uncharacteristic of all other substances that may be on the measuring section and whose concentration is variable.
- the laser in particular, is controlled in such a way that it alternately emits light of the selected wavelengths. Small emission breaks or emission attenuations are inserted between the light pulses. After an emission sequence has ended, a new one is started.
- the laser can be controlled so that it reverses the order in which the different light wavelengths are emitted at the end of a sequence. This must be taken into account in the downstream electronics. So z. B. the pulse sequence in the evaluation and correction device 504 are reversed.
- the light from the laser is broken down into three or more beams using a beam splitter.
- One beam passes through the reference path, measuring path and the reference path (s) at the same time.
- the intensity of the rays is thus almost identical. Deviations arise primarily from the spectral properties of the beam splitters used.
- the electrical signals still vary easily due to the spectral properties of the detectors.
- the light in the reference path is led directly to a detector. There is only air on the reference path. In all cases, it must be kept free of the gas whose concentration is to be determined on the measuring section and which is also contained in a calibration cell.
- the light in the calibration path is led to a detector via a calibration cell.
- There is a known amount of the substance in the calibration cell the concentration of which is to be determined on the measuring section.
- the concentration of the selected gas and the absolute pressure in the cuvette are selected so that the light beam with the characteristic wavelength is significantly weakened, as close as possible to 100%.
- Any other calibration cells that may be present contain substances that may be on the measuring section and that may have a falsifying influence on the measurement result.
- the light in the measuring path is guided over a measuring section. There is a gas mixture in the measuring section, in which the gas can be contained, the concentration of which has to be determined.
- An electrical signal is obtained from the incident light signal in the detectors, which is proportional to the intensity of the incident light energy.
- the signal from the detector behind the reference path thus directly follows the laser emission.
- the signal behind the calibration path always follows the laser emission when the laser emits light with the uncharacteristic wavelength. Whenever the laser emits light with the characteristic wavelength, the signal at this detector appears weakened. Since the concentration in the calibration cell does not change, the weakening always remains the same.
- the signal behind the measuring path always follows the laser emission when the laser emits light with the uncharacteristic wavelength. Whenever the laser emits light with a characteristic wavelength, the signal at the detector appears weakened.
- the weakening is proportional to the concentration of the selected gas - a gas that is also in one of the calibration cells - on the measuring section.
- the signals from the detectors are fed to the evaluation device or evaluation electronics according to the invention with a measurement value generating device for forming the measurement value from the difference signal of the measurement path signal and reference path signal.
- This evaluation electronics thus forms the measured value from the electrical signals, a measure of the reliability of the measured value and preferably a signal for stabilizing the radiation source. For better assessment of the signals, the evaluation electronics preferably also receive information about the current process status.
- the signals from all detectors are preferably first brought to a uniform signal level in an amplifier and filter device and freed from undesired signal components.
- the signals are then preferably split up.
- the signals from the reference path and the calibration paths are fed to a radiation source, in particular laser stabilization. This prepares the signals so that the system control can use them to generate the signal for laser control in particular.
- the signal from the reference path and the signal from the measuring path are preferably fed to an evaluation and correction device. This first evaluates a signal pulse by comparison with stored setpoints and corrects it if necessary. If more than one calibration cell is provided in the system, new signal pairs are generated from the input signal pair, each of which contains only two different signal pulses within a signal period. Each of these signal pairs is then fed to the circuit for measuring value correction and correction (claim 13).
- the measured value generating device preferably has a subtractor for forming the difference signal, which is followed by at least two sample & hold circuits for sampling the difference signal in the middle of the characteristic and the uncharacteristic signal pulse, and a further subtractor for forming the level difference between the difference signal at the time of the maximum of the characteristic and at the time of the maximum of the uncharacteristic signal pulse (claim 14).
- Each of these measurement value generation and correction devices generates from its signal pair a signal which is proportional to the concentration of the corresponding gas on the measurement section.
- the system controller uses the data from the measured value generation and correction devices and the current process data to form the measured value and a measure of the reliability of the measured value.
- All processes in the evaluation electronics are coordinated by means of a clock generator.
- the output pattern of the clock generator is specified by the system control.
- a preferred embodiment of the evaluation device has the following devices: Amplifier and filter: Behind all detectors there is a signal processing device consisting of amplifier and filter. The output level of the detector signals is amplified to a uniform level and the signals are then freed from unwanted signal components by means of a low-pass filter. The basic frequency of the filter is set so that the ripple of the filter does not inadvertently falsify the information content of the signal. With only one calibration cell, this means that regardless of the filter type selected, the filter must be adjusted so that it does not affect the signal at the pulse repetition frequency and half the pulse repetition frequency.
- the clock generator supplies all function groups of the evaluation electronics with synchronous clock signals.
- the pattern generator is constructed so that the system control can influence the phase position of each individual clock.
- the two incoming signals from the measuring path and reference path detector are digitized and fed to the digital evaluation and correction device. After the correction has been made, it outputs the signals to the downstream electronics using digital / analog converters.
- the evaluation and correction device is able to recognize the target curve profile and to change the detector signal accordingly. Using statistical methods, the evaluation and correction device itself recognizes the target curve shape and stores it in the target value memory.
- a separation is also carried out with the signal evaluation of the input signals in signal pairs that only consist of two pulses within a signal period.
- Measurement value correction and correction The measurement value is formed from the difference between the corrected measurement signal and the corrected reference signal. This signal is amplified and filtered by two sample & hold circuits. The sample and hold devices are activated by two clock signals with a maximum of one signal pulse each of the input signal. The two output signals are each fed to a further sample & hold circuit and a circuit for gradient evaluation. This gradient assessment activates the second sample & hold stage mentioned above.
- the gradient evaluation is synchronized by the pattern generator with the input signal of the measured value formation. The gradient evaluation receives the information about the permissible gradients in the input signal from the system control. The system control derives the currently permitted gradient from the process status.
- the difference is formed from the output signal of the second sample & hold stage. After further amplification and filtering, the signal is sent to the system control for further processing.
- the evaluation device preferably has a device for signal processing for radiation source stabilization with rectifier and sample & hold circuits, which sample reference and calibration path signals at a predetermined point in time, in order to assign the curve shape, the phase position, and the maximum value and the average value per signal period determine (claim 15).
- Another preferred exemplary embodiment consists of an evaluation and correction device with a demultiplexer.
- the signals from the measuring path and the reference path are digitized and compared with a target pattern stored in the target value memory and corrected accordingly if necessary.
- the evaluation takes place over a complete curve.
- the signal is completely sampled and buffered within a period.
- the signal from the reference path is only affected by faults that are caused by the system itself.
- the same disturbances are also contained in the measuring path signal.
- additional disturbances due to the unintentional changes in the light beam on the measuring path by z.
- the evaluation and correction device compares the normalized pulses with a stored target pattern. A curve is OK if it lies within the specified tolerance range and its first derivative remains within the tolerance range for the first derivative.
- the evaluation and correction device outputs the old signal until the input signal is undisturbed again.
- the system controller is informed that no current signal obtained directly from the measuring path is passed on.
- the signal evaluation separates the signal train into several signals for separate evaluation.
- the device for measuring value correction and correction can only evaluate a signal which consists of two different pulses.
- the evaluation and correction device separates the digital data stream in such a way that only signal pairs are formed which only consist of a pulse which was created by the uncharacteristic radiation and a pulse which was caused by characteristic radiation.
- the signal period of the input signal consists of three signal pulses.
- a signal pulse is caused by the light pulse, the light wavelength of which is uncharacteristic for all substances.
- the other two pulses are caused by light pulses, the wavelength of which is characteristic of a substance.
- the separation is now carried out in such a way that the period of the new signal, consisting of two pulses, corresponds to the period of the original signal.
- the amplitude of the pulses also remains unchanged.
- Each individual pulse is now stretched in time so that its duration corresponds to exactly half the period.
- the first pulse is output at the beginning of the period, the second pulse is output from the middle of the period.
- the laser is controlled in such a way that its emission spectrum is swept from low to high wavelengths and vice versa in the following period, this must be taken into account accordingly in the signal separation.
- the additional signal pulses can be electronically suppressed in the evaluation and correction device. The prerequisite for this is that the laser is always on with the correct tuning emitted these lines. If these unwanted signal pulses are to be suppressed electronically, it must be assumed in the design of the input amplifier and the laser stabilization that the laser emits on these lines.
- These additional signal pulses are to be treated in the same way as the characteristic signal pulses for cross sensitivity correction. These signal pulses are suppressed in the evaluation and correction device. That is, they are also treated here like the signals for cross sensitivity correction, only there is no output using an existing pair of signals. This ensures that the actually undesired signal pulses are used for signal evaluation and correction, but are no longer present in the actual measurement value formation and therefore cannot interfere with the measurement result.
- Measurement value correction and correction Due to the division of the signal with three or more signal pulses into several signals with only two signal pulses each, from the point of view of measurement value formation, the system always consists of only one measurement path, one reference path and one calibration path. The system controller combines the information from the various devices for measuring value formation into a signal, the measure of the concentration of the selected substance on the measuring section.
- the measure for the concentration of the substance sought results from the difference of the signal from the reference path and from the measuring path.
- the light beam on the measuring section is also not attenuated.
- the light beam is generally not attenuated on the reference path. If the two signals from the reference path and from the measuring path are adjusted to the same level during the emission of the unchracteristic light wavelength, the result is a difference between the two signals during the emission of the characteristic light wavelength, since the light beam is attenuated on the measuring path in proportion to the concentration of the selected gas. The signal difference is proportional to the attenuation of the light beam on the measuring section.
- the signal level of the difference signal is now sampled at two points in time by means of two sample & hold elements. The two times are chosen so that the level difference in the difference signal assumes a maximum. This is the case if a relative maximum occurs in the reference signal at the input of the measurement value correction and correction.
- the output signals of these two sample & hold elements are each fed to a further sample & hold element and the device for gradient assessment.
- the gradient assessment enables the two signal levels of the sample & hold elements mentioned here first to be adopted.
- the release takes place only if the changes in the sampled signal are within specified limits and the release is permitted by the system control.
- the laser is tuned in such a way that it emits light of more than two wavelengths, a cross-sensitivity to other substances on the measuring section can also be recognized and corrected.
- the laser is tuned so that it also emits light with a wavelength that is characteristic of the other substance.
- the input signals are separated into at least two signal branches.
- a signal branch contains the signals that are caused by the desired substance, another signal branch receives the signals that are caused by the undesired substance.
- the separate evaluation is now carried out in each signal branch.
- the concentration of the desired gas is thus determined.
- the measurement value obtained is falsified by the cross-sensitivity to the other substance.
- the concentration of the undesired substance is also determined.
- the signal distortion in the other branch can now be determined from the concentration of the undesired substance.
- the system control can output a measurement value which is free from influences of the other substances on the measurement section.
- the fuel composition has an influence on the flue gas composition. Changes in the flue gas composition therefore lead to higher permissible fluctuations in the measured values.
- the exhaust gas temperature determines the conversion rate of the nitrogen oxides and thus the ammonia slip in the exhaust gas. In the event of temperature fluctuations, larger fluctuations in the ammonia concentration are therefore permissible.
- the system control increases the permissible fluctuation range of the measured value.
- the permissible fluctuation range in the measured value is narrowed down again by the system controller.
- an adjustment of the beam splitters is preferably provided: the optical properties of the beam splitters are dependent on the wavelength of the incident light beam. Although the differences in the wavelengths used are not very large, a significant influence can be seen due to the high sensitivity of the present method.
- This effect can be used to automatically adjust the beam splitters.
- the laser is set to the required light wavelengths.
- the beam splitters are mounted on a fixed support in such a way that they can be freely adjusted individually in the three spatial coordinates and the two possible angular coordinates by means of electromechanical adjustment devices.
- the input amplifier is set to a fixed output level. Starting with the most distant beam splitter from the light source, the beam splitters are now set individually.
- a beam splitter is optimally set when the amplitudes of the individual signal pulses deviate the least from one another and the average level of all pulses of a signal period assumes a maximum.
- FIG. 1 shows the overall structure of a device for determining the concentration of gases in a gas mixture, on which all aspects of the invention are to be clarified.
- This application is only given as an example and is in no way to be understood as restrictive.
- the invention is suitable for all detection and concentration determination methods which are based on a characteristic absorption by the solid or gaseous substance to be measured.
- a laser 1 generates monochromatic light of at least three wavelengths.
- One wavelength is characteristic of a gas which is located in the calibration cell 7.
- Another wavelength is characteristic of a gas which is located in the calibration cell 8.
- the third wavelength is uncharacteristic of all substances that can be located on the measuring section 5.
- the laser is controlled so that it alternately emits light of the wavelengths described. Breaks or weakening phases can be inserted between the emissions.
- the light beam 200 from the laser 1 is guided to the beam splitter 2.
- the beam splitter 2 splits the light beam 200 into the light beams 201 and 203.
- the light beam 203 is guided to the detector 10 via the measuring path 5. If light with the uncharacteristic wavelength is emitted by laser 1, there is no change in the light beam on the measuring section. If light with the wavelength characteristic of the substance in the cuvette 7 is emitted by the laser 1, the light beam is weakened in proportion to the concentration of this substance on the measuring section. If light with the wavelength characteristic of the substance in the cuvette 8 is emitted by the laser 1, the light beam on the measuring path 5 is weakened in proportion to the concentration of this substance on the measuring path 5.
- the detector 10 converts the incident light beam into an electrical signal 11, the amplitude of which is proportional to the incident radiation intensity.
- the electrical signal 11 is fed to the evaluation electronics 50 for further processing via a line.
- the light beam 201 is guided to the beam splitter 3.
- the beam splitter 3 splits the light beam 201 into the light beams 202 and 204.
- the light beam 204 is guided to the detector 20 via the reference path 6.
- the light beam is not changed on the reference path 6.
- the detector 20 converts the incident light beam 204 into an electrical signal 21, the amplitude of which is proportional the incident radiation intensity.
- the electrical signal 21 is fed to the evaluation electronics 50 for further processing via a line.
- the light beam 202 is guided to the beam splitter 4.
- the beam splitter 4 splits the light beam 202 into the light beams 205 and 206.
- the light beam 205 is guided to the detector 30 via the calibration cell 7, which is filled with a substance whose concentration is to be determined on the measuring section 5.
- the detector 30 converts the incident light beam into an electrical signal 31, the amplitude of which is proportional to the incident radiation intensity.
- the electrical signal 31 is fed to the evaluation electronics 50 for further processing via a line.
- the light beam 206 is directed to the detector 40 via the calibration cell 8, which is filled with a substance which can be located on the measuring section 5 and which prevents the error-free concentration determination for the substance in the calibration cell 7.
- the detector 40 converts the incident light beam into an electrical signal 41, the amplitude of which is proportional to the incident radiation intensity.
- the electrical signal 41 is fed to the evaluation electronics 50 for further processing via a line.
- the system controller 50 controls the laser via a line with the signal 52 so that it alternately light of the characteristic wavelength of the substance in the calibration cell 7, light of the characteristic wavelength of the substance in the calibration cell 8 and for all substances on the measuring path 5 uncharacteristic light emitted.
- the system controller receives information about the current operating state of the measuring section. This includes information about pressure, temperature, the oxygen content, the fuel composition, the current ammonia injection quantity and the known analysis values of the flue gas composition on the measuring section 5.
- the system controller Via the signal 51, the system controller outputs a measure of the concentration of the substance on the measuring section 5, which is also located in the calibration cell 7.
- the system controller outputs a measure of the reliability of the measured value 51 obtained via the signal 53.
- FIG. 2 shows the block diagram of the evaluation electronics 50.
- the connections of the detectors 10, 20, 30 and 40, the laser control 52, the measure for the reliability of the measured value 53, the measured value 51 itself and the operating state 9 are already shown in FIG.
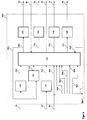
- the signal of the detector 10, the signal of the detector 20, the signal of the detector 30 and the signal of the detector 40 are fed to the filter and amplifier circuit 501.
- the signals of all detectors are brought to a uniform signal level with the aid of this circuit and are freed from undesired higher-frequency signal components.
- the signal of the detector 10 is brought to the above-described signal level in the amplifier and filter circuit 501 and freed of unwanted signal components and passed on as signal 12 via a line to the unit for the evaluation and correction device 504.
- the signal of the detector 20 is brought to the above-described signal level in the circuit 501 and freed of unwanted signal components as signal 22 via a line to the unit for evaluation and correction device 504 and to the laser stabilization 502.
- the signal of the detector 30 is brought to the signal level described above in the circuit 501 and freed of unwanted signal components and passed on as a signal 32 to the laser stabilization 502 via a line.
- the signal of the detector 40 is brought to the signal level described above in the circuit 501 and freed of unwanted signal components as signal 42 and passed on to the laser stabilization 502 via a line.
- the amplifier and filter circuit 501 forwards the current setting values for the amplification to the system controller 550 with the signal 85. With the signal 86, the system controller 550 can influence the setting parameters of the amplifier and filter circuit 501.
- the laser stabilization 502 forms the signal 80 from the input signals 22, 32 and 42, which contains all information about the laser stabilization.
- Signal 80 is routed to system controller 550 via a line.
- the system controller 550 forms the signal 52 for controlling the laser therefrom.
- the evaluation and correction device 504 evaluates the signals 12 and 22 for their correctness and corrects them if necessary. If the laser is tuned in such a way that it emits light at more than two wavelengths, the incoming signals 12 and 22 are divided into a plurality of signal pairs 13 and 23 or 14 and 24 in the evaluation and correction device 504 in such a way that within one signal period the Signals 13, 23, 14 and 24 only two signal pulses occur.
- the system control 550 leads the signal 83 to the evaluation and correction device 504 via a line. With the signal 83, the system controller can activate and deactivate the evaluation and correction device 504.
- the signal 73 is fed from the evaluation and correction device 504 to the system controller 550 via a line. With the signal 73, the evaluation and correction device 504 notifies the system controller 550 to what extent the signals 12 and 22 had to be corrected.
- a signal pair is generated for each characteristic wavelength used. In the case described, these are two pairs.
- Signals 13 and 14 are derived from signal 12.
- Signals 23 and 24 are derived from signal 22.
- the signal 13 is derived in the evaluation and correction device 504 from the signal 12 so that the signal pulse generated by the light pulse with the uncharacteristic light wavelength in the detector 10 and the signal pulse generated by the light pulse with that for the substance in the Cuvette 7 characteristic light wavelength was generated in signal 13 is included.
- the signal 14 is derived in the evaluation and correction device 504 from the signal 12 such that the signal pulse generated by the uncharacteristic light wavelength in the detector 10 and the signal pulse generated by the light pulse having the light wavelength characteristic of the substance in the cuvette 8 was generated in the detector 10, is contained in the signal 14.
- the signal 23 is derived in the evaluation and correction device 504 from the signal 22 such that the signal pulse generated by the light pulse with the uncharacteristic light wavelength in the detector 20 and the signal pulse generated by the light pulse with that for the substance in the Cell 7 characteristic light wavelength was generated in the detector 20, is contained in the signal 23.
- the signal 24 is derived in the evaluation and correction device 504 from the signal 22 so that the signal pulse caused by the uncharacteristic light wavelength was generated in the detector 20 and the signal pulse, which was generated in the detector 20 by the light pulse with the light wavelength characteristic of the substance in the cuvette 8, is contained in the signal 24.
- the signal 13 is conducted via a line from the evaluation and correction device 504 to the measurement value correction and correction 505.
- the signal 23 is conducted via a line from the evaluation and correction device 504 to the measurement value correction and correction 505.
- the signal 14 is conducted via a line from the evaluation and correction device 504 to the measurement value correction and correction 506.
- the signal 24 is conducted via a line from the evaluation and correction device 504 to the measurement value correction and correction 506.
- the measured value formation and correction 505 receives information about the measured value correction from the system controller 550 via the signal 70.
- the measured value formation and correction 506 receives information about the measured value correction from the system controller 550 via the signal 74.
- the measurement value correction and correction 505 notifies the system controller 550 to what extent the measurement value 72 was corrected.
- the measurement value correction and correction 506 notifies the system controller 550 to what extent the measurement value 76 has been corrected.
- measured value generation and correction 505 are described with FIG. 7, and the functions for measured value formation and correction 506 are described with FIG. 8.
- the system controller 550 forwards the information about the structure of the system clocks 82 to the clock generator 503 via a line.
- the clock generator forwards all system clocks 81 to the system controller for synchronization via a line.
- the clock generator forwards the system clocks 91 to the measurement value correction and correction 505 for synchronization via a line.
- the clock generator forwards the system clocks 92 via a line to the measurement value correction and correction 506 for synchronization.
- the clock generator forwards the system clocks 93 to the evaluation and correction device 504 via a line.
- the clock generator forwards the system clocks 94 to the amplifier stage 501 via a line for synchronization.
- the clock generator forwards the system clocks 95 to the laser stabilization 502 for synchronization via a line.
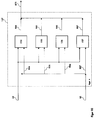
- FIG. 3 shows the block diagram of the filter and amplifier circuit 501.
- the connections to the detectors 10, 20, 30 and 40 and the connections to the evaluation electronics 12, 22, 32, 42, 85, 86 and 94 are already shown in FIG.
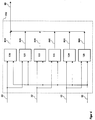
- the electrical signal 11 of the detector 10 is fed to the amplifier and filter 101 via a line.
- the electrical signal 21 of the detector 20 is via a line fed to amplifier and filter 102.
- the electrical signal 31 of the detector 30 is fed to the amplifier and filter 103 via a line.
- the electrical signal 41 of the detector 40 is fed to the amplifier and filter 104 via a line.
- the output signal 12 of the amplifier and filter 101 is obtained from the signal 11 by amplification and filtering.
- the output signal 22 of the amplifier and filter 102 is obtained from the signal 21 by amplification and filtering.
- the output signal 32 of the amplifier and filter 103 is obtained from the signal 31 by amplification and filtering.
- the output signal 42 of the amplifier 104 is obtained from the signal 41 by amplification and filtering.
- the clock signal 900 from the system clock 94 is connected to the amplifier and filter 102 via a line.
- the clock signal 900 from the system clock 94 is connected to the amplifier and filter 103 via a line.
- the clock signal 900 is connected to the filter and amplifier 104 via a line.
- All filters in the amplifiers and filters 101, 102, 103 and 104 are set to the same cut-off frequency.
- the filter is preferably a low-pass filter. Its cutoff frequency is preferably set such that a signal with the same frequency that corresponds to the light pulse repetition rate is not changed. In other words: the cutoff frequency of the filters corresponds to the pulse repetition frequency in the detector signals 11, 21, 31 and 41.
- the amplifiers in the amplifiers and filters 102, 103 and 104 regulate their amplification themselves so that the levels of the signals 22, 32 and 42 are approximately equal.
- the time constant of the control loops is to be set so that there are no vibrations in the control loop and thus undesirable components in the signals 22, 32 and 42 can.
- the change in the amplification factor of the amplifiers and filters 102, 103 and 104 is preferably carried out synchronously with the signal 900 at the beginning of each new signal period. Since the signal evaluation in the downstream electronics only takes place within one signal period, a direct influence on the measured value is prevented.
- the gain factor of the amplifier and filter 101 is set with the signal 110 by the gain setting 105.
- the gain setting 105 is connected via a line to the output signal 12 of the amplifier and filter 101.
- the gain setting 105 receives the clock signal 900 via a line.
- the gain setting 105 receives the clock signal 902 via a line.
- the gain setting 105 receives the clock signal 904 via a line.
- the gain setting 105 receives the signal 861 via a line.
- the gain setting receives the output signal 22 of the amplifier and filter 102 via a line.
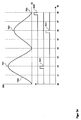
- the gain setting 105 adjusts the level of the signal 12 so that the signal level between the time 730 and the time 732 ( Figure 23) of the signals 12 and 22 is the same. If there is a level difference between signals 12 and 22 between times 730 and 732, the new gain factor is calculated from the level difference and set at time 730.
- the synchronous gain setting at the beginning of a signal period prevents an influence on the measurement result.
- the gain setting 105 receives the signal 861 from the amplifier and filter parameters 86 via a line. With the SIgnal 861 the automatic gain control can be switched off and the gain factor set manually.
- the amplifier and filter 102 receives the signal 862 from the amplifier and filter parameters via a line. The signal 862 can be used to switch off the automatic gain control of the amplifier and filter 102 and to set the gain factor manually.
- the amplifier and filter 103 receives the signal 863 from the amplifier and filter parameters 86 via a line. The signal 863 can be used to switch off the automatic gain control of the amplifier and filter 103 and to set the gain factor manually.
- the amplifier and filter 104 receives the signal 864 from the amplifier and filter parameters 86 via a line. With signal 864, the automatic gain control of the amplifier and filter 104 can be switched off and the gain factor can be specified manually.
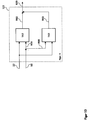
- FIG. 4 shows the block diagram of the signal processing for laser stabilization 502. The external connections have already been described with FIG. 2.
- Signal 22 is the processed signal from detector 20.
- Signal 32 is the processed signal from detector 30.
- Signal 42 is the processed signal from detector 40.
- Signal 95 is the system clock.
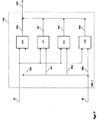
- the signal 22 is connected via a line to the sample & hold circuit 120 and the rectifier circuit 121.
- the signal 32 is connected to the sample & hold circuit 122 and the rectifier circuit 123 via one line each.
- the signal 42 is with the sample & hold - Circuit 124 and the rectifier circuit 125 each connected via a line.
- the system clock 95 is connected to the sample and hold circuit 120 via a line.
- the system clock 95 is connected to the rectifier circuit 121 via a line.
- the system clock 95 is connected to the sample and hold circuit 122 via a line.
- the system clock 95 is connected to the rectifier circuit 123 via a line.
- the system clock 95 is connected to the sample and hold circuit 124 via a line.
- the system clock 95 is connected to the rectifier circuit 125 via a line.
- the output signal 810 of the sample and hold circuit 120 is fed to the laser status signal 80.
- the output signal 820 of the rectifier circuit 121 is supplied to the laser status signal 80.
- the output signal 830 of the sample and hold circuit 122 is fed to the laser status signal 80.
- the output signal 840 of the rectifier circuit 123 is supplied to the laser status signal 80.
- the output signal of the sample and hold circuit 124 is fed to the laser status signal 80.
- the output signal 860 of the rectifier circuit 125 is supplied to the laser status signal 80.
- the sample and hold circuit 120 samples the signal 22 at times specified by the system clock 95.
- the Sample & Hold -. Circuit 122 samples signal 32 at times predetermined by system clock 95.
- the sample & hold circuit 124 samples the signal 42 at times specified by the system clock 95.
- the rectifier circuit 121 determines the maximum value and the average value in the signal 22 within a period specified by the system clock 95.
- the rectifier circuit 123 determines the maximum value and the average value in the signal 32 within a period specified by the system clock 95.
- the rectifier circuit 125 determines the maximum value and the average value in the signal 42 within a period of time predetermined by the system clock 95.
- FIG. 5 shows details of the clock generator 503.
- the external connections 81, 82, 91, 92, 93, 94 and 95 of the clock generator 503 are already shown in FIG.
- Signal 82 is connected to sequence controller 182 via a line.
- Signal 82 is connected to data register 180 via a line.
- Signal 82 is connected to address register 181 via a line.
- the system controller 550 exchanges data with the pattern memory 183 with the aid of the signal 82.
- the sequence controller 182 is connected to the data register 180 via a line through the signal 190.
- the sequence controller 182 is connected to the address register 181 via a line through the signal 192.
- the sequence controller 182 controls the data register 180 and the address register 181 with the signals 190 and 192 in such a way that the system controller can exchange data with the pattern memory 183 without the output of the clock pattern 196 having to be interrupted.
- the sequence controller 182 is connected to the pattern memory 183 via a line through the signal 198.
- the sequence controller 182 is connected to the address generator 184 via a line through the signal 195.
- the sequence controller 182 is connected to the output register 185 via a line through the signal 194.
- the pattern memory is connected to the output register 185 via a line through the signal 196.
- Clock 900 is available at the output register.
- Clock 901 is available at the output register.
- Clock 902 is available at the output register.
- Clock 903 is available at the output register.
- Clock 904 is available at the output register.
- Clock 905 is available at the output register.
- Clock 906 is available at the output register.
- Clock 907 is available at the output register.
- Clock 908 is available at the output register.
- Clock 909 is available on the output register.
- Clock 910 is available on the output register.
- Clock 911 is available on the output register.
- Clock 920 is available on the output register.
- Clock 921 is available on the output register.
- Clock 922 is available on the output register.
- the clocks 900, 901, 902, 903, 904, 905, 906, 907, 908, 909, 910, 911, 920, 921 and 922 are combined to the system clock 81 behind the output register 185.
- the clocks 900, 901, 902, 903, 904, 905, 906, 907, 908, 909, 910, 911, 920, 921 and 922 are combined to form the system clock 91.
- the clocks 900, 901, 902, 903, 904, 905, 906, 907, 908, 909, 910, 911, 920, 921 and 922 are combined to the system clock 92 behind the output register 185.
- the clocks 900, 901, 902, 903, 904, 905, 906, 907, 908, 909, 910, 911, 920, 921 and 922 are combined to the system clock 93 behind the output register 185.
- the clocks 900, 901, 902, 903, 904, 905, 906, 907, 908, 909, 910, 911, 920, 921 and 922 are combined to form the system clock 94.
- the clocks 900, 901, 902, 903, 904, 905, 906, 907, 908, 909, 910, 911, 920, 921 and 922 combined to system clock 95.
- the flow controller coordinates the flow between the address generator 184, the pattern memory 183 and the output register 185 so that a continuous data stream 196 reaches the output register.
- the output register takes over regularly a date from the data stream 196 for output as a clock pattern 900, 901, 902, 903, 904, 905, 906, 907, 908, 909, 910, 911, 920, 921 and 922.
- the system controller stores the clock information via the signal 82 in the pattern memory 182 as follows.
- Clock 900 signals the start of a new signal period and the end of the second characteristic signal pulse in signals 12, 22, 32 and 42
- Clock 901 signals the end of the first quarter of the uncharacteristic signal pulse in signals 12, 22, 32 and 42
- Clock 902 signals the end of the first half of the uncharacteristic signal pulse in signals 12, 22, 32 and 42
- Clock 903 signals the end of the third quarter of the uncharacteristic signal pulse in signals 12, 22, 32 and 42.
- Clock 904 signals the end of the uncharacteristic signal pulse and the beginning of the first characteristic signal pulse in signals 12, 22, 32 and 42.
- Clock 905 signals the end of the first quarter of the first characteristic signal pulse in signals 12, 22, 32 and 42.
- Clock 906 signals the end of the first half of the first characteristic signal pulse in signals 12, 22, 32 and 42.
- Clock 907 signals this End of the third quarter of the first characteristic signal pulse in signals 12, 22, 32 and 42.
- Clock 908 signals the end of the first characteristic signal pulse and the beginning of the second characteristic signal pulse in signals 12, 22, 32 and 42.
- Clock 909 signals the end of the first quarter of the second characteristic signal pulse in signals 12, 22, 32 and 42.
- Clock 910 signals the end of the first half of the second characteristic signal pulse in signals 12, 22, 32 and 42.
- Talt 911 signals this End of the third quarter of the second characteristic signal pulse in signals 12, 22, 32 and 42.
- Clock 920 signals the beginning of the signal period for the measurement value formation.
- Clock 921 signals the middle of the uncharacteristic signal pulse for the measurement value formation.
- Clock 922 signals the middle of the characteristic signal pulse for the measurement value formation.
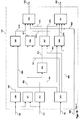
- FIG. 6 shows the evaluation and correction device 504 as a block diagram.
- the signals 93, 12, 22, 13, 23, 73, 14 and 24 have already been described with FIG. 2.
- the input signal 12 is fed to the analog / digital converter 140 via a line.
- the input signal 22 is fed to the analog / digital converter 141 via a line.
- the analog / digital converter 140 converts the analog signal 12 into the digital signal 750.
- the information content of signals 12 and 750 is the same.
- the analog / digital converter 141 converts the analog signal 22 into the digital signal 752.
- the information content of signals 22 and 752 is the same.
- the output signal 750 of the analog / digital converter 140 is fed to the evaluation and correction device 143 via a line.
- the output signal 752 of the analog / digital converter 141 is fed to the evaluation and correction device 143 via a line.
- the setpoint memory 142 is connected to the evaluation and correction device 143 via two lines.
- the setpoint memory can be written to with the setpoints using signal 753. With the signal 751, the evaluation and correction device 143 can read the target value from the target value memory 142.
- the output signal 754 of the evaluation and correction device 143 is fed to the digital / analog converter 144 via a line.
- the digital / analog converter 144 converts the digital signal 754 into the analog signal 13.
- the information content of signals 754 and 13 is the same.
- the output signal 755 of the evaluation and correction device 143 is connected to the digital / analog converter 145 via a line.
- the digital / analog converter 145 converts the digital signal 755 into the analog signal 23.
- the information content of signals 755 and 23 is the same.
- the output signal 756 of the evaluation and correction device 143 is fed to the digital / analog converter 146 via a line.
- the digital / analog converter 146 converts the digital signal 756 into the analog signal 14.
- the information content of signals 756 and 14 is the same.
- the output signal 757 of the evaluation and correction device 143 is fed to the digital / analog converter 147 via a line.
- the digital / analog converter converts the digital signal 757 into the analog signal 24
- the clock 900 is connected to the evaluation and correction device 143 via a line.
- the clock 904 is connected to the evaluation and correction device 143 via a line.
- the clock 906 is connected to the evaluation and correction device 143 via a line.
- the clock 908 is connected to the evaluation and correction device 143 via a line.
- the clock 920 is connected to the evaluation and correction device 143 via a line.
- the clock 921 is connected to the evaluation and correction device 143 via a line.
- the clock 922 is connected to the evaluation and correction device 143 via a line.
- the clock signals 900, 904, 906 and 908 synchronize the evaluation and correction device 143 with the two input signals 12 and 13 or 750 and 752.
- the clock signals 920, 921 and 922 synchronize the output signals 754, 755, 756 and 757 of the evaluation and Correction device 143.
- Clock 900 signals the beginning of a signal period and the end of the second characteristic signal pulse in signals 12 and 22.
- Clock 904 signals the end of the uncharacteristic signal pulse in signals 12 and 22.
- Clock 906 signals the middle of the signal period in signals 12 and 22.
- Clock 908 signals the end of the first characteristic signal pulse in signals 12 and 22.
- Clock 920 signals the start of the signal period of output signals 754, 755, 756 and 757.
- Clock 921 signals the middle of the first pulse in the output signals 754, 755, 756 and 757.
- Clock 922 signals the middle of the second pulse in the output signals 754, 755, 756 and 757.
- the evaluation and correction device 143 reads in the data stream 750 and the data stream 752 within a signal period and temporarily stores both data streams. After the data of one period have been read in, the data of the next signal period are read into another memory.
- the data of the previous signal period are evaluated. All six temporarily stored signal pulses can be standardized for the evaluation. The six standardization factors are buffered. The three signal pulses of the signal 22 are then compared with the target values from the target value memory 142. If the pulses deviate from the stored pulses, the pulses are corrected accordingly. The three signal pulses in signal 22 must always correspond to the values stored in the setpoint memory 142. For further evaluation of the temporarily stored signal pulses, their first derivation is formed and likewise compared with the stored curve for the first derivations from the target value memory and corrected if necessary.
- the signal 22 can only contain interference which was caused by the system itself. The same disturbances are therefore also contained in the signal pulses of the signal 12.
- the signal pulses of the signal 12 are now provided with the same corrections as the signal pulses of the signal 22. After the correction, the signal pulses of the signal 12 are compared with the target values from the target value memory 142. Since the individual pulses have been standardized, but the effect of the absorption of the light beam on the measuring section does not lead to any deformation of the individual light pulses, the causes of pulse changes are different. The normalized pulse can therefore be corrected without a negative effect on the measurement value formation. After the evaluation and correction, the individual pulses are recalculated to their original amplitude using the temporarily stored normalization factors. Alternatively, the saved curve shape can be converted to the current amplitude.
- the two data streams 750 and 752 are divided into the data streams 754, 755, 756 and 757.
- Each of the two data streams 750 and 752 consists of the data of the uncharacteristic light pulse and two characteristic light pulses.
- the data stream 750 is now split up in such a way that the data streams 754 and 756 arise from it.
- the data stream 754 contains the data of the uncharacteristic signal pulse and the data of the first characteristic signal pulse.
- the data stream 756 contains the data of the uncharacteristic signal pulse and the data of the second characteristic signal pulse.
- the data stream 752 is now divided so that the Data streams 755 and 757 arise.
- the data stream 755 contains the data of the uncharacteristic signal pulse and the data of the first characteristic signal pulse.
- the data stream 757 contains the data of the uncharacteristic signal pulse and the data of the second characteristic signal pulse.
- the individual pulses are simultaneously stretched and the phase position of the individual pulses is shifted.
- the uncharacteristic signal pulse is shifted so that it begins at the beginning of the signal period and ends in the middle of the signal period.
- the characteristic signal pulse is shifted so that it begins in the middle of the signal period and ends at the end of the signal period.
- the output of the data streams 754, 755, 756 and 757 is synchronized with the clock signals 920, 921 and 922.
- the measurement value correction and correction 505 is shown in FIG.
- the external connections 13, 23, 91, 70, 71 and 72 have already been described with FIG. 2.
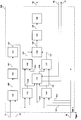
- Signal 13 is connected to subtractor 130 via a line.
- Signal 23 is connected to subtractor 130 via a line.
- the subtractor 130 forms the difference between the signals 13 and 23.
- the selected polarity of the output signal 160 of the subtractor 130 is irrelevant.
- a positive signal 160 is assumed in the following text if the gas selected is located on the measuring section 5 and the evaluation electronics are correctly balanced.
- the output signal 160 of the subtractor 130 is connected to the amplifier 131 via a line.
- the output signal 161 of the amplifier 131 is connected to the filter 132 via a line.
- the filter is preferably a low-pass filter, which frees the signal from unwanted signal components. Its cutoff frequency corresponds to at least half the pulse repetition frequency of the signals 13 and 23, respectively.
- the gain factors of the amplifier 131 can be made adjustable by the system controller 550.
- Another sample & hold element can be connected between the subtractor 138 and the amplifier 139. It only accepts the output signal of the subtractor after it has settled.
- the signal 13 is derived from the electrical signal of the detector 10 behind the measuring section 5.
- the signal 23 is derived from the electrical signal of the detector 20 behind the reference path 6.
- the two signals 13 and 23 are adjusted so that their amplitude during the emission of the uncharacteristic light pulse by the laser 1 is the same.
- the output signal of the subtractor 130 is therefore zero during this emission phase. Since the two signals 13 and 23 are derived from the same light beam 200, changes, e.g. B. in the intensity of the light beam to none other than zero signal 160 at the output of the subtractor 130. So there will be no interference in the light beam 200 caused by the laser and its control in the signal 160.
- the signal 13 will have a smaller amplitude than the signal 23 depending on the concentration of the selected gas.
- the selected gas will attenuate the light beam 203 on the measuring section 5 at the characteristic wavelength proportional to its concentration. Since the selected gas is not on the reference path 6, the light beam 204 is not attenuated.
- the amplitude of the output signal 160 of the subtractor 130 will consequently increase in proportion to the concentration of the selected gas on the measuring path during the emission of the light beam 200 with the characteristic light wavelength.
- the output signal 162 of the filter 132 is fed to the sample & hold circuits 133 and 134 via one line each.
- the clock signal 921 is fed to the sample and hold circuit 133 from the system clock 91 via a line.
- the clock signal 921 signals the center of the uncharacteristic signal pulse.
- the sample and hold circuit 133 thus samples the signal 162 exactly in the middle of the uncharacteristic signal pulse.
- the clock signal 922 is fed to the sample and hold circuit 134 from the system clock 91 via a line.
- the clock signal 922 signals the center of the characteristic light pulse. Sampel & Hold circuit 134 thus samples signal 162 exactly in the middle of the characteristic pulse.
- the output signal 150 of the sample and hold circuit 133 is fed to the sample and hold circuit 136 and the gradient evaluation 135 via one line each.
- the output signal 151 of the sample and hold circuit 134 is supplied to the sample and hold circuit 137 and the gradient evaluation 135 via one line each.
- the clock signal 920 is fed to the gradient evaluation 135 from the system clock 91 via a line.
- the signal 70 of the system controller 550 is fed to the gradient assessment 135 via a line.
- the signal 71 of the gradient assessment 135 is fed to the system controller 550 via a line.
- system controller 550 communicates to gradient assessment 135 the permissible absolute values of signals 150 and 151 and the permissible changes in signals 150 and 151.
- the gradient evaluation 135 communicates to the system controller 550 via the signal 71 in the extent to which it had to block the transmission of signals 150 and 151.
- the gradient evaluation enables the takeover of the signal 150 by the sample and hold circuit 135 at the end of a signal period.
- gradient evaluation 135 enables signal 151 to be taken over by sample and hold circuit 137 at the end of a signal period.
- the output signal 156 of the sample and hold circuit 136 is fed to the subtractor 138 via a line.
- the output signal 157 of the sample and hold circuit 137 is fed to the subtractor 138 via a line.
- the subtractor forms the difference from the signals 136 and 137.
- the subtractor consequently forms the difference in the signal amplitude of the signal 162 during the middle of the characteristic signal pulse and the middle of the uncharacteristic signal pulse. Its output signal 158 is thus a measure of the concentration of the selected gas on the measuring section 5.
- the output signal 158 of the subtractor 138 is fed to the amplifier 139 via a line.
- the output signal 159 of the amplifier 139 is fed to the filter 140 via a line.
- the primary task of the filter 140 is to smooth the signal 159.
- the signal 159 changes stepwise due to the behavior of the sample and hold circuits 133, 134, 136 and 137
- Output signal 72 of filter 140 is fed to the system control for further processing via a line.
- the measured value generation and correction 505 is shown in FIG.
- the external connections 14, 24, 91, 74, 75 and 76 have already been described with FIG. 2.
- Signal 14 is connected to subtractor 230 via a line.
- Signal 24 is connected to subtractor 230 via a line.
- the subtractor 230 forms the difference between the signals 14 and 24.
- the selected polarity of the output signal 260 of the subtractor 230 is irrelevant; to simplify the illustration, a positive signal 260 is assumed in the following text if the selected gas is located on the measuring section 5, which causes the cross-sensitivity and the evaluation electronics are correctly balanced .
- the output signal 260 of the subtractor 230 is connected to the amplifier 231 via a line.
- the output signal 261 of the amplifier 231 is connected to the filter 232 via a line.
- the filter is preferably a low-pass filter, which frees the signal from unwanted signal components. Its cutoff frequency must be adapted to the dynamics of the overall system. Its cutoff frequency corresponds to at least half the pulse repetition frequency of signals 14 and 24, respectively.
- the gain factors of amplifier 231 can be made adjustable by system controller 550.
- Another sample & hold element can be connected between the subtractor 238 and the amplifier 239. It only accepts the output signal of the subtractor after it has settled.
- the signal 14 is derived from the electrical signal of the detector 10 behind the measuring section 5.
- the signal 24 is derived from the electrical signal of the detector 20 behind the reference path 6.
- the two signals 14 and 24 are adjusted so that their amplitude during the emission of the uncharacteristic light pulse by the laser 1 is the same.
- the output signal of the subtractor 230 is therefore zero during this emission phase. Since the two signals 14 and 24 are derived from the same light beam 200, changes, e.g. B. in the intensity of the light beam to none other than zero signal 260 at the output of the subtractor 230. So there will be no interference, the light beam 200, which are caused by the laser and its control, in the signal 260.
- the signal 14 will have a smaller amplitude than the signal 24, depending on the concentration of the selected gas, which is the cause of the cross-sensitivity.
- the selected gas which is the cause of the cross-sensitivity, will attenuate the light beam 203 on the measuring section 5 at the characteristic wavelength proportional to its concentration. Since the selected gas, which is the cause of the cross sensitivity, is not located on the reference path 6, the light beam 204 is not attenuated.
- the amplitude of the output signal 260 of the subtractor 230 will consequently increase during the emission of the light beam 200 with the characteristic light wavelength in proportion to the concentration of the selected gas, which is the cause of the sensitivity, on the measuring section.
- the output signal 262 of the filter 232 is fed to the sample and hold circuits 233 and 234 via one line each.
- the clock signal 921 is fed to the sample and hold circuit 233 via a line.
- the clock signal 921 signals the center of the uncharacteristic signal pulse.
- the sample and hold circuit 233 thus samples the signal 262 exactly in the middle of the uncharacteristic signal pulse.
- the clock signal 922 is supplied to the sample and hold circuit 234 from the system clock 91 via a line.
- the clock signal 922 signals the center of the characteristic light pulse.
- the Sampel & Hold circuit 234 thus samples the signal 262 exactly in the middle of the characteristic pulse.
- the output signal 250 of the sample & hold circuit 233 is fed to the sample & hold circuit 236 and the gradient evaluation 235 via one line each.
- the output signal 251 of the sample and hold circuit 234 is supplied to the sample and hold circuit 237 and the gradient evaluation 235 via one line each.
- the clock signal 920 is fed to the gradient assessment 235 from the system clock 91 via a line.
- the signal 70 of the system controller 550 is fed to the gradient assessment 235 via a line.
- the signal 75 of the gradient assessment 135 is fed to the system controller 550 via a line.
- system controller 550 communicates to gradient assessment 235 the permissible absolute values of signals 250 and 251 and the permissible changes in signals 250 and 251. Via the signal 75, the gradient evaluation 235 informs the system controller 550 of the extent to which it had to block the transmission of the signals 250 and 251.
- the gradient evaluation enables the takeover of the signal 250 by the sample & hold circuit 235 at the end of a signal period.
- the gradient evaluation 235 enables the takeover of the signal 251 by the sample and hold circuit 237 at the end of a signal period.
- the output signal 256 of the sample and hold circuit 236 is led to the subtractor 238 via a line.
- the output signal 257 of the sample and hold circuit 237 is fed to the subtractor 238 via a line.
- the subtractor forms the difference from the signals 236 and 237.
- the subtractor consequently forms the difference in the Signal amplitude of the signal 262 during the middle of the characteristic signal pulse and the middle of the uncharacteristic signal pulse. Its output signal 258 is thus a measure of the concentration of the selected gas, which is the cause of the cross sensitivity, on the measuring section 5.
- the output signal 258 of the subtractor 238 is fed to the amplifier 239 via a line.
- the output signal 259 of the amplifier 239 is fed to the filter 240 via a line.
- the primary function of the filter 240 is to smooth the signal 259.
- the concentration of the selected gas which is the cause of the cross-sensitivity, changes on the measuring section 5
- the signal 259 changes step-wise due to the behavior of the sample & hold circuits 233, 234, 236 and 237.
- the output signal 72 of the filter 240 is fed via a line to the system controller for further processing.
- FIG. 9 shows the part of the laser stabilization that determines the necessary data of the uncharacteristic signal pulse.
- the external connections 22, 95 and 870 have already been described with FIG.
- the signal 22 is fed to the sample & hold circuits 150, 151, 152 and 153 via one line each.
- the clock signal 900 is fed to the sample and hold circuit 150 via a line.
- the clock signal 900 signals the start of a signal period and the start of the uncharacteristic signal pulse.
- the system signal 95 turns the clock signal 901 on via a line the sample & hold circuit 151 performed.
- the clock signal 901 signals the end of the first quarter of the uncharacteristic signal pulse.
- the clock signal 902 is fed from the system clock 95 to the sample & hold circuit 152 via a line.
- the clock signal 902 signals the center of the uncharacteristic signal pulse.
- the clock signal 903 is fed to the Sampel & Hold circuit 153 via a line.
- the clock signal 903 signals the end of the third quarter of the uncharacteristic signal pulse.
- the sample and hold circuit 150 samples the signal 22 at the point in time specified by the signal 900.
- the sample and hold circuit 151 samples the signal 22 at the point in time specified by the signal 901.
- the sample and hold circuit 152 samples the signal at the point in time specified by the signal 902.
- the sample and hold circuit 153 samples the signal 22 at the point in time specified by the signal 903.
- the output signal 980 of the sample and hold circuit 150 and the output signal 981 of the sample and hold circuit 151 and the output signal 982 of the sample and hold circuit 152 and the output signal 983 of the sample and hold circuit 153 are combined to form the signal 870.
- FIG. 10 shows the part of the laser stabilization that determines the necessary data of the first characteristic signal pulse.
- the external connections 22, 95 and 871 have already been described with FIG.
- the signal 22 is fed to the sample & hold circuits 154, 155, 156 and 157 via one line each.
- the clock signal 904 is fed from the system clock 95 to the sample & hold circuit 154 via a line.
- the clock signal 904 signals the beginning of the first characteristic signal pulse.
- the clock signal 905 is fed from the system clock 95 via a line to the sample & hold circuit 155.
- the clock signal 905 signals the end of the first quarter of the first characteristic signal pulse.
- the clock signal 906 is fed from the system clock 95 to the sample & hold circuit 156 via a line.
- the clock signal 906 signals the center of the first characteristic signal pulse.
- From the system clock 95, the clock signal 907 is fed to the Sampel & Hold circuit 157 via a line.
- the clock signal 907 signals the end of the third quarter of the first characteristic signal pulse.
- the sample and hold circuit 154 samples the signal 22 at the point in time specified by the signal 904.
- the sample and hold circuit 155 samples the signal 22 at the point in time specified by the signal 905.
- the sample and hold circuit 156 samples the signal at the point in time specified by the signal 906.
- the sample & hold circuit 157 samples the signal 22 at the point in time specified by the signal 907.
- the output signal 984 of the sample and hold circuit 154 and the output signal 985 of the sample and hold circuit 155 and the output signal 986 of the sample and hold circuit 156 and the output signal 987 of the sample and hold circuit 157 are combined to form the signal 871.
- FIG. 11 shows the part of the laser stabilization that determines the necessary data of the second characteristic signal pulse.
- the external connections 22, 95 and 872 have already been described with FIG.
- the signal 22 is fed via a line to the sample & hold circuits 158, 159, 160 and 161.
- the clock signal 908 is fed from the system clock 95 to the sample & hold circuit 158 via a line.
- the clock signal 908 signals the beginning of the second characteristic signal pulse.
- the clock signal 909 is fed from the system clock 95 via a line to the sample & hold circuit 159.
- the clock signal 909 signals the end of the first quarter of the second characteristic signal pulse.
- the clock signal 910 is led from the system clock 95 via a line to the sample and hold circuit 160.
- the clock signal 910 signals the middle of the second characteristic signal pulse.
- From the system clock 95, the clock signal 911 is fed to the Sampel & Hold circuit 161 via a line.
- the clock signal 91 signals the end of the third quarter of the second characteristic signal pulse.
- the sample & hold circuit 158 samples the signal 22 at the point in time specified by the signal 908.
- the sample and hold circuit 159 samples the signal 22 at the point in time specified by the signal 909.
- the sample and hold circuit 160 samples the signal at the point in time specified by the signal 910.
- the sample and hold circuit 161 samples the signal 22 at the point in time specified by the signal 911.
- the output signal 988 of the sample and hold circuit 158 and the output signal 989 of the sample and hold circuit 159 and the output signal 990 of the sample and hold circuit 160 and the output signal 991 of the sample and hold circuit 161 are combined to form the signal 872.
- FIG. 12 shows the sample & hold circuit 120 for acquiring the reference signal 22.
- the signals 22, 95 and 810 are described with FIG. 4.
- the signal 22 is connected to the sample & hold circuits 126, 127 and 128 via one line each.
- the system clock 95 is connected to the sample & hold circuits 126, 127 and 128 via a line.
- the input signal 870 of the sample and hold circuit 126 and the output signal 871 of the sample and hold circuit 127 and the output signal 872 of the sample and hold circuit 128 are combined to form the signal 810.
- the sample and hold circuit 126 samples the signal 22 during the uncharacteristic signal pulse.
- the sample & hold circuit 127 samples the signal 22 during the first characteristic signal pulse.
- the sample and hold circuit 128 samples the signal during the second characteristic signal pulse.
- FIG. 13 shows the rectifier circuit 121 of the laser stabilization.
- the signals 22, 95 and 820 are described with the figure 4.
- the signal 22 is fed via a line to the rectifier 162 and to the peak value detector 163. From the system clock 95, the clock signal 900 is fed to the rectifier 162 and to the peak value detector 163 via one line each. The output signal 992 of the rectifier 162 and the output signal 993 of the peak value detector are combined to form the signal 820.
- Rectifier 162 rectifies input signal 22 and determines the mean value of the signal amplitude within a signal period, which is predetermined by the signal 900.
- Peak detector 163 determines the peak value in signal 22 that occurs within a signal period.
- FIG. 14 shows the sample & hold circuit for the signal 32 of the calibration path 7.
- the signals 32, 95 and 830 are described with FIG.
- the signal 32 is connected to the sample & hold circuits 164 and 165 via one line each. From the system clock 95, the clock signal 902 is connected to the sample and hold circuit 164 and the clock signal 906 to the sample and hold circuit 165 via a line.
- the output signal 992 of the sample and hold circuit 164 and the output signal 996 of the sample and hold circuit 165 are combined to form the signal 830.
- FIG. 15 shows the rectifier circuit 123 of the laser stabilization.
- the signals 32, 95 and 840 are described with the figure 4.
- the signal 32 is fed to the rectifier 166 and to the peak value detector 167 via one line each.
- the clock signal 900 is fed from the system clock 95 to the rectifier 166 and the peak value detector 167 via one line each.
- the output signal 996 of the rectifier 166 and the output signal 997 of the peak value detector are combined to form the signal 840.
- the rectifier 166 rectifies the input signal 32 and determines the mean value of the signal amplitude within a signal period which is predetermined by the signal 900.
- the peak detector 167 determines the peak in signal 32 that occurs within a signal period.
- FIG. 16 shows the sample and hold circuit for the signal 42 of the calibration path 8.
- the signals 42, 95 and 850 are described with FIG.
- the signal 23 is connected to the sample & hold circuits 168 and 169 via one line each. From the system clock 95, the clock signal 902 is connected to the sample & hold circuit 168 and the clock signal 906 to the sample & hold circuit 169 via one line each.
- the output signal 998 of the sample and hold circuit 168 and the output signal 999 of the sample and hold circuit 169 are combined to form the signal 850.
- FIG. 17 shows the rectifier circuit 125 of the laser stabilization.
- the signals 42, 95 and 860 are described with the figure 4.
- the signal 42 is fed to the rectifier 170 and to the peak value detector 171 via one line each.
- the clock signal 900 is fed to the rectifier 170 and to the peak value detector 171 via one line each.
- the output signal 1000 of the rectifier 170 and the output signal 1001 of the peak value detector are combined to form the signal 860.
- the rectifier 170 rectifies the input signal 42 and determines the mean value of the signal amplitude within a signal period, which is predetermined by the signal 900.
- the peak detector 171 determines the peak in signal 42 that occurs within a signal period.
- the entire laser stabilization is composed of FIGS. 9, 10, 11, 12, 13, 14, 15, 16 and 17.
- the overall function of all modules is explained in the following.
- the laser used is tuned using a vibrating grating.
- the oscillating grating determines the effective resonator length of the laser and thus the light wavelength with which the laser can emit.
- the fill used by the laser determines which wavelengths are actually emitted.
- the position of the vibrating grating can be changed so that its distance from the other end of the resonance body changes and it can be set into vibration.
- the effective length of the laser resonator and thus its tuning is changed by the oscillation of the grating. While the grille swings, its two end positions can be set.
- the task of laser stabilization is to determine these three setting parameters of the oscillating grating in such a way that the laser produces exactly the desired emission.
- the laser is set in a multi-stage process. First, the required three laser lines are searched for. The laser is then stabilized on these lines found.
- the system control 550 controls the laser with any signal 52.
- the clock generator is with loaded with a default pattern.
- the default pattern corresponds to the expected clock pattern, but without the unknown phase shift.
- the signals 992 and 993 are then read in by the system control.
- the signals 992 and 993 indicate the energy with which the laser 1 emits light. If no laser line is tuned, these signals are also zero accordingly.
- the system control 550 now varies the laser control until the signals 992 and 993 get a again decreasing level. In other words: the system control changes the laser control until the laser emits and the emission becomes smaller again.
- phase position of the signals 900, 901, 902, 903, 904, 905, 906, 907, 908, 909, 910 and 911 is changed so that the signal 982, the signal 986 and the signal 990 assume a relative maximum and that Signal 980, signal 984 and signal 988 assume a relative minimum and signal 981 and approximately have the same level as signal 983 and signal 985 have approximately the same level as signal 987 and signal 989 have approximately the same level like the signal 991. If this condition is met and the clock signals 900, 901, 902, 903, 904, 905, 906, 907, 908, 909, 910 and 911 are evenly spaced by about a twelfth of the clock period, the laser emits Light on three lines.
- signal 32 is sampled with the two sample and hold circuits 164 and 165 at the times specified by signals 902 and 906.
- Signal 992 consequently corresponds to the signal level of signal 32 at the maximum of the first signal pulse.
- the signal 996 consequently corresponds to the signal level of the signal 32 in the maximum of the second signal pulse.
- the signal 32 is derived from the detector 30, which is positioned behind the calibration section 7.
- the signal level of signal 992 will approximately correspond to the signal level of signal 982, while with correct laser tuning, the signal level of signal 996 will be significantly below the signal level of signal 986.
- the two sample and hold circuits 168 and 169 are used to sample the signal 42 at the times specified by the signals 902 and 910.
- the signal 998 consequently corresponds to the signal level of the signal 42 in the maximum of the first signal pulse.
- the signal 999 consequently corresponds to the signal level of the signal 42 in the maximum of the third signal pulse.
- the signal 42 is derived from the detector 40, which is positioned behind the calibration path 8.
- the signal level of signal 998 will roughly correspond to the signal level of signal 982, while, with correct laser tuning, the signal level of signal 999 will be significantly below the signal level of signal 990.
- the laser is only properly tuned when all of these conditions are met. In all other cases, signal 52 must be varied further.
- the laser is stabilized using the same device.
- the laser is detuned by means of small variations of the signal 52.
- the direction of the detuning is reversed.
- the laser always drifts around its optimal operating point without ever completely leaving it. If the influence of the laser detuning is so great that the measured value is falsified, the measured value must be corrected accordingly. Since the time of the variation is known, the old measured value can be output after a change has been made until the laser is brought back to its previous setting.
- FIG. 18 describes the gradient evaluation 135.
- the external signals 150, 151, 70, 920, 152 and 153 are described together with FIG. 6.
- the signal 150 is fed to the differentiator 300 and the subtractor 301 via one line each.
- the signal 151 is fed to the differentiator 302 and the subtractor 301 via one line each.
- the signal 150 is derived from the signal of the detector 10 behind the measuring section 5.
- the signal 151 is derived from the signal of the detector 20 behind the reference path 6.
- the differentiator 300 forms the first derivative from the signal 150.
- the differentiator 302 forms the first derivative from the signal 151.
- the subtractor 301 forms the difference from the signals 150 and 151.
- the output signal 350 of the differentiator 300 is led to the window discriminator 305 via a line.
- the output signal 353 of the subtractor 301 is conducted via a line to the differentiator 304 and to the window discriminator 306.
- the output signal of the differentiator 302 is led to the window discriminator 308 via a line.
- the differentiator 304 forms the first derivative of the signal 352.
- the output signal 353 of the differentiator 304 is led to the window discriminator 307 via a line.
- the signal 70 is led via a line to the limit value memory 303. With the signal 70, the system controller 550 notifies the gradient evaluation 135 of the current limit values of the signals 350, 351, 352 and 353.
- the output signal 360 of the limit value memory 303 is led to the window discriminator 305 via a line.
- the output signal 361 of the limit value memory 303 is led via a line 361 to the window discriminator 306.
- the output signal 362 of the limit value memory 303 is led to the window discriminator 307 via a line.
- the output signal 363 of the limit value memory 303 is led to the window discriminator 308 via a line.
- Signal 360 represents the signal range within which signal 350 is rated as good.
- the signal 361 represents the signal range within which the signal 352 is rated as good.
- the signal 362 represents the signal range within which the signal 353 is rated as good.
- Signal 363 represents the signal range within which signal 351 is rated as good.
- the output signal 370 of the window discriminator 305 is fed via a line to the logic circuit 310.
- the output signal 371 of the window discriminator 306 is fed to the logic circuit 310 via a line.
- the output signal 372 of the window discriminator 306 is supplied to the logic circuit 311 via a line.
- the output signal 373 of the window discriminator 307 is supplied to the logic circuit 310 via a line.
- the output signal 374 of the window discriminator 307 is supplied to the logic circuit 311 via a line.
- the output signal 375 of the window discriminator 308 is supplied to the logic circuit 311 via a line.
- the clock signal 920 is supplied to the logic circuit 310 and the logic circuit 311 via one line each.
- the clock signal 920 signals the end of an evaluation signal period. If the current signal level of signals 150 and 151 is found to be good, then at the end of the evaluation signal period with the signals 152 and 153 accepted and output.
- the logic circuit outputs the signal 920 unchanged as the output signal 152 if the signal 370, the signal 371 and the signal 373 evaluate the input signals 150 and 151 as good.
- the logic circuit 311 outputs the signal 920 unchanged as the output signal 153 when the signal 374, the signal 375 and the signal 372 evaluate the input signals 150 and 151 as good. If one of the window discriminators 305, 306, 307 and 308 does not judge only one parameter of the input signals 150 and 151 as good, the clock signal 920 is not passed on.
- FIG. 19 describes the gradient evaluation 235.
- the external signals 250, 251, 74, 920, 252 and 253 are described together with FIG. 7.
- the signal 250 is fed to the differentiator 400 and the subtractor 401 via one line each.
- the signal 251 is fed to the differentiator 402 and the subtractor 401 via one line each.
- the signal 250 is derived from the signal of the detector 10 behind the measuring section 5.
- the signal 251 is derived from the signal of the detector 20 behind the reference path 6.
- the differentiator 400 forms the first derivative from the signal 250.
- the differentiator 402 forms the first derivative from the signal 251.
- the subtractor 401 forms the difference from the signals 250 and 251.
- the output signal 450 of the differentiator 400 is led to the window discriminator 405 via a line.
- the output signal 453 of the subtractor 401 is connected via a line to the differentiator 404 and to the window discriminator 406 led.
- the output signal of the differentiator 402 is fed to the window discriminator 408 via a line.
- the differentiator 404 forms the first derivative of the signal 452.
- the output signal 453 of the differentiator 404 is led to the window discriminator 407 via a line.
- the signal 70 is led via a line to the limit value memory 403. With the signal 70, the system controller 550 notifies the gradient evaluation 235 of the current limit values of the signals 450, 451, 452 and 453.
- the output signal 460 of the limit value memory 403 is led to the window discriminator 405 via a line.
- the output signal 461 of the limit value memory 403 is led via a line 461 to the window discriminator 406.
- the output signal 462 of the limit value memory 403 is led to the window discriminator 407 via a line.
- the output signal 463 of the limit value memory 403 is led to the window discriminator 408 via a line.
- the signal 460 represents the signal range within which the signal 450 is rated as good.
- the signal 461 represents the signal range within which the signal 452 is rated as good.
- Signal 462 represents the signal range within which signal 453 is rated as good.
- Signal 463 represents the signal range within which signal 451 is rated as good.
- the output signal 470 of the window discriminator 405 is supplied to the logic circuit 410 via a line.
- the output signal 471 of the window discriminator 406 is supplied to the logic circuit 410 via a line.
- the window discriminator output signal 472 406 is supplied to the logic circuit 411 via a line.
- the output signal 473 of the window discriminator 407 is supplied to the logic circuit 410 via a line.
- the output signal 474 of the window discriminator 407 is supplied to the logic circuit 411 via a line.
- the output signal 475 of the window discriminator 408 is supplied to the logic circuit 411 via a line.
- the clock signal 920 is supplied to the logic circuit 410 and the logic circuit 411 via one line each.
- the clock signal 920 signals the end of an evaluation signal period. If the current signal level of signals 250 and 251 is found to be good, signals 252 and 253 are adopted and output at the end of the evaluation signal period.
- the logic circuit outputs the signal 920 unchanged as the output signal 252 when the signal 470, the signal 471 and the signal 473 evaluate the input signals 250 and 251 as good.
- the logic circuit 411 outputs the signal 920 unchanged as the output signal 253 if the signal 474, the signal 475 and the signal 472 evaluate the input signals 250 and 251 as good. If one of the window discriminators 405, 406, 407 and 408 does not judge only one parameter of the input signals 250 and 251 as good, the clock signal 920 is not passed on.
- FIG. 20 shows a preferred alternative to the processing of measured values in FIGS. 7 and 8.
- the subtractor 1130 is connected to the signal 13 via a line.
- the subtractor 1130 is connected to the signal 23 via a line.
- the subtractor 1130 forms the difference between the two input signals 13 and 23.
- the output signal 1160 of the subtractor is fed to the FFT analyzer 1131 via a line.
- the output signal 1161 of the FFT analyzer 1131 is fed to the amplifier 1132.
- the FFT analyzer 1131 is set so that only a signal with half the pulse repetition frequency appears at its output, as occurs in the two input signals 13 and 23 of the subtractor 1130.
- the amplitude of this signal is proportional to the concentration of the selected gas on the measuring section 5.
- FIG. 21 shows a preferred alternative form of laser stabilization.
- the signals 22, 32 and 80 are described with Figure 2.
- the signal 22 is fed to the FFT analyzer 1500 via a line.
- the signal 32 is fed to the FFT analyzer 1501 via a line.
- the output signal 1510 and the output signal 1520 of the FFT analyzer 1500 as well as the output signal 1530 and the output signal 1540 of the FFT analyzer 1501 are combined to form the signal 80.
- the FFT analyzer 1500 performs a Fourier analysis of the signal 22.
- the signal 1510 outputs the Fourier factor at the frequency that corresponds to half the pulse repetition frequency.
- the signal 1520 outputs the Fourier factor at the frequency which corresponds to the repetition frequency of the pusl.
- the FFT analyzer 1501 performs a Fourier analysis of the signal 32.
- the signal 1530 outputs the Fourier factor at the frequency which corresponds to half the pulse repetition frequency.
- he gives with the signal 1540 the Fourier factor at the frequency that corresponds to the pulse repetition frequency.
- the laser can only emit energy at two light wavelengths or before the laser tuning 502, the signals 22, 32 and 42 are divided into signal pairs according to the same method as is done by means of the device 504 in order to convert the signals 12 and 22 to win the signals 13 and 23 or 14 and 24. All components for processing the signal 42 are dispensed with in the case of the restriction to two signal pulses.
- the signal 22 is derived from the light beam that radiates through the reference path 6.
- the signal 32 is derived from the light beam that radiates through the calibration path 7.
- the signal 22 is consequently a direct image of the laser emission.
- the signal 32 is also an image of the laser emission during the transmission of the uncharacteristic light beam, while the characteristic light beam is strongly attenuated on the calibration path during the transmission.
- the characteristic light pulse is consequently contained in the signal 32 in a greatly weakened manner.
- the signal 22 of the correctly balanced laser is broken down into its spectral components, it can be seen that there are essentially only portions at the same frequency that correspond to the pulse repetition frequency in the signal 22. All other parts are only available depending on the pulse curve shape. If the signal 32 of the correctly balanced laser is broken down into its spectral components, it can be seen that there are essentially only portions at half and at the entire frequency which correspond to the repetition frequency in signal 32. If the laser is incorrectly adjusted, the spectral composition of signals 22 and 32 also changes.
- the laser 1 is controlled with any signal 52 that is varied until the signal 1520 takes a maximum and the signal 1510 takes a minimum, while the signal 1530 takes a maximum and the signal 1540 takes a maximum. This is always the case when the signal pulses in the signal 32 occur with a maximum amplitude and a signal pulse occurs in the signal with a maximum amplitude while the second signal pulse occurs in the signal 32 with a minimum amplitude.
- the laser is continuously slightly detuned during operation.
- the detuning direction is always reversed when the signals 1510, 1520, 1530 and 1540 deteriorate in accordance with the above condition.
- phase position and curve shape of the signals used here are described below.
- FIG. 22 shows the idealized relationship between the clock signals 900, 901, 902, 903, 904, 905, 906, 907, 908, 909, 910 and 911 and the detector signals 11, 21, 31 and 42 and the signals derived from the detector signals 12, 22, 32 and 42.
- Signal 930 corresponds to the expected curves of signals 11, 21, 31, 41, 12, 22, 32 and 42.
- the signal 930 represents three pulse trains. To simplify the illustration, let us consider the first pulse, the uncharacteristic pulse.
- the uncharacteristic pulse is caused by the light pulse, the light wavelength of which is uncharacteristic for all substances on the measuring section 5.
- the second pulse is the first characteristic pulse.
- the first characteristic pulse is caused by the light pulse, the light wavelength of which is characteristic of the gas which is located in the cuvette on the calibration path 7.
- the third pulse is the second characteristic pulse.
- the second characteristic pulse is caused by the light pulse, the light wavelength of which is characteristic of the gas which is located in the cuvette on the calibration path 8.
- the first pulse is directly proportional to the laser's emission while this light emits the uncharacteristic light wavelength.
- the second pulse is proportional to the laser emission during which light of the first characteristic light wavelength is emitted, weakened by the absorption of the light beam on the measuring section 5.
- the absorption depends on the concentration of the selected gas which is in the cuvette on the calibration section 7 the measuring section 5 and, if there is cross sensitivity, the concentration of the selected gas, which are located in the cuvette on the calibration section 8.
- the third pulse is proportional to the laser emission during which light of the second characteristic light wavelength is emitted, weakened by the absorption of the light beam on the measuring section 5.
- the absorption depends on the concentration of the selected gas which is located in the cuvette on the calibration section 8.
- the difference in the amplitude between the first and the second pulse 931 is consequently a measure of the concentration of the two gases on the measuring section 5.
- the difference in the amplitude between the first and the third pulse 932 is consequently a measure of the concentration of the second Gases on the measuring section 5.
- clock signal 900 signals the beginning of a new signal period and the end of the last signal period.
- fact signal 901 signals the end of the first quarter of the uncharacteristic signal pulse.
- the clock signal 902 signals the center of the uncharacteristic signal pulse.
- the clock signal 903 signals the end of the third quarter of the uncharacteristic signal pulse.
- the clock signal 904 signals the end of the uncharacteristic signal pulse and the beginning of the characteristic signal pulse.
- clock signal 905 signals the end of the first quarter of the first characteristic signal pulse.
- clock signal 906 signals the center of the characteristic signal pulse.
- clock signal 907 signals the end of the third quarter of the first characteristic signal pulse.
- clock signal 908 signals the end of the first characteristic signal pulse and the beginning of the second characteristic signal pulse.
- clock signal 909 signals the end of the first quarter of the second characteristic signal pulse.
- clock signal 910 signals the center of the second characteristic signal pulse.
- clock signal 911 signals the end of the third quarter of the second characteristic signal pulse.
- the clock signals 900, 901, 902, 903, 904, 905, 906, 907, 908, 909, 910 and 911 are set by the system controller so that the above phase relationship applies.
- FIG. 23 shows an idealized detector signal and its division into two signals.
- the curve 700 corresponds to the curve of the signals 11, 21, 31, 41, 12, 22, 32 and 42.
- the curve 710 corresponds to the curve of the signals 13 and 23.
- the curve 720 corresponds to the curve of the signals 14 and 24.
- the upper curve 700 represents a period of an idealized detector signal.
- the curve 700 begins at time 730 at a relative minimum. By time 731, the signal level rises to a relative maximum. Between time 731 and time 732, the signal level drops to a relative minimum.
- the signal pulse 731 lies between the times 730 and 732. Between the times 732 and 733, the signal level rises again to a relative maximum. Between time 733 and time 734, the signal level drops to a relative minimum.
- the signal pulse 702 lies between the times 732 and 734. Between the times 734 and 735 the signal level rises to a relative maximum. Between times 735 and 736, the signal level drops to a relative minimum.
- the signal pulse 703 lies between the times 734 and 736.
- the signal period of the signal 700 begins at time 730 and ends at time 736.
- the signal levels at times 730, 732, 734 and 736 need not be the same.
- the signal levels at times 731, 733 and 735 need not be the same.
- the first signal pulse 701 was created due to the emission of light by the laser 1 with the uncharacteristic light wavelength.
- the second signal pulse 702 originated on the basis of the emission by the laser 1 with the first characteristic light wavelength.
- the third signal pulse resulted from the emission by the laser 1 with the second characteristic light wavelength.
- the amplitude of the signal pulse 701 corresponds to the laser emission in all four signals 11, 21, 31 and 41 shown.
- the amplitude of the signal pulse 702 corresponds to the laser emission in the case of the signal 21.
- the amplitude of the signal pulse 702 corresponds to the signal 31 of the laser emission weakened by the absorption of the light beam on the calibration path 7, in which there is a cuvette with a gas, for which the light wavelength of the assigned light pulse is characteristic.
- the amplitude of the signal pulse 702 corresponds to the signal 31 of the laser emission weakened by the absorption of the light beam on the calibration path 8, in which there is a cuvette with a gas, for which the light wavelength of the assigned light pulse is also characteristic.
- the amplitude of the signal pulse 702 corresponds to the laser emission in the signal 41.
- the amplitude of the signal pulse 703 corresponds to the laser emission in the signal 21.
- the amplitude of the signal pulse 703 corresponds to the laser emission in the case of the signal 31.
- the amplitude of the signal pulse 703 corresponds to the laser emission weakened by the absorption of the light beam on the calibration path 8, in which there is a cuvette with a gas for which it is characteristic of the light wavelength of the assigned light pulse.
- the amplitude of the signal pulse 701 in the signal 11 corresponds to the laser emission possibly weakened by the constant absorption of the light beam 203 on the measuring path 5.
- the amplitude of the signal pulse 702 in the signal 11 corresponds to the laser emission possibly weakened by the constant absorption of the light beam 203 on the measuring path 5 and weakened by the absorption by the gas which is also on the calibration section 7 and by the absorption by the gas which is also on the calibration section 8.
- the absorption of the light beam 203 on the measuring section 5 by the gas, which is also on the calibration section 7, is proportional to the concentration of this gas on the measuring section 5 and proportional to the concentration of the gas, which is also on the calibration section 8, on the Measuring section 5.
- the amplitude of the signal pulse 703 in the signal 11 corresponds to the laser emission possibly weakened by the constant absorption of the light beam 23 on the measuring section 5 and weakened by the absorption of the light beam 203 on the measuring section 5 by the gas, which is also on the calibration section 8 is located.
- the absorption of the light beam 203 on the measuring section 5 by the gas, which is also located on the calibration section 8, is proportional to the concentration of this gas on the measuring section.
- the light wavelength of the light pulse assigned to the signal pulse 702 is characteristic of the two gases which are located in the cuvettes of the two calibration sections 7 and 8. Since it cannot be differentiated on the measuring section 5, whether due to the absorption by the substance located on the calibration section 7 or whether due to the absorption by the material located on the calibration section 8, the light beam 203 is absorbed at the first characteristic light wavelength , one speaks generally of a cross sensitivity.
- the middle curve 710 corresponds to the idealized curve of the divided signals 13 and 23.
- Curve 710 begins at time 740 at a relative minimum. Between times 740 and 741, the signal level rises to a relative maximum. Between times 741 and 742, the signal level drops to a relative level Minimum from. The signal pulse 711 lies between the times 740 and 742. Between the times 742 and 743, the signal level rises to a relative maximum. Between times 743 and 744, the signal level drops to a relative minimum. The signal pulse 712 lies between the times 742 and 744.
- the lower curve 720 corresponds to the idealized curve of the divided signals 14 and 24.
- Curve 720 begins at time 750 at a relative minimum. Between times 750 and 751, the signal level rises to a relative maximum. Between times 751 and 752, the signal level drops to a relative minimum. The signal pulse 721 lies between the times 750 and 752. Between the times 752 and 753, the signal level rises to a relative maximum. Between times 753 and 754, the signal level drops to a relative minimum. The signal pulse 722 lies between the times 752 and 754.
- Curves 710 and 720 are obtained from curve 700.
- the signal pulses 711 and 721 are derived from the signal pulse 701.
- the signal pulse 712 is derived from the signal pulse 702.
- the signal pulse 722 is derived from the signal pulse 703.
- the signal period of the curves 700, 710 and 720 is the same.
- the amplitude of the signal pulse 711 at time 741 and the amplitude of the signal pulse 721 at time 751 corresponds to the amplitude of the signal pulse 701 at time 731.
- the amplitude of the signal pulse 712 corresponds to the amplitude of the signal pulse 702 at time 733.
- the amplitude of the signal pulse 722 corresponds to the amplitude of the signal pulse 703 at time 735.
- the amplitude of the signal pulse 711 at time 740 and the amplitude of the signal pulse 721 at time 750 corresponds to the amplitude of the signal pulse 701 at time 730.
- the amplitude of the signal pulse 711 at time 742 and the amplitude of the signal pulse 721 at time 752 corresponds to the amplitude of the signal pulse at time 732.
- the amplitude of the signal pulse 721 at time 742 corresponds to the amplitude of the signal pulse 733 at time 732
- the amplitude of the signal pulse 712 at time 744 corresponds to the amplitude of the signal pulse 702 at time 734.
- the amplitude of the signal pulse 722 at time 752 corresponds to the amplitude of the signal pulse 703 at time 734.
- the amplitude of the signal pulse 722 at time 754 corresponds to the amplitude of the signal pulse 735 at time 736.
- the timing of the signal pulse 701 is stretched for conversion into the signal pulses 711 and 721 so that the time 740 and the time 750 are like the time 730 at the beginning of the signal period and the time 732 is shifted so that it is the time 742 and .752 comes to a stop exactly in the middle of the signal period.
- the other times between 740 and 742 or between 750 and 752 are stretched by the same factor.
- the timing of the signal pulse 702 is shifted and stretched for conversion into the signal pulse 712 so that the time 732 is shifted so that it comes to a stop exactly in the middle of the signal period as the time 742.
- the time 734 becomes the conversion into the time 744 is first shifted by the same value by which time 732 was shifted when it was converted to time 742, and then the time sequence between times 732 and 734 is expanded so that the signal pulse lasts exactly half a signal period. All times between 732 and 734 are also shifted and stretched to be converted to times between 742 and 744.
- the timing of the signal pulse 703 is shifted and stretched for conversion into the signal pulse 722 so that the time 734 is shifted so that it comes to a stop exactly in the middle of the signal period as time 752. Of the Event 736 remains at the end of the signal period when converted to event 754.
- the time sequence between times 734 and 736 is then expanded such that the signal pulse lasts exactly half a signal period. All times between 734 and 736 are also shifted and stretched to be converted to times between 752 and 754.
- the curve 700 is divided into curves 710 and 720 with a phase shift of approximately 360 °.
- the curve 700 is completely stored in a buffer in order to be divided into the two curves 710 and 720 in the subsequent signal period.
- FIG. 24 shows the temporal relationships between the signals 13, 23, 14 and 24 and the clock signals 920, 921 and 922.
- Curve 760 represents an idealized curve of signals 13, 23, 14 and 24. Curves 710 and 720 of FIG. 23 represent similar ones.
- the clock signal 921 signals with its falling signal edge the middle 761 of the first push of the curve 760.
- the clock signal 922 signals with its falling edge the middle 762 of the second pulse of the curve 760.
- the clock signal 920 signals with its falling edge the end of the signal period of the curve 763.
- FIG. 25 shows the idealized curve of signals 11, 21, 31, 41, 12, 22, 32 and 42, its tolerance limits and the first derivative with tolerance limits.
- the tolerance limits were deliberately chosen to be larger.
- the curve 770 represents the idealized curve within a signal period of the signals 11, 21, 31, 41, 12, 22, 32 and 42.
- the curves 771 and 772 represent the tolerance range within which the signals mentioned must move.
- the curve 780 represents the idealized curve within a signal period of the first derivative of the signals 11, 21, 31, 41, 12, 22, 32 and 42.
- the curves 781 and 782 represent the tolerance range within which the first derivative of the above Signal must move.
- FIG. 26 shows the idealized curve shapes for the measurement value formation.
- Curve 790 corresponds to signals 23 and 24.
- Curve 791 corresponds to signals 13 and 14.
- Curve 792 corresponds to signals 160 and 260.
- the level difference in between the signals can also be used 12 and 22 are determined during the uncharacteristic signal pulse and the measured value is subsequently corrected therewith.
- FIG. 27 shows the idealized output signal 11, 21, 31 and 41 of a detector 10, 20, 30 and 40 in the time domain 620 and the spectrum 630 of this signal.
- the signal pulse 600 is caused by the uncharacteristic light pulse.
- the signal pulse 601 is caused by the characteristic light pulse.
- the distance between the signal pulses is constant.
- the spectral line 611 corresponds to the pulse repetition frequency of the light pulses.
- the spacing of the spectral lines 610 and 611 corresponds to half the pulse repetition frequency.
- the spectral line 610 corresponds to half the pulse repetition frequency.
- the spacing of the spectral lines 611 and 612 corresponds to half the pulse repetition frequency.
- the spectral line 612 corresponds to one and a half times the pulse repetition frequency.
- the height of the spectral line 610 or 612 depends on the attenuation of the characteristic light pulse on the measuring path 5. If the light beam is not attenuated and the laser emits an ideal light signal, the spectral lines 610 and 612 and all other odd spectral lines disappear. If the characteristic light pulse is completely absorbed on the measuring path 5, the signal 620 only consists of the characteristic signal pulses 601. The spectral line 611 also disappears in the spectrum.
- the spectral lines are repeated.
- the information content of the spectrum remains unchanged.
- the ratio of any pair of spectral lines can be used for the evaluation.
- the methods according to the invention are in principle not limited to the use of lasers as a radiation source. Any radiation source that can emit radiation that is characteristic of a substance can be used. The only decisive factor is that there are detectors for the radiation used, which generate an electrical signal that is proportional to the incident radiation energy.
Landscapes
- Physics & Mathematics (AREA)
- Spectroscopy & Molecular Physics (AREA)
- Analytical Chemistry (AREA)
- Health & Medical Sciences (AREA)
- Life Sciences & Earth Sciences (AREA)
- Chemical & Material Sciences (AREA)
- Biochemistry (AREA)
- General Health & Medical Sciences (AREA)
- General Physics & Mathematics (AREA)
- Immunology (AREA)
- Pathology (AREA)
- Optics & Photonics (AREA)
- Investigating Or Analysing Materials By Optical Means (AREA)
- Analysing Materials By The Use Of Radiation (AREA)
Priority Applications (3)
| Application Number | Priority Date | Filing Date | Title |
|---|---|---|---|
| EP93120005A EP0657731B1 (fr) | 1993-12-10 | 1993-12-10 | Procédé et appareil pour déterminer une absorption caractéristique d'une substance |
| DE59309518T DE59309518D1 (de) | 1993-12-10 | 1993-12-10 | Verfahren und Vorrichtung zur Auswertung einer charakteristischen Absorption eines Stoffes |
| AT93120005T ATE178989T1 (de) | 1993-12-10 | 1993-12-10 | Verfahren und vorrichtung zur auswertung einer charakteristischen absorption eines stoffes |
Applications Claiming Priority (1)
| Application Number | Priority Date | Filing Date | Title |
|---|---|---|---|
| EP93120005A EP0657731B1 (fr) | 1993-12-10 | 1993-12-10 | Procédé et appareil pour déterminer une absorption caractéristique d'une substance |
Publications (2)
| Publication Number | Publication Date |
|---|---|
| EP0657731A1 true EP0657731A1 (fr) | 1995-06-14 |
| EP0657731B1 EP0657731B1 (fr) | 1999-04-14 |
Family
ID=8213481
Family Applications (1)
| Application Number | Title | Priority Date | Filing Date |
|---|---|---|---|
| EP93120005A Expired - Lifetime EP0657731B1 (fr) | 1993-12-10 | 1993-12-10 | Procédé et appareil pour déterminer une absorption caractéristique d'une substance |
Country Status (3)
| Country | Link |
|---|---|
| EP (1) | EP0657731B1 (fr) |
| AT (1) | ATE178989T1 (fr) |
| DE (1) | DE59309518D1 (fr) |
Cited By (1)
| Publication number | Priority date | Publication date | Assignee | Title |
|---|---|---|---|---|
| CN109596538A (zh) * | 2017-10-03 | 2019-04-09 | 株式会社堀场制作所 | 分析装置和分析方法 |
Citations (6)
| Publication number | Priority date | Publication date | Assignee | Title |
|---|---|---|---|---|
| DE3106331A1 (de) * | 1981-02-20 | 1982-09-30 | Fraunhofer-Gesellschaft zur Förderung der angewandten Forschung e.V., 8000 München | "geraet zur bestimmung der konzentration eines bestandteils einer gasprobe unter hochdruckbedingungen" |
| EP0197917A2 (fr) * | 1985-04-04 | 1986-10-15 | AVL Gesellschaft für Verbrennungskraftmaschinen und Messtechnik mbH.Prof.Dr.Dr.h.c. Hans List | Procédé pour la détermination périodique d'une grandeur mesurable et dispositif pour la mise en oeuvre du procédé |
| EP0244721A2 (fr) * | 1986-05-06 | 1987-11-11 | Wolfgang Eichler KG | Procédé et système pour mesurer la transmission optique |
| EP0318752A2 (fr) * | 1987-12-03 | 1989-06-07 | Techform Engineering Ag | Système pour l'analyse de traces de gaz |
| WO1989012222A1 (fr) * | 1988-06-08 | 1989-12-14 | Riener, Karl, Stefan | Procede et dispositif de depistage spectroscopique quantitatif des gas contenus dans un melange de gas |
| WO1992004614A1 (fr) * | 1990-09-07 | 1992-03-19 | Chlean Plants & Engineering Establishment | Procede pour la determination de la concentration de substances, dispositif pour la mise en ×uvre de ce procede, application dudit procede pour faire varier la concentration d'une substance contenue dans un fluide et appareillage y relatif |
-
1993
- 1993-12-10 EP EP93120005A patent/EP0657731B1/fr not_active Expired - Lifetime
- 1993-12-10 AT AT93120005T patent/ATE178989T1/de not_active IP Right Cessation
- 1993-12-10 DE DE59309518T patent/DE59309518D1/de not_active Expired - Fee Related
Patent Citations (6)
| Publication number | Priority date | Publication date | Assignee | Title |
|---|---|---|---|---|
| DE3106331A1 (de) * | 1981-02-20 | 1982-09-30 | Fraunhofer-Gesellschaft zur Förderung der angewandten Forschung e.V., 8000 München | "geraet zur bestimmung der konzentration eines bestandteils einer gasprobe unter hochdruckbedingungen" |
| EP0197917A2 (fr) * | 1985-04-04 | 1986-10-15 | AVL Gesellschaft für Verbrennungskraftmaschinen und Messtechnik mbH.Prof.Dr.Dr.h.c. Hans List | Procédé pour la détermination périodique d'une grandeur mesurable et dispositif pour la mise en oeuvre du procédé |
| EP0244721A2 (fr) * | 1986-05-06 | 1987-11-11 | Wolfgang Eichler KG | Procédé et système pour mesurer la transmission optique |
| EP0318752A2 (fr) * | 1987-12-03 | 1989-06-07 | Techform Engineering Ag | Système pour l'analyse de traces de gaz |
| WO1989012222A1 (fr) * | 1988-06-08 | 1989-12-14 | Riener, Karl, Stefan | Procede et dispositif de depistage spectroscopique quantitatif des gas contenus dans un melange de gas |
| WO1992004614A1 (fr) * | 1990-09-07 | 1992-03-19 | Chlean Plants & Engineering Establishment | Procede pour la determination de la concentration de substances, dispositif pour la mise en ×uvre de ce procede, application dudit procede pour faire varier la concentration d'une substance contenue dans un fluide et appareillage y relatif |
Cited By (2)
| Publication number | Priority date | Publication date | Assignee | Title |
|---|---|---|---|---|
| CN109596538A (zh) * | 2017-10-03 | 2019-04-09 | 株式会社堀场制作所 | 分析装置和分析方法 |
| CN109596538B (zh) * | 2017-10-03 | 2023-08-25 | 株式会社堀场制作所 | 分析装置和分析方法 |
Also Published As
| Publication number | Publication date |
|---|---|
| DE59309518D1 (de) | 1999-05-20 |
| ATE178989T1 (de) | 1999-04-15 |
| EP0657731B1 (fr) | 1999-04-14 |
Similar Documents
| Publication | Publication Date | Title |
|---|---|---|
| DE4342246C2 (de) | Charakteristische Absorption | |
| EP2803975B1 (fr) | Procédé destiné à la spectroscopie laser de gaz | |
| EP0318752B1 (fr) | Système pour l'analyse de traces de gaz | |
| WO2018115472A1 (fr) | Procédé de correction de la longueur d'onde et de la gamme d'accord d'un spectromètre à laser | |
| EP2985592A1 (fr) | Spectromètre à absorption et procédé destiné à mesurer la concentration d'un composant gazeux pertinent d'un gaz de mesure | |
| EP0780681B1 (fr) | Analyseur de gaz à deux faisceaux et procédé pour son étalonnage | |
| DE102020115338B3 (de) | Optische Abtastung | |
| EP3798611B1 (fr) | Procédé et analyseur de gaz permettant de mesurer la concentration d'un composant gazeux dans un gaz mesuré | |
| DE102013213458B4 (de) | Verfahren zur Messung der Konzentration einer Gaskomponente in einem Messgas | |
| EP0345895A1 (fr) | Procédé et dispositif pour la détermination spectroscopique de quantités de gaz dans des mélanges gazeux | |
| DE69315015T2 (de) | Spektrophotometrische Methode und Spektrophotometer zur Druchführung der Methode | |
| DE3240559C2 (de) | Verfahren zur kontinuierlichen Messung der Masse von Aerosolteilchen in gasförmigen Proben sowie Vorrichtung zur Durchführung des Verfahrens | |
| DE3207377A1 (de) | Vorrichtung zur durchfuehrung einer spektralanalyse | |
| DE10207733B4 (de) | Spektroskopieverfahren | |
| EP3112846A1 (fr) | Procede de determination de la concentration d'un composant gazeux et spectrometre associe | |
| DE102009059962A1 (de) | NDIR-Zweistrahl-Gasanalysator und Verfahren zur Bestimmung der Konzentration einer Messgaskomponente in einem Gasgemisch mittels eines solchen Gasanalysators | |
| DE102016108267B4 (de) | Vorrichtung und Verfahren zum Ermitteln einer Konzentration von wenigstens einer Gaskomponente eines Gasgemischs | |
| EP2172817B1 (fr) | Détection des variations d'un intervalle de temps entre des signaux optiques ou électriques | |
| DE69122564T2 (de) | Gasanalysator | |
| EP0657731B1 (fr) | Procédé et appareil pour déterminer une absorption caractéristique d'une substance | |
| DE4231777C2 (de) | Verfahren zur spektralen Analyse einer eine Flackerfrequenz aufweisenden technischen Flamme durch optische Emissions- oder Absorptionsspektroskopie und Anordnung zur Durchführung des Verfahrens | |
| WO2013010938A1 (fr) | Procédé d'activation d'une diode laser dans un spectromètre | |
| DE102014226845B4 (de) | Absorptionsspektrometer | |
| EP0197917A2 (fr) | Procédé pour la détermination périodique d'une grandeur mesurable et dispositif pour la mise en oeuvre du procédé | |
| DE10238356A1 (de) | Quantitative spektroskopische Bestimmung eines Absorbers |
Legal Events
| Date | Code | Title | Description |
|---|---|---|---|
| PUAI | Public reference made under article 153(3) epc to a published international application that has entered the european phase |
Free format text: ORIGINAL CODE: 0009012 |
|
| AK | Designated contracting states |
Kind code of ref document: A1 Designated state(s): AT BE CH DE DK ES FR GB IT LI NL PT SE |
|
| 17P | Request for examination filed |
Effective date: 19951017 |
|
| 17Q | First examination report despatched |
Effective date: 19971210 |
|
| GRAG | Despatch of communication of intention to grant |
Free format text: ORIGINAL CODE: EPIDOS AGRA |
|
| GRAG | Despatch of communication of intention to grant |
Free format text: ORIGINAL CODE: EPIDOS AGRA |
|
| GRAH | Despatch of communication of intention to grant a patent |
Free format text: ORIGINAL CODE: EPIDOS IGRA |
|
| GRAH | Despatch of communication of intention to grant a patent |
Free format text: ORIGINAL CODE: EPIDOS IGRA |
|
| GRAA | (expected) grant |
Free format text: ORIGINAL CODE: 0009210 |
|
| AK | Designated contracting states |
Kind code of ref document: B1 Designated state(s): AT BE CH DE DK ES FR GB IT LI NL PT SE |
|
| PG25 | Lapsed in a contracting state [announced via postgrant information from national office to epo] |
Ref country code: SE Free format text: THE PATENT HAS BEEN ANNULLED BY A DECISION OF A NATIONAL AUTHORITY Effective date: 19990414 Ref country code: NL Free format text: LAPSE BECAUSE OF FAILURE TO SUBMIT A TRANSLATION OF THE DESCRIPTION OR TO PAY THE FEE WITHIN THE PRESCRIBED TIME-LIMIT Effective date: 19990414 Ref country code: IT Free format text: LAPSE BECAUSE OF FAILURE TO SUBMIT A TRANSLATION OF THE DESCRIPTION OR TO PAY THE FEE WITHIN THE PRESCRIBED TIME-LIMIT;WARNING: LAPSES OF ITALIAN PATENTS WITH EFFECTIVE DATE BEFORE 2007 MAY HAVE OCCURRED AT ANY TIME BEFORE 2007. THE CORRECT EFFECTIVE DATE MAY BE DIFFERENT FROM THE ONE RECORDED. Effective date: 19990414 Ref country code: GB Free format text: LAPSE BECAUSE OF NON-PAYMENT OF DUE FEES Effective date: 19990414 Ref country code: FR Free format text: LAPSE BECAUSE OF FAILURE TO SUBMIT A TRANSLATION OF THE DESCRIPTION OR TO PAY THE FEE WITHIN THE PRESCRIBED TIME-LIMIT Effective date: 19990414 Ref country code: ES Free format text: THE PATENT HAS BEEN ANNULLED BY A DECISION OF A NATIONAL AUTHORITY Effective date: 19990414 |
|
| REF | Corresponds to: |
Ref document number: 178989 Country of ref document: AT Date of ref document: 19990415 Kind code of ref document: T |
|
| REG | Reference to a national code |
Ref country code: CH Ref legal event code: NV Representative=s name: R. A. EGLI & CO. PATENTANWAELTE Ref country code: CH Ref legal event code: EP |
|
| REF | Corresponds to: |
Ref document number: 59309518 Country of ref document: DE Date of ref document: 19990520 |
|
| PG25 | Lapsed in a contracting state [announced via postgrant information from national office to epo] |
Ref country code: PT Free format text: LAPSE BECAUSE OF FAILURE TO SUBMIT A TRANSLATION OF THE DESCRIPTION OR TO PAY THE FEE WITHIN THE PRESCRIBED TIME-LIMIT Effective date: 19990714 Ref country code: DK Free format text: LAPSE BECAUSE OF FAILURE TO SUBMIT A TRANSLATION OF THE DESCRIPTION OR TO PAY THE FEE WITHIN THE PRESCRIBED TIME-LIMIT Effective date: 19990714 |
|
| NLV1 | Nl: lapsed or annulled due to failure to fulfill the requirements of art. 29p and 29m of the patents act | ||
| EN | Fr: translation not filed | ||
| GBV | Gb: ep patent (uk) treated as always having been void in accordance with gb section 77(7)/1977 [no translation filed] |
Effective date: 19990414 |
|
| PG25 | Lapsed in a contracting state [announced via postgrant information from national office to epo] |
Ref country code: AT Free format text: LAPSE BECAUSE OF NON-PAYMENT OF DUE FEES Effective date: 19991210 |
|
| PG25 | Lapsed in a contracting state [announced via postgrant information from national office to epo] |
Ref country code: LI Free format text: LAPSE BECAUSE OF NON-PAYMENT OF DUE FEES Effective date: 19991231 Ref country code: CH Free format text: LAPSE BECAUSE OF NON-PAYMENT OF DUE FEES Effective date: 19991231 Ref country code: BE Free format text: LAPSE BECAUSE OF NON-PAYMENT OF DUE FEES Effective date: 19991231 |
|
| PLBE | No opposition filed within time limit |
Free format text: ORIGINAL CODE: 0009261 |
|
| STAA | Information on the status of an ep patent application or granted ep patent |
Free format text: STATUS: NO OPPOSITION FILED WITHIN TIME LIMIT |
|
| 26N | No opposition filed | ||
| BERE | Be: lapsed |
Owner name: RIENER KARL STEFAN Effective date: 19991231 |
|
| PGFP | Annual fee paid to national office [announced via postgrant information from national office to epo] |
Ref country code: DE Payment date: 20071231 Year of fee payment: 15 |
|
| PG25 | Lapsed in a contracting state [announced via postgrant information from national office to epo] |
Ref country code: DE Free format text: LAPSE BECAUSE OF NON-PAYMENT OF DUE FEES Effective date: 20090701 |