EP0672249B1 - Utilisation de l'electrophorese capillaire pour quantifier la concentration de composants proteiques et la teneur en proteine dans les fluides - Google Patents
Utilisation de l'electrophorese capillaire pour quantifier la concentration de composants proteiques et la teneur en proteine dans les fluides Download PDFInfo
- Publication number
- EP0672249B1 EP0672249B1 EP94929210A EP94929210A EP0672249B1 EP 0672249 B1 EP0672249 B1 EP 0672249B1 EP 94929210 A EP94929210 A EP 94929210A EP 94929210 A EP94929210 A EP 94929210A EP 0672249 B1 EP0672249 B1 EP 0672249B1
- Authority
- EP
- European Patent Office
- Prior art keywords
- protein
- internal standard
- concentration
- sample
- signal
- Prior art date
- Legal status (The legal status is an assumption and is not a legal conclusion. Google has not performed a legal analysis and makes no representation as to the accuracy of the status listed.)
- Expired - Lifetime
Links
- 102000004169 proteins and genes Human genes 0.000 title claims abstract description 206
- 108090000623 proteins and genes Proteins 0.000 title claims abstract description 206
- 238000005251 capillar electrophoresis Methods 0.000 title claims abstract description 49
- 235000018102 proteins Nutrition 0.000 title description 175
- 239000012530 fluid Substances 0.000 title description 6
- 235000004252 protein component Nutrition 0.000 title description 4
- 238000000034 method Methods 0.000 claims abstract description 94
- 102000009027 Albumins Human genes 0.000 claims abstract description 51
- 108010088751 Albumins Proteins 0.000 claims abstract description 51
- 150000001875 compounds Chemical class 0.000 claims abstract description 51
- 238000000926 separation method Methods 0.000 claims abstract description 26
- ATCRIUVQKHMXSH-UHFFFAOYSA-N 2,4-dichlorobenzoic acid Chemical compound OC(=O)C1=CC=C(Cl)C=C1Cl ATCRIUVQKHMXSH-UHFFFAOYSA-N 0.000 claims abstract description 22
- 238000002835 absorbance Methods 0.000 claims description 18
- 102000007584 Prealbumin Human genes 0.000 claims description 16
- 108010071690 Prealbumin Proteins 0.000 claims description 16
- ALLSOOQIDPLIER-UHFFFAOYSA-N 2,3,4-trichlorobenzoic acid Chemical compound OC(=O)C1=CC=C(Cl)C(Cl)=C1Cl ALLSOOQIDPLIER-UHFFFAOYSA-N 0.000 claims description 9
- -1 α1-fetoprotein Proteins 0.000 claims description 9
- QAOJBHRZQQDFHA-UHFFFAOYSA-N 2,3-dichlorobenzoic acid Chemical compound OC(=O)C1=CC=CC(Cl)=C1Cl QAOJBHRZQQDFHA-UHFFFAOYSA-N 0.000 claims description 8
- RAFFVQBMVYYTQS-UHFFFAOYSA-N 2,4,6-trichlorobenzoic acid Chemical compound OC(=O)C1=C(Cl)C=C(Cl)C=C1Cl RAFFVQBMVYYTQS-UHFFFAOYSA-N 0.000 claims description 6
- 238000001228 spectrum Methods 0.000 claims description 6
- 239000002253 acid Substances 0.000 claims description 5
- 230000031700 light absorption Effects 0.000 claims description 5
- 108010074051 C-Reactive Protein Proteins 0.000 claims description 4
- 102100032752 C-reactive protein Human genes 0.000 claims description 4
- 108010022366 Carcinoembryonic Antigen Proteins 0.000 claims description 4
- 102000003886 Glycoproteins Human genes 0.000 claims description 4
- 108090000288 Glycoproteins Proteins 0.000 claims description 4
- 239000002753 trypsin inhibitor Substances 0.000 claims description 4
- 108010075016 Ceruloplasmin Proteins 0.000 claims description 3
- 102100023321 Ceruloplasmin Human genes 0.000 claims description 3
- 102000008857 Ferritin Human genes 0.000 claims description 3
- 108050000784 Ferritin Proteins 0.000 claims description 3
- 238000008416 Ferritin Methods 0.000 claims description 3
- 102000014702 Haptoglobin Human genes 0.000 claims description 3
- 108050005077 Haptoglobin Proteins 0.000 claims description 3
- 102000005717 Myeloma Proteins Human genes 0.000 claims description 3
- 108010045503 Myeloma Proteins Proteins 0.000 claims description 3
- 102000004338 Transferrin Human genes 0.000 claims description 3
- 108090000901 Transferrin Proteins 0.000 claims description 3
- 102000029752 retinol binding Human genes 0.000 claims description 3
- 108091000053 retinol binding Proteins 0.000 claims description 3
- 239000012581 transferrin Substances 0.000 claims description 3
- 102000012406 Carcinoembryonic Antigen Human genes 0.000 claims 1
- 239000003550 marker Substances 0.000 abstract description 6
- 238000005259 measurement Methods 0.000 abstract description 4
- WPYMKLBDIGXBTP-UHFFFAOYSA-N Benzoic acid Natural products OC(=O)C1=CC=CC=C1 WPYMKLBDIGXBTP-UHFFFAOYSA-N 0.000 abstract description 3
- 239000005711 Benzoic acid Substances 0.000 abstract description 2
- 235000010233 benzoic acid Nutrition 0.000 abstract description 2
- 150000001558 benzoic acid derivatives Chemical group 0.000 abstract 1
- 229910052736 halogen Inorganic materials 0.000 abstract 1
- 150000002367 halogens Chemical class 0.000 abstract 1
- 239000000523 sample Substances 0.000 description 80
- 239000000243 solution Substances 0.000 description 31
- 238000001962 electrophoresis Methods 0.000 description 29
- 238000010521 absorption reaction Methods 0.000 description 28
- ZMXDDKWLCZADIW-UHFFFAOYSA-N N,N-Dimethylformamide Chemical compound CN(C)C=O ZMXDDKWLCZADIW-UHFFFAOYSA-N 0.000 description 27
- 210000002966 serum Anatomy 0.000 description 26
- 230000009102 absorption Effects 0.000 description 22
- 210000002700 urine Anatomy 0.000 description 19
- 238000001514 detection method Methods 0.000 description 16
- 241000894007 species Species 0.000 description 16
- 102000008100 Human Serum Albumin Human genes 0.000 description 15
- 108091006905 Human Serum Albumin Proteins 0.000 description 15
- 230000008033 biological extinction Effects 0.000 description 11
- 238000013508 migration Methods 0.000 description 10
- 239000000203 mixture Substances 0.000 description 10
- 230000005012 migration Effects 0.000 description 9
- 239000003085 diluting agent Substances 0.000 description 8
- 102000039446 nucleic acids Human genes 0.000 description 8
- 108020004707 nucleic acids Proteins 0.000 description 8
- 150000007523 nucleic acids Chemical class 0.000 description 8
- 239000012472 biological sample Substances 0.000 description 7
- 239000000470 constituent Substances 0.000 description 7
- 238000005370 electroosmosis Methods 0.000 description 7
- 230000005855 radiation Effects 0.000 description 7
- VYPSYNLAJGMNEJ-UHFFFAOYSA-N Silicium dioxide Chemical compound O=[Si]=O VYPSYNLAJGMNEJ-UHFFFAOYSA-N 0.000 description 6
- HEMHJVSKTPXQMS-UHFFFAOYSA-M Sodium hydroxide Chemical compound [OH-].[Na+] HEMHJVSKTPXQMS-UHFFFAOYSA-M 0.000 description 6
- 239000000872 buffer Substances 0.000 description 6
- 238000005515 capillary zone electrophoresis Methods 0.000 description 6
- 238000004458 analytical method Methods 0.000 description 5
- 206010012601 diabetes mellitus Diseases 0.000 description 5
- 238000002474 experimental method Methods 0.000 description 5
- 229940027941 immunoglobulin g Drugs 0.000 description 5
- 238000002347 injection Methods 0.000 description 5
- 239000007924 injection Substances 0.000 description 5
- 238000012417 linear regression Methods 0.000 description 5
- 239000011550 stock solution Substances 0.000 description 5
- 102000007562 Serum Albumin Human genes 0.000 description 4
- 108010071390 Serum Albumin Proteins 0.000 description 4
- FAPWRFPIFSIZLT-UHFFFAOYSA-M Sodium chloride Chemical compound [Na+].[Cl-] FAPWRFPIFSIZLT-UHFFFAOYSA-M 0.000 description 4
- 229940024606 amino acid Drugs 0.000 description 4
- 150000001413 amino acids Chemical class 0.000 description 4
- 238000003556 assay Methods 0.000 description 4
- 210000004369 blood Anatomy 0.000 description 4
- 239000008280 blood Substances 0.000 description 4
- KGBXLFKZBHKPEV-UHFFFAOYSA-N boric acid Chemical compound OB(O)O KGBXLFKZBHKPEV-UHFFFAOYSA-N 0.000 description 4
- 239000004327 boric acid Substances 0.000 description 4
- 210000004027 cell Anatomy 0.000 description 4
- 239000005350 fused silica glass Substances 0.000 description 4
- 229920002521 macromolecule Polymers 0.000 description 4
- 239000012146 running buffer Substances 0.000 description 4
- LWIHDJKSTIGBAC-UHFFFAOYSA-K tripotassium phosphate Chemical compound [K+].[K+].[K+].[O-]P([O-])([O-])=O LWIHDJKSTIGBAC-UHFFFAOYSA-K 0.000 description 4
- 102100025475 Carcinoembryonic antigen-related cell adhesion molecule 5 Human genes 0.000 description 3
- 206010061218 Inflammation Diseases 0.000 description 3
- 238000011481 absorbance measurement Methods 0.000 description 3
- 239000007853 buffer solution Substances 0.000 description 3
- 210000001175 cerebrospinal fluid Anatomy 0.000 description 3
- 230000000694 effects Effects 0.000 description 3
- 230000004054 inflammatory process Effects 0.000 description 3
- 230000003287 optical effect Effects 0.000 description 3
- 108090000765 processed proteins & peptides Proteins 0.000 description 3
- 238000011084 recovery Methods 0.000 description 3
- 239000012086 standard solution Substances 0.000 description 3
- XLYOFNOQVPJJNP-UHFFFAOYSA-N water Substances O XLYOFNOQVPJJNP-UHFFFAOYSA-N 0.000 description 3
- IJGRMHOSHXDMSA-UHFFFAOYSA-N Atomic nitrogen Chemical compound N#N IJGRMHOSHXDMSA-UHFFFAOYSA-N 0.000 description 2
- YZCKVEUIGOORGS-OUBTZVSYSA-N Deuterium Chemical compound [2H] YZCKVEUIGOORGS-OUBTZVSYSA-N 0.000 description 2
- COLNVLDHVKWLRT-QMMMGPOBSA-N L-phenylalanine Chemical compound OC(=O)[C@@H](N)CC1=CC=CC=C1 COLNVLDHVKWLRT-QMMMGPOBSA-N 0.000 description 2
- QIVBCDIJIAJPQS-VIFPVBQESA-N L-tryptophane Chemical compound C1=CC=C2C(C[C@H](N)C(O)=O)=CNC2=C1 QIVBCDIJIAJPQS-VIFPVBQESA-N 0.000 description 2
- OUYCCCASQSFEME-QMMMGPOBSA-N L-tyrosine Chemical compound OC(=O)[C@@H](N)CC1=CC=C(O)C=C1 OUYCCCASQSFEME-QMMMGPOBSA-N 0.000 description 2
- 239000004642 Polyimide Substances 0.000 description 2
- QIVBCDIJIAJPQS-UHFFFAOYSA-N Tryptophan Natural products C1=CC=C2C(CC(N)C(O)=O)=CNC2=C1 QIVBCDIJIAJPQS-UHFFFAOYSA-N 0.000 description 2
- ISAKRJDGNUQOIC-UHFFFAOYSA-N Uracil Chemical compound O=C1C=CNC(=O)N1 ISAKRJDGNUQOIC-UHFFFAOYSA-N 0.000 description 2
- 125000000539 amino acid group Chemical group 0.000 description 2
- 150000001491 aromatic compounds Chemical class 0.000 description 2
- 230000008901 benefit Effects 0.000 description 2
- 239000013060 biological fluid Substances 0.000 description 2
- 238000006243 chemical reaction Methods 0.000 description 2
- 239000003153 chemical reaction reagent Substances 0.000 description 2
- 238000011109 contamination Methods 0.000 description 2
- OPTASPLRGRRNAP-UHFFFAOYSA-N cytosine Chemical compound NC=1C=CNC(=O)N=1 OPTASPLRGRRNAP-UHFFFAOYSA-N 0.000 description 2
- 239000008367 deionised water Substances 0.000 description 2
- 229910021641 deionized water Inorganic materials 0.000 description 2
- 230000001419 dependent effect Effects 0.000 description 2
- 229910052805 deuterium Inorganic materials 0.000 description 2
- 238000010790 dilution Methods 0.000 description 2
- 239000012895 dilution Substances 0.000 description 2
- 208000037265 diseases, disorders, signs and symptoms Diseases 0.000 description 2
- 238000003487 electrochemical reaction Methods 0.000 description 2
- 238000005516 engineering process Methods 0.000 description 2
- 230000007613 environmental effect Effects 0.000 description 2
- 238000000605 extraction Methods 0.000 description 2
- 238000002523 gelfiltration Methods 0.000 description 2
- 239000011521 glass Substances 0.000 description 2
- UYTPUPDQBNUYGX-UHFFFAOYSA-N guanine Chemical compound O=C1NC(N)=NC2=C1N=CN2 UYTPUPDQBNUYGX-UHFFFAOYSA-N 0.000 description 2
- 150000002391 heterocyclic compounds Chemical class 0.000 description 2
- 229940098197 human immunoglobulin g Drugs 0.000 description 2
- 230000002452 interceptive effect Effects 0.000 description 2
- 230000033001 locomotion Effects 0.000 description 2
- 239000012528 membrane Substances 0.000 description 2
- 229910052751 metal Inorganic materials 0.000 description 2
- 239000002184 metal Substances 0.000 description 2
- 238000012544 monitoring process Methods 0.000 description 2
- 150000002894 organic compounds Chemical class 0.000 description 2
- COLNVLDHVKWLRT-UHFFFAOYSA-N phenylalanine Natural products OC(=O)C(N)CC1=CC=CC=C1 COLNVLDHVKWLRT-UHFFFAOYSA-N 0.000 description 2
- 210000002381 plasma Anatomy 0.000 description 2
- 229920001721 polyimide Polymers 0.000 description 2
- 229910000160 potassium phosphate Inorganic materials 0.000 description 2
- 235000011009 potassium phosphates Nutrition 0.000 description 2
- 238000002331 protein detection Methods 0.000 description 2
- 238000004451 qualitative analysis Methods 0.000 description 2
- 230000035945 sensitivity Effects 0.000 description 2
- 150000003384 small molecules Chemical class 0.000 description 2
- 239000011780 sodium chloride Substances 0.000 description 2
- 239000007787 solid Substances 0.000 description 2
- 230000003595 spectral effect Effects 0.000 description 2
- 239000000126 substance Substances 0.000 description 2
- 238000012360 testing method Methods 0.000 description 2
- RWQNBRDOKXIBIV-UHFFFAOYSA-N thymine Chemical compound CC1=CNC(=O)NC1=O RWQNBRDOKXIBIV-UHFFFAOYSA-N 0.000 description 2
- OUYCCCASQSFEME-UHFFFAOYSA-N tyrosine Natural products OC(=O)C(N)CC1=CC=C(O)C=C1 OUYCCCASQSFEME-UHFFFAOYSA-N 0.000 description 2
- 239000002699 waste material Substances 0.000 description 2
- GFFGJBXGBJISGV-UHFFFAOYSA-N Adenine Chemical compound NC1=NC=NC2=C1N=CN2 GFFGJBXGBJISGV-UHFFFAOYSA-N 0.000 description 1
- 229930024421 Adenine Natural products 0.000 description 1
- 240000005611 Agrostis gigantea Species 0.000 description 1
- 102000004506 Blood Proteins Human genes 0.000 description 1
- 108010017384 Blood Proteins Proteins 0.000 description 1
- FRPHFZCDPYBUAU-UHFFFAOYSA-N Bromocresolgreen Chemical compound CC1=C(Br)C(O)=C(Br)C=C1C1(C=2C(=C(Br)C(O)=C(Br)C=2)C)C2=CC=CC=C2S(=O)(=O)O1 FRPHFZCDPYBUAU-UHFFFAOYSA-N 0.000 description 1
- CKLJMWTZIZZHCS-REOHCLBHSA-N L-aspartic acid Chemical compound OC(=O)[C@@H](N)CC(O)=O CKLJMWTZIZZHCS-REOHCLBHSA-N 0.000 description 1
- WHUUTDBJXJRKMK-VKHMYHEASA-N L-glutamic acid Chemical compound OC(=O)[C@@H](N)CCC(O)=O WHUUTDBJXJRKMK-VKHMYHEASA-N 0.000 description 1
- 208000004155 Malabsorption Syndromes Diseases 0.000 description 1
- 208000002720 Malnutrition Diseases 0.000 description 1
- 206010029164 Nephrotic syndrome Diseases 0.000 description 1
- 241000233805 Phoenix Species 0.000 description 1
- 206010036790 Productive cough Diseases 0.000 description 1
- 238000000862 absorption spectrum Methods 0.000 description 1
- 230000001154 acute effect Effects 0.000 description 1
- 229960000643 adenine Drugs 0.000 description 1
- 229940009098 aspartate Drugs 0.000 description 1
- 235000013405 beer Nutrition 0.000 description 1
- OHJMTUPIZMNBFR-UHFFFAOYSA-N biuret Chemical compound NC(=O)NC(N)=O OHJMTUPIZMNBFR-UHFFFAOYSA-N 0.000 description 1
- 230000015556 catabolic process Effects 0.000 description 1
- 150000001768 cations Chemical class 0.000 description 1
- 210000003756 cervix mucus Anatomy 0.000 description 1
- 230000001684 chronic effect Effects 0.000 description 1
- 238000002983 circular dichroism Methods 0.000 description 1
- 238000004737 colorimetric analysis Methods 0.000 description 1
- 238000010276 construction Methods 0.000 description 1
- 229940104302 cytosine Drugs 0.000 description 1
- 238000007405 data analysis Methods 0.000 description 1
- 238000011161 development Methods 0.000 description 1
- 238000003745 diagnosis Methods 0.000 description 1
- 201000010099 disease Diseases 0.000 description 1
- 208000035475 disorder Diseases 0.000 description 1
- 238000003370 dye binding method Methods 0.000 description 1
- 230000002496 gastric effect Effects 0.000 description 1
- 238000001502 gel electrophoresis Methods 0.000 description 1
- 229930195712 glutamate Natural products 0.000 description 1
- 150000004676 glycans Chemical class 0.000 description 1
- PCHJSUWPFVWCPO-UHFFFAOYSA-N gold Chemical compound [Au] PCHJSUWPFVWCPO-UHFFFAOYSA-N 0.000 description 1
- 239000010931 gold Substances 0.000 description 1
- 229910052737 gold Inorganic materials 0.000 description 1
- 150000003278 haem Chemical class 0.000 description 1
- 125000000623 heterocyclic group Chemical group 0.000 description 1
- 238000004128 high performance liquid chromatography Methods 0.000 description 1
- 230000008105 immune reaction Effects 0.000 description 1
- 230000004968 inflammatory condition Effects 0.000 description 1
- 230000010354 integration Effects 0.000 description 1
- 230000003993 interaction Effects 0.000 description 1
- 150000002500 ions Chemical class 0.000 description 1
- 208000017169 kidney disease Diseases 0.000 description 1
- 201000006370 kidney failure Diseases 0.000 description 1
- 150000002605 large molecules Chemical class 0.000 description 1
- 150000002632 lipids Chemical class 0.000 description 1
- 210000002751 lymph Anatomy 0.000 description 1
- 238000012423 maintenance Methods 0.000 description 1
- 230000003211 malignant effect Effects 0.000 description 1
- 235000000824 malnutrition Nutrition 0.000 description 1
- 230000001071 malnutrition Effects 0.000 description 1
- 230000000873 masking effect Effects 0.000 description 1
- 230000000813 microbial effect Effects 0.000 description 1
- 238000012986 modification Methods 0.000 description 1
- 230000004048 modification Effects 0.000 description 1
- 229910052757 nitrogen Inorganic materials 0.000 description 1
- 239000002773 nucleotide Substances 0.000 description 1
- 125000003729 nucleotide group Chemical group 0.000 description 1
- 208000015380 nutritional deficiency disease Diseases 0.000 description 1
- 238000000853 optical rotatory dispersion Methods 0.000 description 1
- 238000002264 polyacrylamide gel electrophoresis Methods 0.000 description 1
- 229920001282 polysaccharide Polymers 0.000 description 1
- 239000005017 polysaccharide Substances 0.000 description 1
- 238000002360 preparation method Methods 0.000 description 1
- 230000008569 process Effects 0.000 description 1
- 102000004196 processed proteins & peptides Human genes 0.000 description 1
- 238000002731 protein assay Methods 0.000 description 1
- 238000000159 protein binding assay Methods 0.000 description 1
- 230000022558 protein metabolic process Effects 0.000 description 1
- 230000002685 pulmonary effect Effects 0.000 description 1
- 238000000746 purification Methods 0.000 description 1
- 239000010453 quartz Substances 0.000 description 1
- 238000000611 regression analysis Methods 0.000 description 1
- 238000011160 research Methods 0.000 description 1
- 210000000582 semen Anatomy 0.000 description 1
- 238000013207 serial dilution Methods 0.000 description 1
- 125000005372 silanol group Chemical group 0.000 description 1
- 239000011343 solid material Substances 0.000 description 1
- 239000002904 solvent Substances 0.000 description 1
- 210000003802 sputum Anatomy 0.000 description 1
- 208000024794 sputum Diseases 0.000 description 1
- 210000001138 tear Anatomy 0.000 description 1
- 229940113082 thymine Drugs 0.000 description 1
- 230000000451 tissue damage Effects 0.000 description 1
- 231100000827 tissue damage Toxicity 0.000 description 1
- 238000000539 two dimensional gel electrophoresis Methods 0.000 description 1
- 238000002211 ultraviolet spectrum Methods 0.000 description 1
- 229940035893 uracil Drugs 0.000 description 1
- 238000005303 weighing Methods 0.000 description 1
Images

Classifications
-
- G—PHYSICS
- G01—MEASURING; TESTING
- G01N—INVESTIGATING OR ANALYSING MATERIALS BY DETERMINING THEIR CHEMICAL OR PHYSICAL PROPERTIES
- G01N27/00—Investigating or analysing materials by the use of electric, electrochemical, or magnetic means
- G01N27/26—Investigating or analysing materials by the use of electric, electrochemical, or magnetic means by investigating electrochemical variables; by using electrolysis or electrophoresis
- G01N27/416—Systems
- G01N27/447—Systems using electrophoresis
- G01N27/44704—Details; Accessories
- G01N27/44717—Arrangements for investigating the separated zones, e.g. localising zones
- G01N27/44721—Arrangements for investigating the separated zones, e.g. localising zones by optical means
- G01N27/44726—Arrangements for investigating the separated zones, e.g. localising zones by optical means using specific dyes, markers or binding molecules
-
- G—PHYSICS
- G01—MEASURING; TESTING
- G01N—INVESTIGATING OR ANALYSING MATERIALS BY DETERMINING THEIR CHEMICAL OR PHYSICAL PROPERTIES
- G01N27/00—Investigating or analysing materials by the use of electric, electrochemical, or magnetic means
- G01N27/26—Investigating or analysing materials by the use of electric, electrochemical, or magnetic means by investigating electrochemical variables; by using electrolysis or electrophoresis
- G01N27/416—Systems
- G01N27/447—Systems using electrophoresis
- G01N27/44704—Details; Accessories
- G01N27/44743—Introducing samples
Definitions
- This invention relates to a method for determining a protein component in a fluid and/or determining the total protein concentration in the fluid.
- a single marker protein such as serum albumin
- a biological fluid such as serum, urine, or cerebrospinal fluid
- human serum albumin is frequently assayed in biological samples for any one of a number of reasons.
- the concentration of this protein can be used to detect protein catabolism as the result of tissue damage or inflammation, the reduced absorption of amino acids caused by malabsorption syndromes or malnutrition, protein loss due to kidney disorders such as nephrotic syndrome or chronic glomuleronephritis, or other conditions affecting protein metabolism and balance.
- One condition in which human serum albumin occurs at low concentrations in urine is diabetes mellitus.
- proteins found in serum such as ⁇ 1 -antitrypsin, ⁇ 1 -acid glycoprotein, and C-reactive protein, are all markers of inflammation, particularly in the acute phase. Still other proteins, such as ⁇ 1 -fetoprotein and carcinoembryonic antigen, are also frequently monitored as potential markers of malignant disorder.
- proteins are frequently assayed as markers for particular disease states or inflammatory conditions.
- the method can handle a wide range of biological samples as well as non-biological samples, including urine, cerebral spinal fluid, tears, seminal fluid or vaginal fluid, and environmental waste samples.
- Quantitation of samples using capillary electrophoresis is described in EP-A-0 517 370. Particularly a method of quantifying peptide-containing constituent species in a sample by capillary zone electrophoresis is described.
- the method uses an ionic species as internal standard, which is chosen on the basis of its charge density.
- the charge density is defined as the number of negative charges of an ionic species divided by its molecular weight.
- the internal standard ionic species will pass the on-line detector and appear as a peak on the resultant electropherogram after most if not all, of the sample constituents (have passed).
- Each such sample constituent is then quantified based on information known about the ionic species, and the size of the electropherogram peak of the ionic species relative to the size of the electropherogram peaks of each sample constituent.
- a most preferred ionic species amongst a list of some 18 examples of such species for the purpose described therein, is benzoic acid.
- the method can be used both to determine the concentration of a single protein in a sample and to determine total protein concentration in the sample.
- the method of determining the concentration of a single protein in a sample comprises:
- the detector signal is a signal produced by absorption of light in the ultraviolet and/or visible regions of the spectrum.
- the protein to be determined can be a protein such as human serum albumin, a myeloma protein, prealbumin, retinol-binding protein, ⁇ 1 -antitrypsin, ⁇ 1 -acid glycoprotein, ⁇ 1 -fetoprotein, haptoglobin, ⁇ 2 -macroglobulin, ceruloplasmin, transferrin, ⁇ 2 -microglobulin, C-reactive protein, ferritin, or carcinoembryonic antigen.
- a typical protein to be determined is human serum albumin.
- the internal standard compound is a dichlorobenzoic acid, or a trichlorobenzoic acid. More preferably, the internal standard compound is a dichlorobenzoic acid. A highly preferred internal standard compound is 2,4-dichlorobenzoic acid. Alternatively, the internal standard compound can be a trichlorobenzoic acid, in which case a highly preferred internal standard is 2,4,6-trichlorobenzoic acid.
- the wavelength at which the absorbance of the separated marker protein and the internal standard compound is measured is 214 nm.
- the method for determining the total protein concentration in a sample containing at least one protein comprises the steps of:
- the internal standard compound is chosen as described above for the method in which the concentration of a particular protein is determined.
- a number of detectable signals produced by proteins can be used for their detection subsequent to capillary electrophoresis. These signals include, but are not necessarily limited to, those resulting from absorption of light in the ultraviolet or visible portions of the spectrum, those resulting from fluorescence and/or chemiluminescence, those resulting from refractive index changes, and those resulting from optical rotation such as circular dichroism and optical rotatory dispersion. Typically, absorption of light in the ultraviolet or visible portions of the spectrum is used. Other types of signals, such as those resulting from electrochemical reactions, can also be used.
- the concentration of any solute can be determined if the extinction coefficient is known at a particular wavelength, as long as the pathlength is also known.
- the thickness of the cell is known from the construction of the cell.
- the total protein concentration in the sample can be determined by integrating the signal obtained from each separated species and then using the total integrated signal obtained from the integration to extrapolate total protein concentration from the standard curve. This yields the total protein concentration in the sample.
- proteins can be detected by their ultraviolet absorption at a range of wavelengths centered around 280 nm. Absorption in this range of wavelengths is predominantly due to aromatic amino acid residues, particularly tyrosine and tryptophan, and, to a lesser extent, phenylalanine. Accordingly, absorption in this range of wavelengths varies with the amino acid composition of the protein. It also varies with the secondary, tertiary, and quaternary structure of the protein because absorption at this range of wavelengths depends to a substantial degree on the interaction of the residues involved with the solvent. Although it is generally preferred to work at 214 nm, in some cases, it can be desirable to work at longer wavelengths.
- Nucleic acids have strong ultraviolet absorptions in the range of 260 nm. This absorption is due to the heterocyclic rings in the nucleotide bases adenine, cytosine, guanine, and thymine (or uracil for RNA). For nucleic acids, the various bases have different absorption maxima and absorption intensity, so the molar absorption intensity varies to a certain extent with base composition. The absorption also varies with the secondary structure of the nucleic acid. Doublestranded nucleic acids such as native DNA have approximately a 30% lower ultraviolet absorption per mole of bases than do single-stranded nucleic acids. This effect is known as hypochromism. However, if the composition and strandedness of the nucleic acid are known, its concentration can be readily determined from the intensity of ultraviolet absorption.
- prosthetic groups particularly metal-containing prosthetic groups such as heme derivatives, absorb at a number of wavelengths, particularly at somewhat longer wavelengths.
- proteins or polysaccharides bound to components containing such prosthetic groups are detectable by ultraviolet or visible absorption as well.
- the wavelength involved will depend on the particular metal involved, the structure of the prosthetic group, and its relationship to the rest of the molecule.
- One preferred method of separating macromolecules, including proteins, is capillary electrophoresis.
- Capillary zone electrophoresis or capillary electrophoresis, is a technique that employs narrow-bore (10-200 ⁇ m inside diameter) capillaries to perform high efficiency separations of both large and small molecules. This separation is facilitated by the use of high voltages, typically 1000 to 30,000 volts, which can generate electroendoosmotic and electrophoretic flow of buffer solutions and ionic species, respectively, within the capillary.
- the properties of the separation and the ensuing electropherogram have characteristics resembling a cross between traditional polyacrylamide gel electrophoresis (PAGE) and modern high performance liquid chromatography (HPLC).
- the force for moving fluid between the sample input and the sample output of the capillary tube is provided by establishing an appropriate voltage between the sample input and the sample output, generating electrophoretic and electroendoosmotic forces as discussed above.
- Electroosmosis is a consequence of the surface charge on the wall of the capillary.
- the fused silica capillaries that are typically used for separations have ionizable silanol groups in contact with the buffer contained within the capillary.
- the pI of fused silica is about 1.5.
- the degree of ionization is controlled mainly by the pH of the buffer. Most buffers in which the pH is greater than 1.5 can ionize the capillary wall.
- the negatively-charged wall attracts positively charged ions from the buffer, creating an electrical double layer. When a voltage is applied across the capillary, cations in the diffuse portion of the double layer migrate in the direction of the cathode carrying water with them.
- electroosmotic flow of buffer solution in the direction of the negative electrode.
- the negatively charged analytes such as proteins, peptides, or other species
- electrophoretic migration can move against the EOF by electrophoretic migration towards the positive electrodes.
- electrophoretic migration of the analytes towards the positive electrode anode
- EOF overwhelms the electrophoretic migration of the analytes, and the analytes migrate toward the negative electrode (cathode).
- Electrophoretic migration is dependent upon the charge-mass ratio of each molecule, e.g., protein, to be separated. Each molecule possesses a specific charge-mass ratio depending upon its size and amino acid composition and thus migrates with a different speed.
- the detection window is arranged in relationship to the point at which the sample enters the electrophoretic field so that the sample is carried to the detection window by EOF. Accordingly, the faster the movement against EOF, the slower a particular protein passes the detection window.
- This is analogous to a group of very lazy rowboaters who are rowing against the current but are carried downstream faster than they can row. An observer at a point some distance downstream would first be reached by the rower who is rowing the slowest, because his net motion would be the closest to that of the current. The rower who was rowing the most vigorously would in fact arrive last at the observer.
- capillary electrophoresis can be performed in any apparatus in which the suitable electrophoretic forces can be generated and in which the peaks resulting can be detected.
- the capillary electrophoresis system involves a quartz or fused silica capillary tube of circular cross-section and cylindrical outline, equipped with an ultraviolet emitter and monochromator to select the desired wavelength, as well as a photodetector to detect the ultraviolet light that has passed through the sample.
- Typical dimensions of the capillary tube are 25 ⁇ m inner diameter x 27 cm total length.
- a suitable capillary tube is that produced by Polymicro Technologies, Phoenix, Arizona.
- the outer surface of the capillary can be coated with polyimide to protect the capillary from breakage.
- the optics module and detector can include a UV light source (deuterium lamp) and a 214 nanometer filter in a rotating wheel, as well as a detector that aligns with the aperture of the window.
- the window can be located at 6.5 cm from the tube outlet.
- a suitable apparatus for detection of proteins based on ultraviolet absorbance at 214 nm is the Beckman Instruments P/ACE 2000 CE system (Beckman Instruments, Fullerton, CA). This system is computer-controlled and can be used with suitable software, such as the CCE software, and an IBM-compatible personal computer such as an IBM PS/2. Other suitable capillary electrophoresis apparatus can also be used.
- the electrophoresis system could operate at many different wavelengths. Signals at multiple discrete wavelengths can be applied to one or more detection paths applied to the tube. Such ranges of wavelengths can be limited or extensive in the electromagnetic (optical) spectrum, as long as the masking constituting the window widths suitably excludes the signal at the selected wavelengths from passing through undesirable sections of the tube wall.
- electrophoresis system used for the methods of the present invention has been described with reference to a single capillary electrophoresis unit, it is clear that multiple systems can be used in series or tandem to provide for a continuous monitoring process, such as a time series of protein concentration in a sample. This may be useful when monitoring the development of clinical conditions such as inflammation or immunological reaction.
- a method for determining the concentration of a protein constituent in a sample according to the present invention can comprise the steps of:
- the detector signal is an electromagnetic radiative signal.
- the electromagnetic radiative signal is one produced by absorption of light in the ultraviolet and/or visible regions of the spectrum.
- other detectable electromagnetic radiative signals can be used, as well as other signals related to protein concentration such as those resulting from electrochemical reactions.
- any protein can be purified to substantial homogeneity and quantitated by procedures such as the biuret reaction, Kjeldahl nitrogen determination, the Lowry protein assay, or dye-binding assays, so that solutions of the protein of known concentration can be prepared.
- the protein to be detected can be any protein.
- the protein to be detected can be human serum albumin, a myeloma protein, prealbumin, retinol-binding protein, ⁇ 1 -antitrypsin, ⁇ 1 -acid glycoprotein, ⁇ 1 -fetoprotein, haptoglobin, ⁇ 2 -macroglobulin, ceruloplasmin, transferrin, ⁇ 2 -microglobulin, C-reactive protein, ferritin, or carcinoembryonic antigen.
- Other proteins can similarly be determined.
- a typical protein to be detected is human serum albumin.
- the dichlorobenzoic acid is 2,4-dichlorobenzoic acid.
- the trichlorobenzoic acid can be 2,4,6-trichlorobenzoic acid.
- one criterion for selecting an internal standard is the degree of separation between the internal standard and the protein components that results after capillary electrophoresis of samples containing the internal standard. This degree of separation can vary with the pH used for electrophoresis.
- the degree of separation between prealbumin and 2,4-dichlorobenzoic acid is greater than the degree of separation between prealbumin and 2,4,6-trichlorobenzoic acid at pH values greater than 10.3.
- electrophoresis is carried out at pH values greater than 10.3, the use of 2,4-dichlorobenzoic acid is preferred.
- the internal standard compound used is one that has significant absorption at that wavelength and is readily separable from any proteins in the sample.
- a marker compound could be an aromatic or heterocyclic compound with the desired absorption.
- Data for absorption for organic compounds is found, for example, in publications from the Sadtler Research Laboratories, as well as in the "Atlas of Spectral Data and Physical Constants for Organic Compounds", CRC Press, Cleveland, Ohio, and in “Organic Electronic Spectral Data", published by Interscience, New York. In general, most heterocyclic and aromatic compounds are readily separable from proteins because of their different charge/mass ratio.
- the quantity of the protein can be readily determined by integrating the area under the peak for the protein to be determined on the electropherogram, computing the ratio of the total electromagnetic radiative signal resulting from the peak with the signal for the internal standard, and determining the quantity of the protein from the standard curve.
- This method can be used for any protein-containing sample including both biological and non-biological fluids. It can be used, for example, for plasma, serum, cerebrospinal fluid, urine, lymph, seminal or vaginal secretions, sputum, products of gastric, bronchial, or pulmonary lavage, or other fluids encountered in clinical practice. Similarly, the method can be used on non-biological samples including environmental waste and other samples that may contain proteins as evidence of microbial growth or contamination.
- the present invention also encompasses a method of determining the total protein concentration in a sample.
- the method involves determining the total protein concentration in the sample by integrating the detector signal from each separated protein peak in the sample, and then using the total signal to determine the protein concentration.
- protein concentration also encompasses "protein content,” that is, the total mass of protein in the sample and not merely the mass per unit volume. If the volume of the sample is known, the protein content can be calculated simply by multiplying the protein concentration by the volume. In some cases, however, such as with originally solid or partially solid samples or samples produced by extraction of solid material, the volume of the sample may not be completely known and results are then reported in terms of protein content.
- the method comprises the steps of:
- the step of electrophoresis separates the internal standard compound from the proteins in the sample.
- the total protein concentration can be determined from the standard curve in the same way that the concentration of a single protein is determined, as described above.
- This method has an extremely wide dynamic range, and can be used to determine total protein concentration over broad ranges.
- the ultraviolet absorption of proteins at 280 nm is predominantly attributable to the aromatic amino acid residues, particularly tyrosine and tryptophan, as well as phenylalanine.
- the absorbance at 280 nm varies from protein to protein depending on the composition of the particular protein and the abundance of the UV-absorbing amino acid residues.
- the absorption of proteins at 214 nm is predominantly attributable to the peptide bond.
- the absorbance at this wavelength is nearly linearly dependent on the number of peptide bonds, which in turn is proportional to the mass of the protein regardless of the particular protein species involved or its composition.
- Another advantage of protein detection at 214 nm is that the absorptivity of the protein is usually greater at 214 nm than at 280 nm.
- albumin and human immunoglobulin G were measured at 214 nm.
- Albumin and immunoglobulin G solutions were made in ICS diluent (75 mM sodium chloride, 20 mM potassium phosphate, pH 7.0). Concentrations of the proteins were measured by ultraviolet absorbance at 280 nm using extinction coefficients of 0.58 and 1.38 for 1 mg/ml solutions of albumin and immunoglobulin G respectively.
- the absorbance value for albumin and immunoglobulin G at 214 nm was measured for a 1 mg/ml solution and was found to be 14.2 for albumin and 14.7 for immunoglobulin G.
- a series of albumin solutions was made, and the albumin concentration of each solution was determined spectrophotometrically based on an extinction coefficient of 0.58 for a 1 mg/ml solution at 280 nm using a 1 cm light path.
- a DCBA stock solution was made at such a concentration that a 1:1000 dilution would give an absorbance value of 1.59 at 280 nm.
- Each albumin solution (30 ⁇ l) was mixed with 270 ⁇ l of the diluted DCBA stock solution so that the final concentration of albumin in the stock solution ranged from 2 mg/ml to 8 mg/ml.
- a Beckman P/ACE 2000 CE system was used with Beckman CCE software, a modification of "System Gold", which was controlled by an IBM PS/2 PC. Electrophoreses were performed in a untreated fused silica capillary tube. The outer surface of the capillary was coated with polyimide to protect the capillary from breakage (Polymicro Technologies, Inc., Phoenix, AZ).
- the optics module and detector included a UV light source (deuterium lamp) and a 214 nanometer filter in a rotating wheel, as well as a detector that aligned with the aperture of the window. The window was located at 6.5 cm from the tube outlet.
- Running buffer was prepared as follows: 9.27 g of boric acid was weighed out and dissolved into 800 ml of deionized water. A pH meter was calibrated with two standard pH solutions at pH 7.0 and 10.0, and the boric acid solution was then adjusted to a pH of 10.2 with 1 N NaOH. The boric acid solution was then adjusted to a final volume of 1000 ml using volumetric apparatus and filtered through a 0.22 ⁇ m membrane (Corning, Corning, NY, Filter Catalog Number 25952) and stored at room temperature in a glass bottle.
- DCBA-containing sample diluent was prepared as follows: 100 mg of 2,4-dichlorobenzoic acid (Eastman Kodak, Rochester, NY) was dissolved in 200 ⁇ l of dimethylformamide (J.T. Baker, Phillipsburg, NJ). This solution was vortexed until the DCBA was completely dissolved. A 40- ⁇ l volume of the DCBA solution was then added into 100 ml of ICS diluent as described above. The DCBA-containing sample diluent was filtered through an 0.22 ⁇ l membrane and stored at room temperature in a glass bottle.
- the rinse solution A was 1 N NaOH.
- the rinse solution B was deionized water.
- the serum was collected from a blood sample as described above and diluted to a final total volume of 300 ⁇ l with one part of serum being diluted with 9 parts of DCBA-containing sample diluent.
- the vial was then placed on the sample tray of the electrophoresis apparatus.
- the parameters for electrophoresis was set as follows: The capillary was 27 ⁇ m x 20 cm. The wavelength for measurements was 214 nm. The temperature was 24°C. The injection mode was pressure injection for 10 seconds. The separation voltage was 10 kilovolts. The separation time was 7 minutes. The current was close to 20 ⁇ A.
- the operating sequence was set as follows: The column was rinsed with running buffer for 1.5 minutes. The column was equilibrated with running buffer for 0.5 minutes. Pressure injection was performed for ten seconds as indicated, and the separation was performed at 10 kilovolts voltage for 7 minutes. The column was then rinsed with rinse solution A for 1 minute, and then with rinse solution B for 1 minute.
- the CCE software was used to adjust the baseline, normalize the absorbance of the internal standard, and normalize migration time by two internal standards.
- the "delimit" integrator function was then used to calculate the relative area under the peaks and ratio of the protein peak area to that of the internal standard peak area.
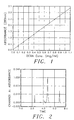
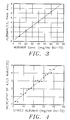
- FIG. 2 A typical electropherogram is shown in Figure 2.
- the peak area ratio of albumin to DCBA was calculated.
- a linear relationship was observed between the ratio and the concentration of albumin ( Figure 3).
- the slope was found to be 0.1029 for a 1.0 mg/ml albumin solution. The result of this regression analysis was then used as a conversion factor for calculating albumin concentration in further experiments.
- the reliability of the method of the present invention was tested by determining the correlation between results obtained with the method and those obtained with the Synchron (Beckman Instruments, Fullerton, CA) method and the Array (Beckman Instruments) method. Varying amounts of serum albumin were spiked in the human serum samples to make specimens with albumin concentration ranging from 0.2 mg/ml up to 4.0 mg/ml. The samples were assayed for albumin concentration by the three methods: Synchron, Array, and the capillary electrophoresis method of the present invention. A typical electropherogram of the serum sample by capillary electrophoresis is shown in Figure 5.
- the concentration of albumin in each sample was calculated by taking the peak area ratio of albumin to DCBA, dividing by the conversion factor, and extrapolated from the standard curve, and then compared with the results obtained by the other methods.
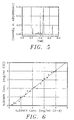
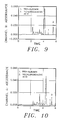
- Tables 1 and 2 ( Figures 6 and 7) show that between the capillary electrophoresis method of the present invention and Synchron, the correlation coefficient is 0.9939 with the slope of 1.055, and that between the method of the present invention and Array, the correlation coefficient is 0.9786 with the slope of 0.899.
- the total signal resulting from absorbance of the electrophoresed proteins at 214 nm was determined, and the total protein concentration of the sample was then determined by using the total protein signal.
- the total protein of the sample was then calculated by calculating the ratio of the total protein signal to the internal standard signal, and then determining the total protein concentration from the standard curve that related the ratio of protein signal to the internal standard signal to the protein concentration.
- the total protein concentration of each sample was also measured with the Synchron method. Table 3 and Figure 8 show the correlation results between the two methods. A correlation coefficient is 0.9977 with a slope of 0.94 was obtained. Again, this indicates a high degree of correlation between the methods.
- the internal standards 2,4-dichlorobenzoic acid (DCBA) and 2,4,6-trichlorobenzoic acid (TCBA) were compared in capillary electrophoresis of serum samples in order to determine the separation between the serum protein components and the internal standards as a function of the pH at which the electrophoresis was carried out.
- electrophoresis was carried out essentially as described above on the Beckman P/ACE 2000 system at 24°C.
- the capillary used was 25 ⁇ m in diameter and 20 cm in effective length.
- the detection wavelength was 214 nm.
- the separation voltage was 10 kv, and the separation time was 8 minutes.
- Sample injection was for 10 seconds in the pressure injection mode.
- the serum sample was diluted 10-fold with Beckman ICS diluent, containing 0.04% (v/v) dimethylformamide, 0.02% (w/v) DCBA, and 1% polyoxyethylene-9-lauryl ether (Thesit, Sigma, St. Louis, MO).
- the electrophoresis buffer was 150 mM boric acid, adjusted to a pH of from 9.5 to 10.5.
- Electrophoresis was carried out with the same way using TCBA as the internal standard, at pH values of from 10.0 to 10.3.
- the migration times in minutes for the prealbumin and the TCBA are shown in Table 5.
- the electropherogram resulting at pH 10.2 for TCBA is shown in Figure 10.
- the results indicate that at pH values between 9.5 and 10.3, either DCBA or TCBA is an effective internal standard, while at pH values greater than 10.3, the resolution between prealbumin and TCBA is reduced (data not shown) and the resolution between prealbumin and DCBA is good. Therefore, at pH values greater than 10.3, DCBA is preferred as the internal standard. If prealbumin is not of interest or is not present in the sample, both DCBA and TCBA can be used as internal standards.
- the method of the present invention was used to quantitate microalbumin or low concentrations of albumin in diabetic urine samples.
- the method as described above for serum was used, with TCBA as the internal standard.
- a series of standard serum albumin solutions was used to spike normal urine, previously filtered through a Bio-GelTM P6 gel filtration column (Bio-Rad, Richmond, CA) to make urine samples with varying albumin concentrations between 20 ⁇ g/ml and 640 ⁇ g/ml.
- the urine samples were then analyzed by capillary electrophoresis as described above.
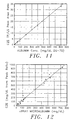
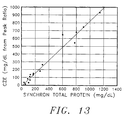
- the capillary electrophoresis method of the present invention was also used to determine urine total protein, and the results were compared with those obtained by the Synchron CX4 (Beckman Instruments, Fullerton, CA) method. When these results were compared, the correlation coefficient was 0.9867, the slope was 0.83, and the intercept was -0.462 ( Figure 13). This indicated a slightly lower recovery of protein for the capillary electrophoresis method than for the CX4 method.
- the present invention provides a rapid, efficient, reliable, and reproducible method of determining both the concentration of a marker protein of interest in a sample and the total protein concentration in the sample.
- the method can be used to detect any protein and has a wide dynamic range. It is relatively resistant to interference because it does nct require a specific reaction of a reagent with any particular group of the protein. It is useful for all types of biological samples as well as non-biological samples.
Landscapes
- Health & Medical Sciences (AREA)
- Life Sciences & Earth Sciences (AREA)
- Chemical & Material Sciences (AREA)
- Molecular Biology (AREA)
- Physics & Mathematics (AREA)
- Analytical Chemistry (AREA)
- Chemical Kinetics & Catalysis (AREA)
- Electrochemistry (AREA)
- Biochemistry (AREA)
- General Health & Medical Sciences (AREA)
- General Physics & Mathematics (AREA)
- Immunology (AREA)
- Pathology (AREA)
- Spectroscopy & Molecular Physics (AREA)
- Investigating Or Analysing Biological Materials (AREA)
- Investigating Or Analysing Materials By Optical Means (AREA)
- Peptides Or Proteins (AREA)
- Investigating Or Analysing Materials By The Use Of Chemical Reactions (AREA)
Claims (11)
- Méthode pour la quantification d'une protéine comprenant les étapes de :(a) ajouter une quantité connue d'un composé standard interne à un échantillon contenant au moins une protéine, le composé standard interne étant un acide dichlorobenzoique ou un acide trichlorobenzoique, produisant un signal de détecteur en relation avec la concentration et étant capable d'une separation électrophorétique de la protéine ;(b) soumettre l'échantillon et le composé standard interne à une électrophorèse capillaire pour séparer la protéine et le composé standard interne l'un de l'autre et d'autres composants dans l'échantillon ;(c) mesurer le signal du détecteur produit par le composé standard interne et un signal de détecteur produit par la protéine pour déterminer un rapport du signal de la protéine au signal du standard interne ; et(c) déterminer la concentration de la protéine dans l'échantillon à partir d'une courbe standard de la concentration de la protéine en fonction du rapport du signal de la protéine au signal du standard interne.
- Méthode selon la revendication 1, où ladite au moins une protéine est l'albumine.
- Méthode selon la revendication 1, où la concentration totale en protéine dans un échantillon doit être déterminée et où le signal de détecteur produit par le composé standard interne et le signal de détecteur total produit par toutes les protéines dans l'échantillon sont mesurés et le rapport du signal des protéines totales au signal du composé standard interne est déterminé, ainsi la concentration totale de la protéine dans l'échantillon est déterminée à partir d'une courbe standard de la concentration en protéines en fonction du rapport du signal des protéines totales au signal du standard interne.
- Méthode selon l'une quelconque des revendications 1 à 3, où le signal de détecteur est un signal d'un rayonnement électromagnétique détectable.
- Méthode selon la revendication 4, où le signal de détecteur est un signal produit par absorption de lumière dans les régions de l'ultraviolet et/ou du visible du spectre.
- Méthode selon la revendication 5, où le composé standard interne est un acide dichlorobenzoique.
- Méthode selon la revendication 6, où le composé standard interne est l'acide 2,4-dichlorobenzoique.
- Méthode selon la revendication 5, où le composé standard interne est l'acide trichlorobenzoïque.
- Méthode selon la revendication 8, où le composé standard interne est l'acide 2,4,6-trichlorobenzoique.
- Méthode selon la revendication 6, où la longueur d'onde à laquelle l'absorbance de la protéine séparée et du composé standard interne est mesurée est de 214 nm.
- Méthode selon la revendication 1, où la protéine est sélectionnée parmi l'albumine, une protéine de myelome, la préalbumine, une protéine liant le rétinol, l'α1-antitrypsine, l'α1-acide glycoprotéique, l'α1-fetoprotéique, l'haptoglobine, l'α2-macroglobuline, la céruloplasmine, la transferrine, la β2-microglobuline, la protéine C-réactive, la ferritine et un antigène carcinoembryonaire.
Applications Claiming Priority (3)
| Application Number | Priority Date | Filing Date | Title |
|---|---|---|---|
| US13351493A | 1993-10-07 | 1993-10-07 | |
| US133514 | 1993-10-07 | ||
| PCT/US1994/010402 WO1995010041A1 (fr) | 1993-10-07 | 1994-09-15 | Utilisation de l'electrophorese capillaire pour quantifier la concentration de composants proteiques et la teneur en proteine dans les fluides |
Publications (2)
| Publication Number | Publication Date |
|---|---|
| EP0672249A1 EP0672249A1 (fr) | 1995-09-20 |
| EP0672249B1 true EP0672249B1 (fr) | 1999-05-12 |
Family
ID=22458964
Family Applications (1)
| Application Number | Title | Priority Date | Filing Date |
|---|---|---|---|
| EP94929210A Expired - Lifetime EP0672249B1 (fr) | 1993-10-07 | 1994-09-15 | Utilisation de l'electrophorese capillaire pour quantifier la concentration de composants proteiques et la teneur en proteine dans les fluides |
Country Status (9)
| Country | Link |
|---|---|
| US (1) | US5490909A (fr) |
| EP (1) | EP0672249B1 (fr) |
| JP (1) | JP3484463B2 (fr) |
| AT (1) | ATE180056T1 (fr) |
| AU (1) | AU669308B2 (fr) |
| CA (1) | CA2149903C (fr) |
| DE (1) | DE69418450T2 (fr) |
| ES (1) | ES2131708T3 (fr) |
| WO (1) | WO1995010041A1 (fr) |
Families Citing this family (20)
| Publication number | Priority date | Publication date | Assignee | Title |
|---|---|---|---|---|
| US6045995A (en) * | 1994-08-24 | 2000-04-04 | Isis Pharmaceuticals, Inc. | Capillary electrophoretic detection of nucleic acids |
| GB9509410D0 (en) * | 1995-05-10 | 1995-07-05 | Imperial College | Molecular imaging |
| US5543730A (en) * | 1995-05-17 | 1996-08-06 | Altera Corporation | Techniques for programming programmable logic array devices |
| EP0852720A4 (fr) * | 1995-08-01 | 2000-02-23 | Signet Diagnostic Corp | Procede de mesure du volume de liquide et/ou de solide dans une suspension |
| US5922184A (en) * | 1997-07-21 | 1999-07-13 | Bio-Rad Laboratories, Inc. | Computer-directed detection of paraproteins |
| JPH1073569A (ja) * | 1996-08-30 | 1998-03-17 | Oriental Yeast Co Ltd | 蛋白の測定 |
| US6113763A (en) | 1996-11-04 | 2000-09-05 | Board Of Trustee Operating Michigan State University | Method for measuring cellular chemical profiles |
| US5804384A (en) * | 1996-12-06 | 1998-09-08 | Vysis, Inc. | Devices and methods for detecting multiple analytes in samples |
| US6156179A (en) * | 1998-07-09 | 2000-12-05 | Bio-Rad Laboratories | Computer directed identification of paraproteins |
| ITMI20011850A1 (it) * | 2001-09-03 | 2003-03-03 | Univ Pavia | Metodo per la separazione e la quantificazione di due conformazioni di beta2-microglobulina in equilibrio dinamico |
| US7381317B2 (en) | 2002-08-12 | 2008-06-03 | Beckman Coulter, Inc. | Methods and compositions for capillary electrophoresis (CE) |
| US20070014699A1 (en) | 2005-06-23 | 2007-01-18 | Beckman Coulter, Inc, | Methods and apparatus for improving the sensitivity of capillary zone electrophoresis |
| EP2100138B1 (fr) * | 2006-12-28 | 2012-06-20 | Wako Pure Chemical Industries, Ltd. | Procede de normalisation interne de dosages |
| US7808641B2 (en) * | 2007-04-13 | 2010-10-05 | C Technologies Inc. | Interactive variable pathlength device |
| CA2646944A1 (fr) * | 2007-11-30 | 2009-05-30 | Her Majesty The Queen In Right Of Canada, As Represented By The Minister Of National Defence | Composants de serum se liant a des agents de menace |
| DE102010047427A1 (de) * | 2010-10-04 | 2012-04-05 | Karlsruher Institut für Technologie | Selektive Proteinquantifizierung mittels multivariater Auswertung von UV-Absorptionsspektren |
| US12584892B2 (en) | 2019-07-23 | 2026-03-24 | The University Of British Columbia | Apparatus and methods for detecting and quantifying analytes |
| CN110873683B (zh) * | 2019-12-04 | 2021-08-03 | 中国计量科学研究院 | 基于es-dma-cpc的高准确度蛋白质标准物质定值方法 |
| JP2023063852A (ja) * | 2021-10-25 | 2023-05-10 | 株式会社タムロン | 検査装置および情報処理システム |
| CN116818871B (zh) * | 2023-06-09 | 2026-02-03 | 海普诺凯营养品有限公司 | 一种羊乳基婴儿配方食品中乳清蛋白含量的检测方法 |
Family Cites Families (7)
| Publication number | Priority date | Publication date | Assignee | Title |
|---|---|---|---|---|
| JPS5917142A (ja) * | 1982-07-20 | 1984-01-28 | Olympus Optical Co Ltd | デンシトグラムの記録方法 |
| US4927265A (en) * | 1988-04-29 | 1990-05-22 | 501 Microphoretic Systems, Inc. | Detector for fluorescence and absorption spectroscopy |
| US5120413A (en) * | 1991-05-31 | 1992-06-09 | Beckman Instruments, Inc. | Analysis of samples utilzing capillary electrophoresis |
| US5139630A (en) * | 1991-05-31 | 1992-08-18 | Beckman Instruments, Inc. | Identification of sample constituents utilizing capillary electrophoresis |
| US5310462A (en) * | 1991-05-31 | 1994-05-10 | Beckman Instruments, Inc. | Quantitation of samples utilizing capillary electrophoresis |
| US5145567A (en) * | 1991-11-14 | 1992-09-08 | Beckman Instruments, Inc. | Capillary zone electrophoretic analysis of isoenzymes |
| US5202006A (en) * | 1992-04-17 | 1993-04-13 | Beckman Instruments, Inc. | Analysis of hemoglobin variants by capillary zone electrophoresis |
-
1994
- 1994-09-15 AU AU78353/94A patent/AU669308B2/en not_active Ceased
- 1994-09-15 CA CA002149903A patent/CA2149903C/fr not_active Expired - Fee Related
- 1994-09-15 ES ES94929210T patent/ES2131708T3/es not_active Expired - Lifetime
- 1994-09-15 DE DE69418450T patent/DE69418450T2/de not_active Expired - Fee Related
- 1994-09-15 WO PCT/US1994/010402 patent/WO1995010041A1/fr not_active Ceased
- 1994-09-15 EP EP94929210A patent/EP0672249B1/fr not_active Expired - Lifetime
- 1994-09-15 AT AT94929210T patent/ATE180056T1/de not_active IP Right Cessation
- 1994-09-15 JP JP51081895A patent/JP3484463B2/ja not_active Expired - Fee Related
-
1995
- 1995-06-14 US US08/489,252 patent/US5490909A/en not_active Expired - Lifetime
Also Published As
| Publication number | Publication date |
|---|---|
| DE69418450D1 (de) | 1999-06-17 |
| JPH08504277A (ja) | 1996-05-07 |
| DE69418450T2 (de) | 1999-09-16 |
| US5490909A (en) | 1996-02-13 |
| WO1995010041A1 (fr) | 1995-04-13 |
| JP3484463B2 (ja) | 2004-01-06 |
| ES2131708T3 (es) | 1999-08-01 |
| ATE180056T1 (de) | 1999-05-15 |
| EP0672249A1 (fr) | 1995-09-20 |
| AU669308B2 (en) | 1996-05-30 |
| CA2149903A1 (fr) | 1995-04-13 |
| AU7835394A (en) | 1995-05-01 |
| CA2149903C (fr) | 2004-03-02 |
Similar Documents
| Publication | Publication Date | Title |
|---|---|---|
| EP0672249B1 (fr) | Utilisation de l'electrophorese capillaire pour quantifier la concentration de composants proteiques et la teneur en proteine dans les fluides | |
| US5431793A (en) | Quantitative analysis of glycosylated hemoglobin by immunocappillary electrophoresis | |
| US5599433A (en) | Capillary electrophoresis of glycosylated proteins | |
| Kim et al. | Quantitative analysis of serum proteins separated by capillary electrophoresis | |
| Wijnen et al. | Capillary electrophoresis of serum proteins. Reproducibility, comparison with agarose gel electrophoresis and a review of the literature | |
| Zhang et al. | High-sensitivity laser-induced fluorescence detection for capillary electrophoresis | |
| Tseng et al. | Selective determination of adenine-containing compounds by capillary electrophoresis with laser-induced fluorescence detection | |
| Kang et al. | On-column derivatization for the analysis of homocysteine and other thiols by capillary electrophoresis with laser-induced fluorescence detection | |
| González et al. | Direct determination of diuretic drugs in urine by capillary zone electrophoresis using fluorescence detection | |
| Dolník et al. | Capillary zone electrophoresis of organic acids in serum of critically ill children | |
| US5310462A (en) | Quantitation of samples utilizing capillary electrophoresis | |
| Britz-Mckibbin et al. | Sensitive and high-throughput analyses of purine metabolites by dynamic pH junction multiplexed capillary electrophoresis: a new tool for metabolomic studies | |
| Xu et al. | Simultaneous determination of urinary creatinine, calcium and other inorganic cations by capillary zone electrophoresis with indirect ultraviolet detection | |
| US7638024B2 (en) | Capillary electrophoresis method | |
| Guzman et al. | Capillary electrophoresis as a diagnostic tool: determination of biological constituents present in urine of normal and pathological individuals | |
| US5532166A (en) | Quantitative retinol assay for serum and dried blood spots | |
| Lecoq et al. | Fraction collection after an optimized micellar electrokinetic capillary chromatographic separation of nucleic acid constituents | |
| CN110596225B (zh) | 一种提高毛细管电泳重复性的方法 | |
| Lim et al. | Simple and sensitive laser‐induced fluorescence detection for capillary electrophoresis and its application to protein separation | |
| EP0848251A2 (fr) | Dosages homogènes en ligne utilisant l'électrophorèse | |
| Jenkins | Clinical applications of capillary electrophoresis: Status at the new millennium | |
| US20070044541A1 (en) | Electrophoretic analysis method | |
| Mikuš et al. | Capillary isotachophoresis of cystine in urine with on-line isotachophoresis sample pretreatment | |
| Feltus et al. | Post-capillary reaction detection in capillary electrophoresis based on the streptavidin–biotin interaction: Optimization and application to single cell analysis | |
| Cao et al. | A METHOD FOR DETERMINATION OF PARALYTIC SHELLFISH POISONS IN WATER BY CAPILLARY ELECTROPHORESIS |
Legal Events
| Date | Code | Title | Description |
|---|---|---|---|
| PUAI | Public reference made under article 153(3) epc to a published international application that has entered the european phase |
Free format text: ORIGINAL CODE: 0009012 |
|
| AK | Designated contracting states |
Kind code of ref document: A1 Designated state(s): AT BE CH DE DK ES FR GB GR IE IT LI LU MC NL PT SE |
|
| 17P | Request for examination filed |
Effective date: 19951002 |
|
| 17Q | First examination report despatched |
Effective date: 19971023 |
|
| GRAG | Despatch of communication of intention to grant |
Free format text: ORIGINAL CODE: EPIDOS AGRA |
|
| RAP1 | Party data changed (applicant data changed or rights of an application transferred) |
Owner name: BECKMAN COULTER, INC. |
|
| GRAG | Despatch of communication of intention to grant |
Free format text: ORIGINAL CODE: EPIDOS AGRA |
|
| GRAH | Despatch of communication of intention to grant a patent |
Free format text: ORIGINAL CODE: EPIDOS IGRA |
|
| GRAH | Despatch of communication of intention to grant a patent |
Free format text: ORIGINAL CODE: EPIDOS IGRA |
|
| GRAA | (expected) grant |
Free format text: ORIGINAL CODE: 0009210 |
|
| AK | Designated contracting states |
Kind code of ref document: B1 Designated state(s): AT BE CH DE DK ES FR GB GR IE IT LI LU MC NL PT SE |
|
| PG25 | Lapsed in a contracting state [announced via postgrant information from national office to epo] |
Ref country code: SE Free format text: THE PATENT HAS BEEN ANNULLED BY A DECISION OF A NATIONAL AUTHORITY Effective date: 19990512 Ref country code: NL Free format text: LAPSE BECAUSE OF FAILURE TO SUBMIT A TRANSLATION OF THE DESCRIPTION OR TO PAY THE FEE WITHIN THE PRESCRIBED TIME-LIMIT Effective date: 19990512 Ref country code: LI Free format text: LAPSE BECAUSE OF FAILURE TO SUBMIT A TRANSLATION OF THE DESCRIPTION OR TO PAY THE FEE WITHIN THE PRESCRIBED TIME-LIMIT Effective date: 19990512 Ref country code: GR Free format text: LAPSE BECAUSE OF NON-PAYMENT OF DUE FEES Effective date: 19990512 Ref country code: CH Free format text: LAPSE BECAUSE OF FAILURE TO SUBMIT A TRANSLATION OF THE DESCRIPTION OR TO PAY THE FEE WITHIN THE PRESCRIBED TIME-LIMIT Effective date: 19990512 Ref country code: AT Free format text: LAPSE BECAUSE OF FAILURE TO SUBMIT A TRANSLATION OF THE DESCRIPTION OR TO PAY THE FEE WITHIN THE PRESCRIBED TIME-LIMIT Effective date: 19990512 |
|
| REF | Corresponds to: |
Ref document number: 180056 Country of ref document: AT Date of ref document: 19990515 Kind code of ref document: T |
|
| REG | Reference to a national code |
Ref country code: CH Ref legal event code: EP |
|
| REG | Reference to a national code |
Ref country code: IE Ref legal event code: FG4D |
|
| REF | Corresponds to: |
Ref document number: 69418450 Country of ref document: DE Date of ref document: 19990617 |
|
| REG | Reference to a national code |
Ref country code: ES Ref legal event code: FG2A Ref document number: 2131708 Country of ref document: ES Kind code of ref document: T3 |
|
| ITF | It: translation for a ep patent filed | ||
| PG25 | Lapsed in a contracting state [announced via postgrant information from national office to epo] |
Ref country code: PT Free format text: LAPSE BECAUSE OF FAILURE TO SUBMIT A TRANSLATION OF THE DESCRIPTION OR TO PAY THE FEE WITHIN THE PRESCRIBED TIME-LIMIT Effective date: 19990812 Ref country code: DK Free format text: LAPSE BECAUSE OF FAILURE TO SUBMIT A TRANSLATION OF THE DESCRIPTION OR TO PAY THE FEE WITHIN THE PRESCRIBED TIME-LIMIT Effective date: 19990812 |
|
| ET | Fr: translation filed | ||
| PG25 | Lapsed in a contracting state [announced via postgrant information from national office to epo] |
Ref country code: LU Free format text: LAPSE BECAUSE OF NON-PAYMENT OF DUE FEES Effective date: 19990915 Ref country code: IE Free format text: LAPSE BECAUSE OF NON-PAYMENT OF DUE FEES Effective date: 19990915 |
|
| REG | Reference to a national code |
Ref country code: CH Ref legal event code: PL |
|
| PLBE | No opposition filed within time limit |
Free format text: ORIGINAL CODE: 0009261 |
|
| STAA | Information on the status of an ep patent application or granted ep patent |
Free format text: STATUS: NO OPPOSITION FILED WITHIN TIME LIMIT |
|
| PG25 | Lapsed in a contracting state [announced via postgrant information from national office to epo] |
Ref country code: MC Free format text: LAPSE BECAUSE OF NON-PAYMENT OF DUE FEES Effective date: 20000331 |
|
| 26N | No opposition filed | ||
| REG | Reference to a national code |
Ref country code: IE Ref legal event code: MM4A |
|
| REG | Reference to a national code |
Ref country code: GB Ref legal event code: IF02 |
|
| PGFP | Annual fee paid to national office [announced via postgrant information from national office to epo] |
Ref country code: ES Payment date: 20070926 Year of fee payment: 14 |
|
| PGFP | Annual fee paid to national office [announced via postgrant information from national office to epo] |
Ref country code: GB Payment date: 20070926 Year of fee payment: 14 |
|
| PGFP | Annual fee paid to national office [announced via postgrant information from national office to epo] |
Ref country code: IT Payment date: 20070927 Year of fee payment: 14 Ref country code: DE Payment date: 20071031 Year of fee payment: 14 |
|
| PGFP | Annual fee paid to national office [announced via postgrant information from national office to epo] |
Ref country code: BE Payment date: 20071025 Year of fee payment: 14 |
|
| PGFP | Annual fee paid to national office [announced via postgrant information from national office to epo] |
Ref country code: FR Payment date: 20070917 Year of fee payment: 14 |
|
| BERE | Be: lapsed |
Owner name: *BECKMAN COULTER INC. Effective date: 20080930 |
|
| GBPC | Gb: european patent ceased through non-payment of renewal fee |
Effective date: 20080915 |
|
| REG | Reference to a national code |
Ref country code: FR Ref legal event code: ST Effective date: 20090529 |
|
| PG25 | Lapsed in a contracting state [announced via postgrant information from national office to epo] |
Ref country code: BE Free format text: LAPSE BECAUSE OF NON-PAYMENT OF DUE FEES Effective date: 20080930 |
|
| PG25 | Lapsed in a contracting state [announced via postgrant information from national office to epo] |
Ref country code: IT Free format text: LAPSE BECAUSE OF NON-PAYMENT OF DUE FEES Effective date: 20080915 Ref country code: DE Free format text: LAPSE BECAUSE OF NON-PAYMENT OF DUE FEES Effective date: 20090401 |
|
| PG25 | Lapsed in a contracting state [announced via postgrant information from national office to epo] |
Ref country code: FR Free format text: LAPSE BECAUSE OF NON-PAYMENT OF DUE FEES Effective date: 20080930 |
|
| REG | Reference to a national code |
Ref country code: ES Ref legal event code: FD2A Effective date: 20080916 |
|
| PG25 | Lapsed in a contracting state [announced via postgrant information from national office to epo] |
Ref country code: GB Free format text: LAPSE BECAUSE OF NON-PAYMENT OF DUE FEES Effective date: 20080915 |
|
| PG25 | Lapsed in a contracting state [announced via postgrant information from national office to epo] |
Ref country code: ES Free format text: LAPSE BECAUSE OF NON-PAYMENT OF DUE FEES Effective date: 20080916 |