EP0676891A2 - Procédé d'établissement de seuil pour des images document - Google Patents
Procédé d'établissement de seuil pour des images document Download PDFInfo
- Publication number
- EP0676891A2 EP0676891A2 EP95302108A EP95302108A EP0676891A2 EP 0676891 A2 EP0676891 A2 EP 0676891A2 EP 95302108 A EP95302108 A EP 95302108A EP 95302108 A EP95302108 A EP 95302108A EP 0676891 A2 EP0676891 A2 EP 0676891A2
- Authority
- EP
- European Patent Office
- Prior art keywords
- intensity
- value
- representation
- intensity value
- image
- Prior art date
- Legal status (The legal status is an assumption and is not a legal conclusion. Google has not performed a legal analysis and makes no representation as to the accuracy of the status listed.)
- Withdrawn
Links
Images


Classifications
-
- H—ELECTRICITY
- H04—ELECTRIC COMMUNICATION TECHNIQUE
- H04N—PICTORIAL COMMUNICATION, e.g. TELEVISION
- H04N1/00—Scanning, transmission or reproduction of documents or the like, e.g. facsimile transmission; Details thereof
- H04N1/40—Picture signal circuits
- H04N1/403—Discrimination between the two tones in the picture signal of a two-tone original
-
- G—PHYSICS
- G06—COMPUTING OR CALCULATING; COUNTING
- G06V—IMAGE OR VIDEO RECOGNITION OR UNDERSTANDING
- G06V30/00—Character recognition; Recognising digital ink; Document-oriented image-based pattern recognition
- G06V30/10—Character recognition
- G06V30/16—Image preprocessing
- G06V30/162—Quantising the image signal
-
- H—ELECTRICITY
- H04—ELECTRIC COMMUNICATION TECHNIQUE
- H04N—PICTORIAL COMMUNICATION, e.g. TELEVISION
- H04N1/00—Scanning, transmission or reproduction of documents or the like, e.g. facsimile transmission; Details thereof
- H04N1/40—Picture signal circuits
-
- G—PHYSICS
- G06—COMPUTING OR CALCULATING; COUNTING
- G06V—IMAGE OR VIDEO RECOGNITION OR UNDERSTANDING
- G06V30/00—Character recognition; Recognising digital ink; Document-oriented image-based pattern recognition
- G06V30/10—Character recognition
Definitions
- the present invention relates to a method of processing document images and, more particularly, to a method of multi-thresholding a document image.
- a glossary is appended to the end of the specification.
- paper documents have been used to transmit and store information.
- computers and scanners become less expensive and more powerful, electronic storage, transmission and reproduction of documents is gaining in popularity.
- electronic documents must be processed in such a way that when they are reproduced, they closely resemble corresponding paper documents, and will therefore be accepted by a human user. For example, if a page of text is scanned into a system, the text must be readable to the human user and not be subjected to distortion, such as characters improperly connected or fragmented.
- data contained in paper documents is captured by optical scanning. Scanning generates signals indicative of the intensity value of sampled image elements known as pixels.
- the pixels are generally described by data having ON (1) and OFF (0) values for binary images, such as those containing only text, and 0-255 values for gray-scale images, such as those containing pictures.
- the pixel data are then processed so that further analysis may be performed on the image.
- One such pixel process which is performed is the thresholding of a gray-scale image or color image to an image that contains significantly fewer intensity or "information" levels, such as a binary image or a multiple level image.
- Thresholding is a known image processing operation applied to gray-scale document images to obtain binary intensity level images or multiple intensity level (multi-level) images, where the number of levels is much fewer than in the original image.
- a gray-scale image typically has a large range of intensity values, e.g., 256 values, but usually far fewer levels of information.
- a page of magazine text has two levels of information; black text and the white background.
- a gray-scale image of the same page will have many more intensity values due to factors, such as non-uniform printing of characters contained in the text and shadows caused by lighting effects.
- Other types of documents, such as journal covers generally include multiple levels of information, e.g., multiple colors which are used both in the text and background of the document page.
- each color on the page is represented by multiple intensity values.
- Proper thresholding therefore requires both proper selection of the number of thresholds needed to represent the number of levels of information and also the selection of the optimum values for these thresholds.
- a thresholded image should result in an image which, if viewed electronically, would be consistent with a paper document of the same image.
- One purpose of thresholding is to realize an image that can be efficiently stored for future access and reading.
- Another purpose is to yield an image suitable for optical character recognition (OCR). Both of these purposes require that the thresholded image be of high quality for legibility of reading and best recognition by an OCR system.
- a method generally used to process an image containing two levels of information is binarization.
- binarization is inadequate for documents which contain more than two levels of information.
- known multi-level thresholding methods exist in which the number of threshold levels must be preselected, thereby limiting the number of thresholds identified.
- a problem arises in situations where three thresholds levels are predefined and the document image to be thresholded contains four threshold levels. These techniques will not identify the fourth level.
- Known global techniques for thresholding multi-level images compile image representations in the form of intensity histograms which represent the number of pixels at each of the intensity values in the image. See, e.g., N. Otsu, "A Threshold Selection Method from Gray-Level Histograms", IEEE Trans. Systems, Man, and Cybernetics, Vol. SMC-9, No. 1, Han. 1979, pp. 62-66. Peaks in the intensity histogram indicate that a large number of pixels have the same intensity value and therefore correspond to a particular information level. Thresholds are determined from the intensity histogram by calculating a measurement which best separates the peaks.
- Known local thresholding techniques consider information which describes the similarity of intensity values among adjacent or nearby pixels. Local information includes factors such as the edge definition of individual characters and the manner in which characters are connected or disconnected, also referred to as connectivity. See, e.g., J.M. White and G.D. Rohrer, "Image Thresholding for Optical Character Recognition and Other Applications Requiring Character Image Extraction," IBM J. Res. Development, Vol. 27, No. 4, July 1983, pp. 400-411. Local techniques have an advantage over global techniques in that the local techniques recognize that pixels of a particular threshold level usually occur as connected groups of pixels used to form characters and other types of regions.
- a disadvantage of the local techniques as compared with the global techniques is that fewer pixels are considered for each local thresholding decision, i.e. local groups of pixels. As a result, the presence of noisy values can cause erroneous results.
- the global methods since the global methods consider all of the pixels contained in the image for a global thresholding decision, the noisy pixels usually comprise a small percentage of the total number of pixels and do not greatly impact on the thresholding result.
- thresholding methods that more accurately define the number of threshold levels needed for accurately recording a like number of levels of information on a document, and for determining the optimum threshold values for each threshold level.
- a method of multi-thresholding a document image has been realized which considers both local and global information in determining the number of thresholded levels contained in a gray-scale image.
- a gray-scale image is comprised of a plurality of pixels. Each pixel has an intensity value. Local regions of pixels having intensity values above a given intensity value are identified for each intensity value contained in the gray-scale image and compiled into a global representation of the image. Intensity ranges are identified in the global representation in which the intensity values of the pixel are approximately constant. A threshold value is identified within each range which represents the most constant point within the representation range. The number of threshold levels is set equal to the number of ranges in the representation.
- the present invention considers both global and local information to identify connected pixels of similar intensity which are then considered in determining both the number of threshold levels and the value of each threshold level.
- the connected regions are preserved and they are differentiated from their background regions, thereby ensuring that any text contained within the scanned document is not distorted or improperly connected.
- FIG. 1 illustrates a block diagram of a multi-thresholding document system in accordance with the present invention.
- FIG. 2 illustrates a section of a document page containing multiple information levels.
- FIG. 3 illustrates a gray-scale image having three regions.
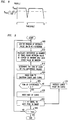
- FIG. 4 illustrates a block diagram illustrating the steps for thresholding a gray-scale image in accordance with the present invention.
- FIG. 5 illustrates a runs histogram for the image of FIG. 3.
- FIG. 6 illustrates an intensity cross section along a row of the image of FIG. 3.
- FIG. 7 illustrates a runs histogram for the row illustrated in FIG. 6.
- FIG. 8 illustrates a sliding profile derived from the runs histogram of FIG. 3.
- FIG. 9 illustrates a gray-scale image of a text character.
- FIG. 10 illustrates an intensity histogram of a row of the image of FIG. 9.
- FIG. 11 illustrates a runs histogram of the image of FIG. 9.
- FIG. 1 illustrates a multi-thresholding document system 100 which incorporates the principles of the present invention.
- the multi-thresholding document system 100 may illustratively be a system for electronically storing documents, such as journals, magazines, newspapers or books.
- a document 105 which is to be entered into the system 100 is scanned by scanner 110.
- Scanner 110 converts document 105 into digital image signals to create a gray-scale image.
- the gray-scale image is received by a processor 115 which determines the number of threshold levels contained within the gray-scale image in a manner which will be described in detail below.
- the digital image signals representing the thresholded images are stored in memory 125.
- the thresholded images can be retrieved from memory 125 and viewed on display 120 or a hard copy may be obtained by printing the image using a printer (not shown).
- a user of the system 100 may search the document images using various searching techniques, such as formulating a search request by inputting key words using a keyboard (not shown).
- Document images containing the key words are identified by the processor 115 and a listing of the document images is shown on display 120.
- the user may then view one of the document images by inputting the appropriate command.
- the requested document image is retrieved from memory 125 and shown on the display 120.
- the retrieved document images may be binary level images which contain two levels of information, or multi-level images which contain greater than two levels of information.
- An example of a document page 200 is illustrated in FIG. 2.
- Document page 200 represents a journal cover which comprises three levels of information.
- the first level of information is the background 205 which is printed in a first color, illustratively blue.
- the second level of information includes text sections 210 and 215 which are printed in a second color, illustratively black.
- the third level of information includes text section 220 which is printed in a third color, illustratively white.
- FIG. 3 illustrates a gray-scale image 300 comprised of a plurality of pixels. Each pixel has an intensity value. Groups of pixels having similar intensity values are identified as connected regions. Image 300 is comprised of three pixels regions which contain pixels having similar intensity values. Pixel region 305 is comprises an area of 5 pixels x 5 pixels and has an intensity value of 4. Pixel region 310 comprises an area of 6 pixels x 6 pixels and has an intensity value of 4. Pixel region 315 comprises an area of 4 pixels x 4 pixels and has an intensity value of 12.
- FIG. 4 is a block diagram illustrating a method for thresholding the gray-scale image of FIG. 3.
- a global representation of the gray-scale image is created by determining a "runs" histogram (step 405).
- a run is a group of connected pixels of the same or similar intensity values identified within the image. For example, a run may be a portion of a row or column or may be a region which is specified by a particular area of the image.
- a sliding profile is determined from the runs histogram (step 410). The sliding profile yields a measurement of "flatness" or the lack of variation of runs for ranges around each intensity level represented by the runs histogram.
- the number of thresholds are determined from the sliding profile (step 415). The number of thresholds is equal to the number of peaks in the sliding profile that reach, or are close to reaching, the maximum.
- the runs histogram is generated by determining the number of runs at each given threshold level in the image.
- the intensity value for each pixel within the image is identified in raster scan order. For a given row within the image, such as the row indicated by dotted line 330 in the image of FIG. 3, each pixel is inspected to identify its intensity value. Intensity values for adjacent pixels which become successively larger indicate the beginning of a run. Likewise, adjacent pixels which successively decrease in value indicate the end of a run.
- FIG. 6 illustrates an intensity cross-section for the row 330 of image 300.
- the intensity cross-section shows the intensity value for each pixel along the row.
- the intensity level first increases to intensity level 4 at 605 when pixel region 305 is first reached.
- runs for intensity levels 1, 2, and 3 are also initiated.
- the plot stays at intensity level 4 until the end of pixel region 305 is detected as indicated at 610.
- the end of pixel region 305 also indicates the end of each of the runs for intensity levels 1-4 since the pixel region 305 is adjacent the background which is assumed to have an intensity level of 0.
- the intensity level increases to 12 at 615 when pixel region 315 is first reached. As indicated by the cross-section, runs for intensity levels 1-11 are also initiated. The plot stays at intensity level 12 until the end of pixel region 315 is detected as indicated at 620. The end of pixel region 315 is adjacent the background.
- FIG. 7 illustrates the runs histogram for row 330. As shown, two runs exist between threshold levels 0 and 4, and one run exists between threshold levels 4 and 12. An accumulated runs histogram is compiled for image 300 by identifying the runs in each row and each column of the image.
- FIG. 5 illustrates a runs histogram for image 300. Thirty runs are identified as having thresholds lower than intensity level 4 since each row and column for each pixel region has an intensity level greater than 3 (i.e., 5+5+4+4+6+6). Eight runs are identified as having threshold levels between intensity level 4 and intensity level 12. No runs exist which have a threshold level greater than intensity level 12.
- Threshold values are determined from the runs histogram by identifying ranges on the runs histogram in which the runs remain most constant. These ranges are represented by the flat portions of the runs histogram. Referring to FIG. 7, the number of thresholds detected is equal to two as indicated by the two flat ranges. A first threshold value would be chosen which would fall between intensity level 0 and intensity level 4. A second intensity level would be chosen which would fall between intensity level 4 and intensity level 12.
- the measurement of the flat ranges in the runs histogram may be determined in a number of ways.
- a sliding profile is determined from the runs histogram (step 410 of FIG. 4).
- the sliding profile yields a measurement of "flatness" or the lack of variation of runs for ranges around each intensity level represented by the runs histogram.
- the sliding profile plots profile values P(i), which correspond to an expected flatness deviation ⁇ F, as a function of the intensity value contained in the runs histogram.
- These flat ranges correspond to intensity value ranges in which the runs remain constant. This indicates that the runs are clearly defined in these ranges and that the intensities within each range are between region intensities. If a threshold is identified within each range, the regions separated by these ranges would be identified.
- the sliding profile is illustratively computed by using a window which slides along the vertical axis of the runs histogram and which centers on the intensity value of each pixel in the image.
- the computations indicate flat ranges in the runs histogram.
- the resulting profile value at that intensity level is maximum.
- the resulting profile value at that intensity level is less than maximum.
- Maximum values on the sliding profile correspond to flat ranges on the runs histogram. Threshold values are selected as the maximum within each profile peak.
- FIG. 9 illustrates a flow chart depicting the computation of the sliding profile in more detail.
- a window size is selected which is centered at each intensity level on the runs histogram (step 905).
- the window size is dependent on a minimum contrast user parameter which specifies the minimum distance between intensity levels.
- This parameter is illustratively expressed as a percentage of the difference between threshold levels and is preferably as large as possible so that any noise present in a generally flat intensity level range is averaged out.
- the parameter should not be larger than the minimum intensity value difference between different threshold levels such that the window causes averaging to occur between different threshold levels.
- the parameter is set to 10%.
- the sliding profile is calculated from the runs histogram in the following way.
- a calculation is made of the difference in the number of runs by determining the difference between the intensity value at the center of the window and each other intensity value contained in the window. The differences are then summed which provides a flatness measurement for the pixel located at the center of the window.
- the flatness measurement is determined by the following equation:
- a sliding profile for the runs histogram shown in FIG.5 is illustrated in FIG. 8. Two peaks are shown in the sliding profile.
- the number of thresholds are determined from the sliding profile (step 415 of FIG. 4).
- the number of thresholds is equal to the number of peaks in the sliding profile that reach, or are close to reaching, the maximum.
- FIG. 3 there are two flat ranges in the runs histogram which are perfectly flat, resulting in two sliding profile peaks which reach maximum.
- a scanned image will be subjected to variations in intensity values due to factors such as, but not limited to, noise, lighting and other effects which will cause the profile peaks to be less than maximum, and not completely flat.
- the threshold level is selected from the flattest portion of the profile peak.
- Binarization a method of thresholding a gray-scale image to realize an image which contains two intensity levels
- Local Technique - a thresholding technique which selects thresholds at each pixel based on a local neighborhood around that pixel Pixel - image elements Run - a group of connected pixels above a given intensity level Runs Histogram - a representation of the number of runs at each intensity value within an image Sliding Profile - a representation of the lack of variation of runs at each intensity value represented by the runs histogram Threshold - an intensity value which is selected for a given image
Landscapes
- Engineering & Computer Science (AREA)
- Multimedia (AREA)
- Signal Processing (AREA)
- Computer Vision & Pattern Recognition (AREA)
- Physics & Mathematics (AREA)
- General Physics & Mathematics (AREA)
- Theoretical Computer Science (AREA)
- Facsimile Image Signal Circuits (AREA)
- Image Processing (AREA)
- Image Analysis (AREA)
- Character Input (AREA)
Applications Claiming Priority (2)
| Application Number | Priority Date | Filing Date | Title |
|---|---|---|---|
| US22444694A | 1994-04-07 | 1994-04-07 | |
| US224446 | 1994-04-07 |
Publications (2)
| Publication Number | Publication Date |
|---|---|
| EP0676891A2 true EP0676891A2 (fr) | 1995-10-11 |
| EP0676891A3 EP0676891A3 (fr) | 1997-04-09 |
Family
ID=22840722
Family Applications (1)
| Application Number | Title | Priority Date | Filing Date |
|---|---|---|---|
| EP95302108A Withdrawn EP0676891A3 (fr) | 1994-04-07 | 1995-03-29 | Procédé d'établissement de seuil pour des images document. |
Country Status (4)
| Country | Link |
|---|---|
| US (1) | US5781658A (fr) |
| EP (1) | EP0676891A3 (fr) |
| JP (1) | JPH07282253A (fr) |
| CA (1) | CA2144793C (fr) |
Cited By (1)
| Publication number | Priority date | Publication date | Assignee | Title |
|---|---|---|---|---|
| GB2323493A (en) * | 1997-02-25 | 1998-09-23 | British Broadcasting Corp | Quantisation for compression systems |
Families Citing this family (17)
| Publication number | Priority date | Publication date | Assignee | Title |
|---|---|---|---|---|
| US6269188B1 (en) | 1998-03-12 | 2001-07-31 | Canon Kabushiki Kaisha | Word grouping accuracy value generation |
| US6243501B1 (en) | 1998-05-20 | 2001-06-05 | Canon Kabushiki Kaisha | Adaptive recognition of documents using layout attributes |
| JP3345350B2 (ja) * | 1998-05-27 | 2002-11-18 | 富士通株式会社 | 文書画像認識装置、その方法、及び記録媒体 |
| US6222642B1 (en) * | 1998-08-10 | 2001-04-24 | Xerox Corporation | System and method for eliminating background pixels from a scanned image |
| JP2000217000A (ja) * | 1998-11-19 | 2000-08-04 | Murata Mach Ltd | 画像処理装置、画像処理方法及び記録媒体 |
| EP1117072A1 (fr) * | 2000-01-17 | 2001-07-18 | Koninklijke Philips Electronics N.V. | Amélioration de texte |
| US6674900B1 (en) | 2000-03-29 | 2004-01-06 | Matsushita Electric Industrial Co., Ltd. | Method for extracting titles from digital images |
| US7050195B1 (en) * | 2000-04-20 | 2006-05-23 | Hewlett-Packard Development Company, L.P. | Printed medium data storage |
| EP1402463A1 (fr) * | 2001-06-15 | 2004-03-31 | Koninklijke Philips Electronics N.V. | Detection automatique d'un contenu naturel en information video |
| US7088857B2 (en) * | 2002-01-31 | 2006-08-08 | Hewlett-Packard Development Company, L.P. | Dynamic bilevel thresholding of digital images |
| US7257248B2 (en) * | 2003-03-27 | 2007-08-14 | General Electric Company | Non-contact measurement system and method |
| US7734089B2 (en) * | 2005-08-23 | 2010-06-08 | Trident Microsystems (Far East) Ltd. | Method for reducing mosquito noise |
| US8311329B2 (en) * | 2006-09-07 | 2012-11-13 | Lumex As | Relative threshold and use of edges in optical character recognition process |
| US8189917B2 (en) * | 2008-09-25 | 2012-05-29 | Sharp Laboratories Of America, Inc. | Methods and systems for locating text in a digital image |
| US8422777B2 (en) * | 2008-10-14 | 2013-04-16 | Joshua Victor Aller | Target and method of detecting, identifying, and determining 3-D pose of the target |
| US20110075935A1 (en) * | 2009-09-25 | 2011-03-31 | Sony Corporation | Method to measure local image similarity based on the l1 distance measure |
| US10475189B2 (en) | 2017-12-11 | 2019-11-12 | Adobe Inc. | Content aware, spatially adaptive automated thresholding of images |
Family Cites Families (7)
| Publication number | Priority date | Publication date | Assignee | Title |
|---|---|---|---|---|
| DE3107521A1 (de) * | 1981-02-27 | 1982-09-16 | Siemens AG, 1000 Berlin und 8000 München | Verfahren zum automatischen erkennen von bild- und text- oder graphikbereichen auf druckvorlagen |
| US4673977A (en) * | 1985-06-20 | 1987-06-16 | International Business Machines Corporation | Method of spatially thresholding a discrete color image |
| CA1268547A (fr) * | 1986-03-31 | 1990-05-01 | Ahmed Mostafa El-Sherbini | Dispositif de selection d'algorithmes de seuillage |
| US5073954A (en) * | 1989-02-28 | 1991-12-17 | Electrocom Automation, Inc. | Bar code location and recognition processing system |
| FR2670979A1 (fr) * | 1990-12-21 | 1992-06-26 | Philips Electronique Lab | Procede de segmentation binaire locale d'images numerisees, par seuillage d'histogramme. |
| US5179599A (en) * | 1991-06-17 | 1993-01-12 | Hewlett-Packard Company | Dynamic thresholding system for documents using structural information of the documents |
| US5450502A (en) * | 1993-10-07 | 1995-09-12 | Xerox Corporation | Image-dependent luminance enhancement |
-
1995
- 1995-03-16 CA CA002144793A patent/CA2144793C/fr not_active Expired - Fee Related
- 1995-03-29 EP EP95302108A patent/EP0676891A3/fr not_active Withdrawn
- 1995-04-07 JP JP7081625A patent/JPH07282253A/ja not_active Withdrawn
-
1996
- 1996-08-09 US US08/694,807 patent/US5781658A/en not_active Expired - Lifetime
Cited By (1)
| Publication number | Priority date | Publication date | Assignee | Title |
|---|---|---|---|---|
| GB2323493A (en) * | 1997-02-25 | 1998-09-23 | British Broadcasting Corp | Quantisation for compression systems |
Also Published As
| Publication number | Publication date |
|---|---|
| EP0676891A3 (fr) | 1997-04-09 |
| US5781658A (en) | 1998-07-14 |
| CA2144793C (fr) | 1999-01-12 |
| CA2144793A1 (fr) | 1995-10-08 |
| JPH07282253A (ja) | 1995-10-27 |
Similar Documents
| Publication | Publication Date | Title |
|---|---|---|
| US5781658A (en) | Method of thresholding document images | |
| US5546474A (en) | Detection of photo regions in digital images | |
| US7292375B2 (en) | Method and apparatus for color image processing, and a computer product | |
| US6151423A (en) | Character recognition with document orientation determination | |
| US6574375B1 (en) | Method for detecting inverted text images on a digital scanning device | |
| US5956468A (en) | Document segmentation system | |
| US7440618B2 (en) | Apparatus for extracting rules line from multiple-valued image | |
| US6160913A (en) | Method and apparatus for digital halftone dots detection and removal in business documents | |
| US6014450A (en) | Method and apparatus for address block location | |
| Savakis | Adaptive document image thresholding using foreground and background clustering | |
| JP4719386B2 (ja) | カラー原稿の解釈 | |
| JPH04361391A (ja) | 光学的文字認識システムおよび方法 | |
| US5081690A (en) | Row-by-row segmentation and thresholding for optical character recognition | |
| US6941013B1 (en) | Method of image binarization using histogram modeling | |
| EP0680005B1 (fr) | Amélioration de la vitesse et de la reconnaissance pour OCR utilisant une position normalisée de hauteur/largeur | |
| US5768414A (en) | Separation of touching characters in optical character recognition | |
| US7151859B2 (en) | Method and system for correcting direction or orientation of document image | |
| US5812695A (en) | Automatic typing of raster images using density slicing | |
| US11948342B2 (en) | Image processing apparatus, image processing method, and non-transitory storage medium for determining extraction target pixel | |
| JP2700131B2 (ja) | パターン認識方法 | |
| Polyakova et al. | Improvement of the color text image binarization method using the minimum-distance classifier | |
| JP3466449B2 (ja) | パターン認識方法および装置とパターン認識方法をコンピュータに実行させるためのプログラムを記録した記録媒体 | |
| Liu et al. | Document image binarization based on texture analysis | |
| EP1006476A2 (fr) | Méthode pour l'amélioration de caractères dans une image originelle binaire d'un document | |
| JP3578247B2 (ja) | 文字認識方法および装置 |
Legal Events
| Date | Code | Title | Description |
|---|---|---|---|
| PUAI | Public reference made under article 153(3) epc to a published international application that has entered the european phase |
Free format text: ORIGINAL CODE: 0009012 |
|
| AK | Designated contracting states |
Kind code of ref document: A2 Designated state(s): DE FR GB |
|
| PUAL | Search report despatched |
Free format text: ORIGINAL CODE: 0009013 |
|
| AK | Designated contracting states |
Kind code of ref document: A3 Designated state(s): DE FR GB |
|
| 17P | Request for examination filed |
Effective date: 19970924 |
|
| 17Q | First examination report despatched |
Effective date: 19990525 |
|
| GRAG | Despatch of communication of intention to grant |
Free format text: ORIGINAL CODE: EPIDOS AGRA |
|
| STAA | Information on the status of an ep patent application or granted ep patent |
Free format text: STATUS: THE APPLICATION IS DEEMED TO BE WITHDRAWN |
|
| 18D | Application deemed to be withdrawn |
Effective date: 20001002 |