EP0698860A2 - Méthode de mesure d'une ligne de contour - Google Patents
Méthode de mesure d'une ligne de contour Download PDFInfo
- Publication number
- EP0698860A2 EP0698860A2 EP95113060A EP95113060A EP0698860A2 EP 0698860 A2 EP0698860 A2 EP 0698860A2 EP 95113060 A EP95113060 A EP 95113060A EP 95113060 A EP95113060 A EP 95113060A EP 0698860 A2 EP0698860 A2 EP 0698860A2
- Authority
- EP
- European Patent Office
- Prior art keywords
- edge
- edge line
- window
- line
- subareas
- Prior art date
- Legal status (The legal status is an assumption and is not a legal conclusion. Google has not performed a legal analysis and makes no representation as to the accuracy of the status listed.)
- Ceased
Links
Images




Classifications
-
- G—PHYSICS
- G01—MEASURING; TESTING
- G01B—MEASURING LENGTH, THICKNESS OR SIMILAR LINEAR DIMENSIONS; MEASURING ANGLES; MEASURING AREAS; MEASURING IRREGULARITIES OF SURFACES OR CONTOURS
- G01B11/00—Measuring arrangements characterised by the use of optical techniques
-
- G—PHYSICS
- G06—COMPUTING OR CALCULATING; COUNTING
- G06T—IMAGE DATA PROCESSING OR GENERATION, IN GENERAL
- G06T7/00—Image analysis
- G06T7/0002—Inspection of images, e.g. flaw detection
- G06T7/0004—Industrial image inspection
-
- G—PHYSICS
- G06—COMPUTING OR CALCULATING; COUNTING
- G06T—IMAGE DATA PROCESSING OR GENERATION, IN GENERAL
- G06T7/00—Image analysis
-
- G—PHYSICS
- G06—COMPUTING OR CALCULATING; COUNTING
- G06T—IMAGE DATA PROCESSING OR GENERATION, IN GENERAL
- G06T7/00—Image analysis
- G06T7/10—Segmentation; Edge detection
- G06T7/12—Edge-based segmentation
-
- G—PHYSICS
- G06—COMPUTING OR CALCULATING; COUNTING
- G06T—IMAGE DATA PROCESSING OR GENERATION, IN GENERAL
- G06T7/00—Image analysis
- G06T7/70—Determining position or orientation of objects or cameras
-
- G—PHYSICS
- G06—COMPUTING OR CALCULATING; COUNTING
- G06T—IMAGE DATA PROCESSING OR GENERATION, IN GENERAL
- G06T2207/00—Indexing scheme for image analysis or image enhancement
- G06T2207/10—Image acquisition modality
- G06T2207/10056—Microscopic image
-
- G—PHYSICS
- G06—COMPUTING OR CALCULATING; COUNTING
- G06T—IMAGE DATA PROCESSING OR GENERATION, IN GENERAL
- G06T2207/00—Indexing scheme for image analysis or image enhancement
- G06T2207/30—Subject of image; Context of image processing
- G06T2207/30108—Industrial image inspection
- G06T2207/30148—Semiconductor; IC; Wafer
Definitions
- the present invention relates to a method for measuring the position and slope of a specific edge line of a target object by means of, for example, a visual recognition apparatus used for measuring, assembling, and inspecting tasks in the manufacturing processes of electronic devices.
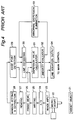
- Fig. 4 is a block diagram of the configuration of an edge line measuring apparatus according to the prior art.
- an image input means 23 is disposed to the eyepiece of the microscope 22 used to capture the edge line of the target object 21 being measured.
- the image signal output by the image input means 23 is then converted to a digital signal by the A/D converter 24, and is then stored to the frame memory 26 by the writing means 25.
- the window setting and extraction means 28 then extracts only the required image data from the frame memory 26 by means of the reading means 27.
- the edge point detection means 29 then detects the edges from the read image data, and outputs the coordinate data of the extracted edges to the line estimating means 30.
- the line estimating means 30 estimates the lines based on the coordinate data of the edge points input thereto, and transfers the linear equation data to the dispersion calculator 31.
- the dispersion calculator 31 calculates the distance from the line candidate drawn according to this linear equation to each of the edge points in the subarea, and sends this distance data to the linearity evaluator 32.
- the linearity evaluator 32 determines whether the distance from the line to any of the edge points is abnormally great based on the data supplied from the dispersion calculator 31, and outputs to the abnormal dispersion elimination means 33 when an abnormal distance is detected.
- the abnormal dispersion elimination means 33 then eliminates the edge point farthest from the line, and instructs the line estimating means 30 to re-estimate the line based on the coordinate data of the remaining edge points.
- the linearity evaluator 32 determines the linearity of the line candidate is sufficient (does not detect any abnormal line-to-point distance), after looping through the abnormal dispersion elimination means 33 and repeating the evaluation as may be necessary, it outputs the linear equation to the line output means 34, which then outputs the linear equation to the main controller.
- the main controller Based on this linear equation and the linear equation of the other edge line obtained in the same manner, the main controller then calculates the intersection of or the distance between the two lines.
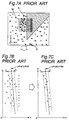
- the window setting and extraction means 28 opens a window W within field of view F.
- This window W is opened both to contain a specific edge line E of the target object 21, and to cover an area on both sides thereof.
- the window setting and extraction means 28 also draws n sampling lines L1 - L n at a certain interval Mp and in a direction crossing edge line E.
- the reading means 27 then reads the image data on each of the sampling lines L1 - L n from the frame memory 26; and the edge point detection means 29 detects as the edge points those points indicating a change in brightness, and obtains the coordinates P 1 (x 1 ,y 1 ) - P n (x n ,y n ) of each of the edge points.
- the linearity evaluator 32 determines whether each dispersion value is within the range of a predetermined value C2. If there is an edge point outside this C2 range, the linearity evaluator 32 determines the line candidate to lack sufficient linearity, and outputs to the abnormal dispersion elimination means 33.
- the linearity evaluator 32 determines that the line candidate has sufficient linearity, and therefore outputs the result to the line output means 34.
- edge line E when the contrast of the edge line E is low and these low contrast edge points are detected, small changes in brightness resulting from electrical noise are also detected even in areas where the edge points are black or white. It is therefore not possible to accurately extract the edge line in such cases.
- an object of the present invention is to provide an edge line measuring method for accurately obtaining in a short period of time the position and slope of a specific edge line even when there are many extraneous points around the edge line to be obtained due to dust and other such garbage or electrical noise.
- an edge line measuring method comprises the steps of:
- the edge line measuring method according to the present invention further comprises the step of:
- the subareas are preferably defined such that adjacent subareas overlap.
- step (c) detects the brightness change when the change in brightness exceeding a predetermined threshold value in the scanning direction.
- the edge line measuring method according to the present invention further comprises the steps of:
- subareas are formed by dividing the area inside the window into rectangular blocks by means of lines parallel to the edge line.
- the subarea containing the most edge points (the highest edge point population subarea) is then selected from this group of subareas, and a linear equation is obtained based only on the edge points within the highest edge point population subarea.
- the area of the window When there is a wide variation in the position of the edge line, the area of the window must be widened to reliably include the edge line within the window. If the mini-subareas are defined within this large window to find the mini-subarea with the highest edge point population, the number of mini-subareas will become extremely large and processing time will increase. In such cases, the primary window is divided into secondary windows that are wider than the subareas but narrower than the primary window. The secondary window containing the edge line is then extracted and divided into rectangular mini-subareas, thereby shortening the overall processing time required.
- the edge line spans between adjacent subareas, the edge line will be obtained based on a small number of edge points, and precision may deteriorate.
- the probability of the edge line spanning adjacent subareas (or mini-subareas) is low, and the edge lines can be measured with high precision.
- edge points based on the change in brightness the effects of minute changes in brightness caused by garbage or noise can be eliminated, and the edge line can therefore be accurately extracted, by extracting as edge points only those points at which the change in brightness exceeds a constant threshold level.
- Fig. 1 is a block diagram of an edge line measuring apparatus according to the present invention.
- an image input means 3 is disposed to the eyepiece of the microscope 2 used to capture the edge line of the target object 1 being measured.
- the image signal output by the image input means 3 is then converted to a digital signal by the A/D converter 4, and is then stored to the frame memory 6 by the writing means 5.
- the window setting and extraction means 8 opens a primary window, previously, covering an area inclusive of a specific edge line of the target object 1 and an area of sufficient size on both sides of said edge line. Once the digital signal is stored to the frame memory 6, the window setting and extraction means 8 extracts from the frame memory 6 by means of the reading means 7 only specific image data from the image data contained within said primary window.
- the target object 1 is so arranged that the specific edge line is about perpendicular to the scan direction which will be described later.
- the edge point detection means 9 Based on this specific image data, the edge point detection means 9 then detects the edge points from the change in brightness.
- the smoothing processor 10 functions to remove extraneous noise below a constant threshold level from the extracted specific image data.
- the subarea formation means 12 then divides the area inside the primary window into rectangular subareas in a direction parallel to the edge line.
- the highest edge point population subarea selection means 14 Based on the coordinate data of each edge point, the highest edge point population subarea selection means 14 also obtains the total number of edge points in each of the subareas to extract the subarea with the highest edge point population.
- the line estimating means 15 estimates the location of the edge line using a least squares method based on the coordinate data of the edge points in the subarea containing the most edge points, and outputs the obtained linear equation data to the dispersion value calculator 16.
- the dispersion value calculator 16 calculates the distance from the line drawn according to this linear equation to each of the edge points, and outputs the results to the linearity evaluator 17.
- the linearity evaluator 17 determines whether the line drawn according to this linear equation is within the predetermined linearity tolerance range based on the data from the dispersion value calculator 16. If linearity is not within the tolerance range, the linearity evaluator 17 outputs to the abnormal dispersion elimination means 18. The abnormal dispersion elimination means 18 then eliminates the edge point farthest from the line drawn according to this linear equation, and instructs the line estimating means 15 to re-estimate the line based on the coordinate data of the remaining edge points.
- the linearity evaluator 17 determines the linearity of the line candidate is sufficient (the values are within the tolerance range), it outputs to the line equation output means 19, which then outputs the linear equation to the main controller.
- Variation detection means 20 and 27, each detects whether or not the edge points are highly concentrated in the highest edge point population subarea as selected by selection means 14 or 26, or whether or not the edge points are scattered in other subareas. In other words, the variation detection means 20 or 27 detects the variation of the edge points.
- a secondary window necessity detection means 23 detects whether or not the secondary window should be used.
- a secondary window setting and extraction means 22 extracts from the primary window a secondary window that is narrower than the primary window, and containing the edge line.
- a mini-subarea formation means 24 divides the area inside the secondary window into rectangular mini-subareas in a direction parallel to the edge line. Based on the coordinate data of each edge point, the highest edge point population mini-subarea selection means 26 obtains the total number of edge points in each of the mini-subareas to extract the mini-subarea with the highest edge point population.
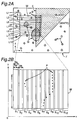
- a window W is opened to contain the specific edge line E to be measured.
- the size and location of this window W is preset relative to the field of view F with consideration given to variations in the position of the target object 1. Note that the present embodiment is described with reference to a situation in which there is little variation in the position of the edge line E, and the window W is therefore not particularly large.
- the window setting and extraction means 8 scans the window W to draw plural sampling lines at a certain interval Mp and in a direction crossing edge line E as shown in Fig. 2A. Note that there are thirteen sampling lines L1 - L13 in this example. The brightness information on these sampling lines is then read from the frame memory 6 by the reading means 7.
- the edge point detection means 9 detects and obtains coordinates of all points indicating a change from bright to dark in the scanning direction (or dark to bright if the scanning direction is opposite that shown in Fig. 2A), and outputs this data as the specific image data.
- Possible detection methods include threshold value methods whereby those points exceeding a predetermined threshold value set according to the sampling conditions are obtained, and quadratic differential zero cross methods obtaining the zero cross point after quadratic differentiation.
- the smoothing processor 10 removes minute roughness below a constant level based on the image data by applying a smoothing method optimized for the sampling conditions; such methods include applying a low pass filter and multiplex averaging methods. This process effectively removes data indicating a change in brightness due to garbage and noise.
- the smoothing processor 10 can therefore be eliminated in environments not subject to such garbage or noise.
- the subarea formation means 12 divides the area inside the window W into areas parallel to the edge line and measuring Sa x Sb at a regular offset of Sp in the direction of the sampling lines from the edge line, resulting in subareas S1 - S12 in this case.
- the resulting rectangular subareas S1 - S12 are thus formed parallel to the edge line, offset in the scanning direction so that adjacent subareas overlap, and in a size large enough to contain the edge line.
- the highest edge point population subarea selection means 14 then counts the total number of edge points P in each subarea to extract the subarea containing the most edge points.
- the number of edge points contained in the extracted highest edge point population subarea is defined as Pp.
- subarea S9 is extracted as the subarea with the highest edge point population, and the edge point number Pp is 8.
- the edge point population subarea Assume that there is no garbage or noise that effects the detection of the edge points, and that all the edge points are properly detected, then all the edge points will be contained in the highest edge point population subarea. Thus, in the above example, since there are 13 sampling lines, the number of edge points contained in the highest edge point population subarea with 100% capturing will be 13. Such a number of edge points captured 100% by the highest edge point population subarea is indicated as a maximum edge point number Pt. Actually, due to garbage and noise, the edge point number Pp contained in the highest edge point population area will be much less than the maximum edge point number Pt, or the edge point number Pp will be not so different from the number Ps of edge points contained in the second highest edge point population area. In such a case, it is preferable to produce an edge detection failure indication.
- the variation detection means 20 detects whether or not the edge point number Pp contained in the highest edge point population subarea is greater than a predetermined rate M% (such as 70%) of the maximum edge point number Pt and, at the same time, detects whether or not a difference between the edge point numbers Pp and Ps is greater than a predetermined rate N% (such as 50%) of the edge point number Pp. In other words, variation detection means 20 detects whether or not Pp>Pt ⁇ M/100 and (Pp-Ps)>Pp ⁇ N/100 are satisfied. If the above relationships are not satisfied, detection error (edge line detection failure) is indicated. When the above relationships are satisfied, the line estimation at line estimating means 15 is carried out with the edge point detection using the primary window W or the secondary window W2.
- M% such as 70%
- N% such as 50%
- Whether to use the secondary window or not is determined by factors, such as the variation of the edge lines within the view and the time length permitted to detect the edge line.
- factors such as the variation of the edge lines within the view and the time length permitted to detect the edge line.
- the wide area in the window should be examined with relatively thick stripes of subareas to detect roughly where the edge line exits, and then reduce the size of the window and the area in the window is examined with relatively thin stripes of subareas (mini-subareas) to accurately detect the edge line, thereby reducing the total edge line detection time.
- the secondary window necessity detector 23 when the primary window W is set at a size greater than a predetermined size, always edge point detection is further carried with the secondary window W2, and when the primary window W is set at a size smaller than a predetermined size, the edge point detection with the secondary window W2 is omitted.
- the secondary window setting means 22 cuts out from the primary window W a secondary window W2 large enough to contain the edge line but narrower than the primary window W. Based on the edge point data obtained as described with reference to Figs. 2A and 2B, the secondary window W2 is so set and extracted that the highest edge point population subarea is contained within the secondary window W2.
- the selection and extraction of the secondary window W2 can be done in such a manner that the primary window W is divided into a plurality of columns, and selecting one column that has the highest number of edge point as the secondary window W2.
- the extracted secondary window W2 will reliably contain the edge line.
- the mini-subarea formation means 24 will divide the area inside the secondary window W2 into areas measuring da x db at a regular offset of dp in the direction of the sampling lines from and parallel to the edge line, resulting in mini-subareas D1 - D9 in this case.
- the highest edge point population mini-subarea selection means 26 then counts the total number of edge points P in each mini-subarea to extract the mini-subarea containing the most edge points.
- mini-subarea D6 is extracted as the mini-subarea with the highest edge point population.
- the dispersion value calculator 16 calculates the squares, i.e., the dispersion value, of the distance from the line drawn according to this linear equation to each of the edge points in the extracted subarea.
- the linearity evaluator 17 determines whether each dispersion value is within the range of a predetermined value C2. If there is an edge point outside this range of C2, the linearity evaluator 17 determines the line candidate to lack sufficient linearity, and outputs to the abnormal dispersion elimination means 18.
- the linearity evaluator 17 determines that the line candidate has sufficient linearity because all dispersion values are within the tolerance range C2, it outputs to the line equation output means 19.
- the viewing window By thus dividing the viewing window into subareas or mini-subareas parallel to the edge line that is to be measured, measuring errors caused by arc-shaped garbage in the vicinity of the edge line can be eliminated, and the position of the edge line can be measured with high precision.
- the processing time can be reduced.
- the present invention is only effective if the slope of the line is restricted to a particular range. This limitation can be satisfied fairly simply in actual working environments, however, by means of a mechanism positioning the target object to the optical system. It is also possible to add a mechanism for obtaining the approximate position and slope of the edge line by means of pattern matching or a similar method, and then automatically setting the window according to the detected position and slope.
- the present invention can also be used to measure arcs and edge lines of other shapes by defining the group of subareas or mini-subareas according to the shape of the edge line being measured.
- the area inside the window is divided into a group of rectangular subareas by means of lines parallel to the edge line, the subarea containing the most edge points is selected from this group, and a linear equation is obtained based on the edge points within the selected subarea.
- line approximation is accomplished after eliminating the data separated from these edge points, and the edge lines can therefore be extracted reliably and quickly.
- the size of the primary window must be increased accordingly to reliably include the edge line within the primary window.
- the edge lines can be measured with high precision.
- edge points Furthermore, by extracting as edge points only those points at which the change in brightness exceeds a constant threshold level when the edge points are obtained based on the change in brightness, the effects of minute changes in brightness caused by garbage or noise can be eliminated, and the edge line can therefore be accurately extracted.
Landscapes
- Engineering & Computer Science (AREA)
- Physics & Mathematics (AREA)
- General Physics & Mathematics (AREA)
- Computer Vision & Pattern Recognition (AREA)
- Theoretical Computer Science (AREA)
- Quality & Reliability (AREA)
- Length Measuring Devices By Optical Means (AREA)
- Image Analysis (AREA)
- Image Processing (AREA)
Applications Claiming Priority (2)
| Application Number | Priority Date | Filing Date | Title |
|---|---|---|---|
| JP196827/94 | 1994-08-22 | ||
| JP19682794 | 1994-08-22 |
Publications (2)
| Publication Number | Publication Date |
|---|---|
| EP0698860A2 true EP0698860A2 (fr) | 1996-02-28 |
| EP0698860A3 EP0698860A3 (fr) | 1998-08-05 |
Family
ID=16364330
Family Applications (1)
| Application Number | Title | Priority Date | Filing Date |
|---|---|---|---|
| EP95113060A Ceased EP0698860A3 (fr) | 1994-08-22 | 1995-08-19 | Méthode de mesure d'une ligne de contour |
Country Status (3)
| Country | Link |
|---|---|
| US (1) | US5805728A (fr) |
| EP (1) | EP0698860A3 (fr) |
| KR (1) | KR100187346B1 (fr) |
Cited By (1)
| Publication number | Priority date | Publication date | Assignee | Title |
|---|---|---|---|---|
| EP1413984A3 (fr) * | 2002-10-23 | 2011-05-04 | Keyence Corporation | Détection dans une image numérique de la variation du bord d'une pièce de fabrication |
Families Citing this family (11)
| Publication number | Priority date | Publication date | Assignee | Title |
|---|---|---|---|---|
| US6611609B1 (en) | 1999-04-09 | 2003-08-26 | The Board Of Regents Of The University Of Nebraska | Method of tracking changes in a multi-dimensional data structure |
| US8682077B1 (en) | 2000-11-28 | 2014-03-25 | Hand Held Products, Inc. | Method for omnidirectional processing of 2D images including recognizable characters |
| JP3870044B2 (ja) * | 2001-07-25 | 2007-01-17 | 株式会社日立製作所 | パターン検査方法及びパターン検査装置 |
| US6909791B2 (en) * | 2002-04-03 | 2005-06-21 | General Phosphorix, Llc | Method of measuring a line edge roughness of micro objects in scanning microscopes |
| KR100501450B1 (ko) * | 2002-12-11 | 2005-07-18 | 현대자동차주식회사 | 가변 배기 파이프의 구조 |
| US20060039627A1 (en) * | 2004-08-21 | 2006-02-23 | Xerox Corporation | Real-time processing of grayscale image data |
| JP4801427B2 (ja) * | 2005-01-04 | 2011-10-26 | 株式会社日立ハイテクノロジーズ | パターン形状評価方法 |
| US20060165292A1 (en) * | 2005-01-26 | 2006-07-27 | Xerox Corporation. | Noise resistant edge detection |
| US7873233B2 (en) * | 2006-10-17 | 2011-01-18 | Seiko Epson Corporation | Method and apparatus for rendering an image impinging upon a non-planar surface |
| KR100891553B1 (ko) * | 2007-11-08 | 2009-04-03 | (주)와이티에스 | 선영역 스캔을 이용한 디스플레이용 글라스 기판의 에지점검출방법 |
| JP5203787B2 (ja) * | 2008-04-17 | 2013-06-05 | 株式会社日立ハイテクノロジーズ | データ解析装置 |
Family Cites Families (8)
| Publication number | Priority date | Publication date | Assignee | Title |
|---|---|---|---|---|
| FR1578261A (fr) * | 1967-08-08 | 1969-08-14 | ||
| DE3505793A1 (de) * | 1984-02-21 | 1985-08-22 | Kabushiki Kaisha Komatsu Seisakusho, Tokio/Tokyo | Objektidentifikationsverfahren |
| US5359666A (en) * | 1988-09-28 | 1994-10-25 | Honda Giken Kogyo Kabushiki Kaisha | Driving way judging device and method |
| IL88286A (en) * | 1988-11-04 | 1992-07-15 | Scitex Corp Ltd | Method and apparatus for preparing picture masks and for digitizing line edges |
| JPH0820725B2 (ja) * | 1990-02-06 | 1996-03-04 | 大日本スクリーン製造株式会社 | 画像輪郭データの作成方法 |
| JP2754871B2 (ja) * | 1990-06-01 | 1998-05-20 | 日産自動車株式会社 | 走行路検出装置 |
| DE69228741T2 (de) * | 1991-10-02 | 1999-09-02 | Fujitsu Ltd. | Verfahren zur bestimmung der lokalen orientierung eines kontursegmentes und zur bestimmung von linien und ecken |
| JP3169483B2 (ja) * | 1993-06-25 | 2001-05-28 | 富士通株式会社 | 道路環境認識装置 |
-
1995
- 1995-08-19 KR KR1019950025539A patent/KR100187346B1/ko not_active Expired - Fee Related
- 1995-08-19 EP EP95113060A patent/EP0698860A3/fr not_active Ceased
- 1995-08-21 US US08/518,601 patent/US5805728A/en not_active Expired - Fee Related
Non-Patent Citations (1)
| Title |
|---|
| None |
Cited By (1)
| Publication number | Priority date | Publication date | Assignee | Title |
|---|---|---|---|---|
| EP1413984A3 (fr) * | 2002-10-23 | 2011-05-04 | Keyence Corporation | Détection dans une image numérique de la variation du bord d'une pièce de fabrication |
Also Published As
| Publication number | Publication date |
|---|---|
| KR960009603A (ko) | 1996-03-22 |
| US5805728A (en) | 1998-09-08 |
| EP0698860A3 (fr) | 1998-08-05 |
| KR100187346B1 (ko) | 1999-05-01 |
Similar Documents
| Publication | Publication Date | Title |
|---|---|---|
| US7668377B2 (en) | Method of obtaining a depth map from a digital image | |
| EP0149457B1 (fr) | Méthode d'identification de lignes de contour | |
| US5805728A (en) | Edge line measuring method | |
| US5120940A (en) | Detection of barcodes in binary images with arbitrary orientation | |
| EP0507319B1 (fr) | Système de traitement d'image d'empreinte digitale capable de traiter facilement les details minutieux | |
| US6954550B2 (en) | Image processing method and apparatus | |
| JP3799408B1 (ja) | 画像処理装置および画像処理方法 | |
| US6917720B1 (en) | Reference mark, method for recognizing reference marks and method for object measuring | |
| US6535621B1 (en) | Defect integrated processing apparatus and method thereof | |
| EP3534334B1 (fr) | Procédé d'identification de points caractéristiques d'un motif d'étalonnage dans un ensemble de points candidats dérivés d'une image du motif d'étalonnage | |
| US20020009230A1 (en) | Template matching using correlative auto-predicative search | |
| KR20090101356A (ko) | 결함 검출 장치 및 결함 검출 방법 | |
| KR100214240B1 (ko) | 지문특징추출장치 | |
| US20030190069A1 (en) | Method of measuring a line edge roughness of micro objects in scanning microscopes | |
| US4745296A (en) | Process for optically testing circuit boards to detect incorrect circuit patterns | |
| US6532310B1 (en) | Removing noise caused by artifacts from a digital image signal | |
| JP2000067247A (ja) | 画像認識装置 | |
| EP0809205B1 (fr) | Appareil et méthode pour détecter des lignes de caractères par l'utilisation d'information de projection simplifiée; Appareil et méthode de reconnaissance de caractères | |
| JP5424694B2 (ja) | 画像認識装置、及びプログラム | |
| US6597805B1 (en) | Visual inspection method for electronic device, visual inspecting apparatus for electronic device, and record medium for recording program which causes computer to perform visual inspecting method for electronic device | |
| US6757421B1 (en) | Method and apparatus for detecting defects | |
| JP3549637B2 (ja) | エッジライン測定方法 | |
| JPH06116914A (ja) | 塗膜劣化診断方法及び装置 | |
| US7702158B2 (en) | Image processing apparatus, image processing method and record medium for the image processing apparatus | |
| JP3146882B2 (ja) | 絵柄検査方法 |
Legal Events
| Date | Code | Title | Description |
|---|---|---|---|
| PUAI | Public reference made under article 153(3) epc to a published international application that has entered the european phase |
Free format text: ORIGINAL CODE: 0009012 |
|
| 17P | Request for examination filed |
Effective date: 19950819 |
|
| AK | Designated contracting states |
Kind code of ref document: A2 Designated state(s): DE FR GB |
|
| PUAL | Search report despatched |
Free format text: ORIGINAL CODE: 0009013 |
|
| AK | Designated contracting states |
Kind code of ref document: A3 Designated state(s): DE FR GB |
|
| 17Q | First examination report despatched |
Effective date: 20010629 |
|
| GRAG | Despatch of communication of intention to grant |
Free format text: ORIGINAL CODE: EPIDOS AGRA |
|
| STAA | Information on the status of an ep patent application or granted ep patent |
Free format text: STATUS: THE APPLICATION HAS BEEN REFUSED |
|
| 18R | Application refused |
Effective date: 20021125 |