EP0845720A1 - Verfahren zur Analyse und Darstellung von transienten Prozessvorgängen - Google Patents
Verfahren zur Analyse und Darstellung von transienten Prozessvorgängen Download PDFInfo
- Publication number
- EP0845720A1 EP0845720A1 EP97120787A EP97120787A EP0845720A1 EP 0845720 A1 EP0845720 A1 EP 0845720A1 EP 97120787 A EP97120787 A EP 97120787A EP 97120787 A EP97120787 A EP 97120787A EP 0845720 A1 EP0845720 A1 EP 0845720A1
- Authority
- EP
- European Patent Office
- Prior art keywords
- map
- trajectory
- neurons
- states
- variables
- Prior art date
- Legal status (The legal status is an assumption and is not a legal conclusion. Google has not performed a legal analysis and makes no representation as to the accuracy of the status listed.)
- Granted
Links
Images


Classifications
-
- G—PHYSICS
- G06—COMPUTING OR CALCULATING; COUNTING
- G06N—COMPUTING ARRANGEMENTS BASED ON SPECIFIC COMPUTATIONAL MODELS
- G06N3/00—Computing arrangements based on biological models
- G06N3/02—Neural networks
- G06N3/04—Architecture, e.g. interconnection topology
-
- G—PHYSICS
- G05—CONTROLLING; REGULATING
- G05B—CONTROL OR REGULATING SYSTEMS IN GENERAL; FUNCTIONAL ELEMENTS OF SUCH SYSTEMS; MONITORING OR TESTING ARRANGEMENTS FOR SUCH SYSTEMS OR ELEMENTS
- G05B19/00—Program-control systems
- G05B19/02—Program-control systems electric
- G05B19/04—Program control other than numerical control, i.e. in sequence controllers or logic controllers
- G05B19/042—Program control other than numerical control, i.e. in sequence controllers or logic controllers using digital processors
- G05B19/0423—Input/output
- G05B19/0425—Safety, monitoring
-
- G—PHYSICS
- G06—COMPUTING OR CALCULATING; COUNTING
- G06N—COMPUTING ARRANGEMENTS BASED ON SPECIFIC COMPUTATIONAL MODELS
- G06N3/00—Computing arrangements based on biological models
- G06N3/02—Neural networks
- G06N3/04—Architecture, e.g. interconnection topology
- G06N3/0499—Feedforward networks
-
- Y—GENERAL TAGGING OF NEW TECHNOLOGICAL DEVELOPMENTS; GENERAL TAGGING OF CROSS-SECTIONAL TECHNOLOGIES SPANNING OVER SEVERAL SECTIONS OF THE IPC; TECHNICAL SUBJECTS COVERED BY FORMER USPC CROSS-REFERENCE ART COLLECTIONS [XRACs] AND DIGESTS
- Y10—TECHNICAL SUBJECTS COVERED BY FORMER USPC
- Y10S—TECHNICAL SUBJECTS COVERED BY FORMER USPC CROSS-REFERENCE ART COLLECTIONS [XRACs] AND DIGESTS
- Y10S706/00—Data processing: artificial intelligence
- Y10S706/902—Application using ai with detail of the ai system
- Y10S706/903—Control
- Y10S706/906—Process plant
- Y10S706/907—Power plant
Definitions
- the invention relates to a method for analyzing and displaying process states and process operations of a technical system.
- the method is suitable for the analysis and display of process states and Operations of a power plant.
- the invention has for its object to provide a method that Simultaneous and coherent evaluation and display of relevant process states and sequences of process states of a technical system. Especially should enable the analysis and display of transient process processes will. In addition, an extension of the procedure for diagnosis is intended transient processes can be specified.
- Another possible solution would be a method based on the main component analysis, a mathematical process for reducing dimensions, which is aimed at a data distribution from a high-dimensional room to describe as well as possible in a low-dimensional space.
- the main component analysis analysis of variance is achieved by a linear projection in a space - which is spanned by the eigenvectors of the data distribution - realized.
- this linear approach means restrictions, which is why the main component analysis not seen as a satisfactory solution to the task at hand becomes.
- a projection onto non-linear surfaces, so-called Major manifolds performed. These nonlinear areas are covered by so-called topology-preserving Kohonen maps spanned in the state space of the plant.
- such a card is a "self-organizing neural network" in which all neurons are arranged side by side.
- the self-organizing neural network is an established term for a special class of neural networks that structure themselves based on input signals, cf. A. Zell Simulation of neural networks , Addison-Wesley Verlag, 1994, pages 179 to 187.
- the spatial position of the individual neurons plays an important role in the Kohonen maps.
- the process state calculated by the method is preserved on this topology Map of potential process states plotted and visualized and is continue directly with others, e.g. previous process states, comparable.
- the map thus represents a topology-preserving, two-dimensional one window in the n-dimensional state space of the system Associated with this description that the points in the entrance space are close lie close together, also in the exit room, i.e. on the map will lie.
- the relevant n Process sizes offered In the method according to the invention, after appropriate data preprocessing a self-organizing network in a learning phase the relevant n Process sizes offered.
- the learning phase takes place in two steps: First unfolded the map in the status area of the system, then the system states visualized using a mathematical method.
- the visualization of the physical system status is based on a static one Visualization process in which the differences in the weight vectors of a calculated each neuron to its neighbors and prepared it accordingly, e.g. color-coded. Contiguous areas (e.g. bright areas in Fig. 2) have a small difference because their neurons are in the state space were placed close to each other. There is between these individual clusters Limits characterized by a large difference in the respective weight vectors are, e.g. visualized as dark areas (see FIG. 2). In order to can be a good visualization of the cluster boundaries and thus the real plant conditions see also G. Whittington, C. Spracklen: The Application of Neural Network Model to Sensor Data Fusion in Proc. of Applications of ANN Conference, Orlando, USA, 1990.
- the winner-takes-all algorithm is a procedure in which only the neuron that best fulfills a certain condition is active; all other neurons in the network or card are inactive (1-out-of-m selection).
- This special condition is, for example, the minimum distance between the current input vector and the weight vector of the individual neurons, see S. Hafner, Neural networks in automation technology , Oldenbourg Verlag, 1994, in particular pages 17 to 25.
- the process is automated in the sense that the process can automatically recognize deviations from process processes - represented as trajectories on a map - from a reference process and determine the underlying causes.
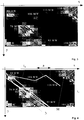
- Fig. 1 shows the structure of a system for performing the method for process analysis and diagnosis with a neural card. A description of the structure results from the description of the process steps.
- Process step 1 Recording and selection of the process variables
- a data acquisition and processing system for example a data server based on a computer in a control system, Cyclically records process values from a technical system, for example from a boiler of a power plant.
- a subsequent data analysis system subjects the selected and relevant data to a correlation analysis to determine the to determine independent, process-describing measurands.
- Process step 2 learning phase of the card (off-line)
- Step 2.1 Development of the self-organizing, neural network in the state space of the system, based on the algorithm by T. Kohonen.
- the Kohonen algorithm adapts the weight vectors of the neurons on the map, taking into account their neighborhood relationships and the input vector.
- Step 2.2 Representation of the unfolded network as a map - as a so-called map
- Application of a static visualization method by the differences of the Weight vectors of the neurons can be visualized.
- Fig. 2 shows an example - here in a black and white representation - the structured and color-coded, neural map for different system states of a boiler (bright contiguous areas). It shows the projection and visualization of several load states of the boiler on a neural map with 15 * 20 neurons. The current load of the power plant in megawatts is entered by hand for the respective clusters in the picture.
- the x axis indicates the number of neurons in the x direction
- the y axis the number of neurons in the y direction.
- the system states z and z + 1 represent two different load states of the system.
- the dark areas on the map form the boundaries between the different ones Plant states, since they represent neurons that are very far apart in the plant room are removed.
- the bright clusters of the map form neurons in the plant room are very close to each other, they correspond to the real load conditions the plant.
- each system state is based on 11 independent process variables is determined and thus 11-dimensional, can be a by the method Projection can be done on only two dimensions; this makes one significant better overview of the actual process states achieved than with the individual consideration of all 11 process variables.
- the number of simultaneously evaluated Process sizes are not limited to 11, they can be much larger.
- Process step 3 application - process analysis with the card (off-line / on-line)
- Step 3.1 Connection of the card to the process and representation of the current process status on the structured map.
- the current process state through a neural "winner-takes-all” algorithm evaluated and applied to the previously structured and color-coded map.
- the three black circles correspond to three plant states at different Times t.
- the current, generally high-dimensional system condition can be visualized in the context of other system states.
- the spatial location the current process status on the structured map provides information about the current status of the system.
- Step 3.2 Graphic connection of winning neurons
- the current winner neuron at time t 0 is marked, for example, by a black circle (cf. FIG. 2). If one connects these winning neurons with each other, a trajectory of the current process states develops on the structured map with the time t, which either grows continuously or moves on the map with a fixed, predetermined length.
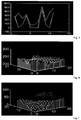
- FIG. 3 shows - here in a black and white representation - an example of such a trajectory course on a structured, color-coded, neuronal map with 15 * 20 neurons when starting and changing a load of a boiler over a period of 250 minutes.
- the x-axis in FIG. 3 indicates the number of neurons in the x-direction, the y-axis the number of neurons in the y-direction.
- the various load conditions of the system are marked by bright clusters in the picture.
- Step 3.3 Superimposing trajectories of different process operations for visual comparison and analysis of complex dynamic processes
- FIG. 4 shows an example for two different boiler trips, the black trajectory t r corresponds to a 'good' reference approach, the white trajectory t u here represents a load change from 126 MW to 95 MW.
- the x-axis in FIG. 4 shows the number of neurons in the x direction, the y axis the number of neurons in the y direction.
- the potential load conditions of the system are marked by bright clusters in the picture.
- Step 4 Application - Diagnostic phase of the card
- Neuron 'N' is in the plant room placed virtually in the 28 MW state
- neuron 'M' speaks to the 130 MW load state
- their spatial position on the map is marked in Fig. 4 as a white circular area.
- FIG. 5 shows the weight distribution of these two map neurons.
- the x-axis in FIG. 5 corresponds to the weights w 1 , w 2 , .., w 11 of the neurons 'N' and 'M', the y-axis represent the normalized values of the individual weights. It can be seen that the neurons differ primarily in their weights w 10 , w 2 and w 3 . This is confirmed with a standard deviation calculation.
- the process analysis is made possible by calculating the correlation coefficient and the standard deviation of the weight distribution of selected (operator-selected) neurons.
- the operator can thus determine the cause of any two deviations on-line because he only needs to click on the neurons on the map in which the trajectories differ (visually) particularly, for example by distance a in FIG. 4.
- the cause of the deviations ie the process variables with the greatest standard deviations, are calculated below. This enables simple diagnosis options to be implemented with the card.
- Process step 5 Representation of process relationships with the map
- Step 5.1 Another possible processing step on the map leads to the use of data mining strategies in the power plant area, the weight distributions of individual process variables are shown over the entire map, FIGS. 6 and 7 illustrate this using an example. Since the process distribution in the weights of the neurons is coded on the map and the weight distribution can be shown on the map, this gives a clear statement about the distribution of the real process variables on the map and thus a distribution in the state space of the system.
- Fig. 6 shows the distribution of the feed water temperature (z-axis) over the map (x, y-axis)
- Fig. 7 shows the distribution of the coal feeder speed (z-axis) over the map (x, y-axis) .
- Step 5.2 By using the method for static visualization of weight differences (see previous chapter) for selected process variables there are correlations between these quantities and existing process states visualize that would not be recognizable if the complete weight distributions would be evaluated.
- Step 5.3 By means of a graphical extrapolation of the trajectory curve t u at a predeterminable time t o in a predeterminable time period ⁇ t along the reference curve t r to an expected process state at a second point in time t o + ⁇ t, future process values can be estimated by those belonging to the expected process state Process values are determined and output.
- Process step 6 automatic detection of process deviations
- the supervisor card thus realizes a further dimensional reduction is - as described - a sub-process of the process on the process map as a trajectory shown with m discrete trajectory positions on the supervisor card but this trajectory course becomes a single neuron, and thus summarized in a single point.
- the learning process According to Kohonen, neuron clusters are formed on the supervisor card, correspond to the similar trajectory sections on the process map.
- the trajectory section to be examined is on the process map - again from m discrete trajectory positions must exist - analyzed by the supervisor card and for similarity with compared previously learned trajectory sections.
- the similarity is shown in the Distance of the current winner neuron from the 'supervisor' neuron for the respective previously learned trajectory sections. This distance is therefore a measure of the similarity of two trajectory or partial trajectory courses.
- the diagnostic system recognizes automatically that the current trajectory course - e.g. a current one Can represent load changes - deviates from a previously learned reference curve.
- the system will then generate an error message and the cause of the trajectory deviation is automatically determined on the basis of method step 4, by calculating the causes for the respective trajectory deviations, through automatic analysis of the weight distribution of the underlying neurons.
- the advantage of the method described here is because you not only various process states to compare, but to record even complex and transient process operations such as complete on -or runs and automatically face can so that there is a powerful extension of current analysis systems for power plants.
- the process represents an automated diagnostic system for transient power plant processes.
- Another advantage of the process is the low engineering effort. There learning and structuring the maps and also recording the trajectories Automated and completely provided by the process, there is no need for time-consuming work Engineering of reference models. This engineering is more integral Part of the process itself.
Landscapes
- Engineering & Computer Science (AREA)
- Physics & Mathematics (AREA)
- Theoretical Computer Science (AREA)
- General Physics & Mathematics (AREA)
- General Health & Medical Sciences (AREA)
- General Engineering & Computer Science (AREA)
- Biophysics (AREA)
- Computational Linguistics (AREA)
- Data Mining & Analysis (AREA)
- Evolutionary Computation (AREA)
- Artificial Intelligence (AREA)
- Molecular Biology (AREA)
- Computing Systems (AREA)
- Biomedical Technology (AREA)
- Life Sciences & Earth Sciences (AREA)
- Mathematical Physics (AREA)
- Software Systems (AREA)
- Health & Medical Sciences (AREA)
- Automation & Control Theory (AREA)
- Testing And Monitoring For Control Systems (AREA)
- Management, Administration, Business Operations System, And Electronic Commerce (AREA)
Abstract
Description
- Fig. 1
- ein Strukturbild, das die wesentlichen Komponenten eines Systems zur Durchführung des Verfahrens zeigt,
- Fig. 2
- eine neuronale Karte für neun verschiedene Lastzustände eines Kessels,
- Fig. 3 und 4
- den Trajektorienverlauf beim Anfahren und Lastwechsels eines Kessels für zwei verschiedenen Vorgänge,
- Fig. 5
- die unterschiedliche Gewichtsverteilung zweier Neuronen auf der entfalteten Karte,
- Fig. 6 und 7
- die Prozeßgrößenverteilung zweier ausgewählter Prozeßgrößen über der Karte und
- Fig. 8
- den schematischen Aufbau eines automatischen Fehlererkennungssystems mit hierarchischen Kohonen-Karten.
Prinzipiell werden durch den Kohonen-Algorithmus die Gewichtsvektoren der Neuronen auf der Karte, unter Berücksichtigung ihrer Nachbarschaftsbeziehungen und des Eingangsvektors adaptiert.
In der Anwendungsphase wird das jeweils aktuelle Gewinnerneuron zum Zeitpunkt t0 z.B. durch einen schwarzen Kreis markiert (vgl. Fig. 2). Verbindet man diese Gewinnerneuronen miteinander, entwickelt sich auf der strukturierten Karte mit der Zeit t eine Trajektorie der aktuellen Prozeßzustände, die entweder ständig wächst oder bei fester vorgegebener Länge auf der Karte wandert.
Claims (11)
- Verfahren zur Analyse und Darstellung von Prozeßgrößen, Prozeßzuständen oder Folgen von Prozeßzuständen einer technischen Anlage, bei dem alle für einen Prozeß relevanten Größen zusammengefaßt und durch eine neuronale Analyse auf der Grundlage von Kohonen-Karten in Beziehung zueinander ausgewertet werden, indem eine topologieerhaltende Projektion von Daten der relevanten Prozeßgrößen auf eine zweidimensionale Kohonen-Karte realisiert wird.
- Verfahren nach Anspruch 1, dadurch gekennzeichnet, daß die technische Anlage eine Kraftwerksanlage oder ein Teil einer solchen Anlage ist.
- Verfahren nach einem der vorstehenden Ansprüche, dadurch gekennzeichnet, daß zur Beurteilung aktueller Folgen (tu) von Prozeßzuständen (z, z+1) auf einer zuvor statisch visualisierten zweidimensionalen Kohonen-Karte außerdem als Referenzverlauf (tr) erfaßte Folgen von Prozeßzuständen dargestellt werden.
- Verfahren nach Anspruch 3, dadurch gekennzeichnet, daß erfaßte Prozeßzustände (z, z+1) unterschiedliche Lastzustände sind.
- Verfahren nach einem der vorstehenden Ansprüche, dadurch gekennzeichnet, daß eine Trajektorie (tu, tr) von Prozeßvorgängen dargestellt wird durch eine graphische Verbindung von visualisierten Prozeßzuständen.
- Verfahren nach Anspruch 5, dadurch gekennzeichnet, daß mehrere Trajektorien übereinandergelegt dargestellt werden, wodurch ein Vergleich von Prozeßverläufen ermöglicht ist.
- Verfahren nach Anspruch 6, dadurch gekennzeichnet, daß durch folgende zusätzlichen Maßnahmen eine manuelle Prozeßanalyse ermöglicht wird, nachdem ein Benutzer die Kartenabschnitte mit der größten Abweichung (Abstand a) zweier Trajektorien ausgewählt hat:a) Berechnen der Standardabweichung der Gewichtsverteilung der selektierten Neuronen und Ausgabe der Gewichtsindizes mit den größten Abweichungen untereinander, undb) Ermitteln der den Gewichtsindizes der Neuronen zugrundeliegenden Prozeßgrößen, die die Trajektorienabweichungen auf der Karte am meisten verursachen.
- Verfahren nach Anspruch 6, dadurch gekennzeichnet, daß durch folgende zusätzlichen Maßnahmen eine automatisierte Diagnose durchgeführt wird:a) automatisiertes Erkennen der Abweichungen von zwei Trajektorienverläufen auf einer Prozeßkarte (K1) mit Hilfe einer Supervisorkarte (K2), indem on-line die zu untersuchenden Trajektorienabschnitte, bestehend aus einer vorgebbaren Anzahl (m) von Trajektorienpositionen, mit Referenzabschnitten verglichen werden und bei Abweichungen um einen vorgebbaren Wert die nachstehenden Schritte automatisiert ausgeführt werden,b) Berechnen der Standardabweichungen der Gewichtsverteilungen für die Neuronen, bei denen sich die Trajektorien um den vorgebbaren Wert unterscheiden und Ermitteln der Gewichtsindizes mit den größten Abweichungen untereinander, undc) Ermitteln der den Gewichtsindizes der Neuronen zugrundeliegenden Prozeßgrößen, die die Trajektorienabweichungen auf der Karte am meisten verursachen.
- Verfahren nach Anspruch 6, dadurch gekennzeichnet, daß durch folgende zusätzlichen Maßnahmen eine Prognose von Prozeßgrößen vorgenommen wird..a) graphische Extrapolation des Trajektorienverlaufes (tu) zu einem ersten Zeitpunkt (t0) in einem vorgebbaren Zeitabschnitt (Δt) zur Ermittlung eines zu einem zweiten Zeitpunkt (t0+Δt) zu erwartenden Prozeßzustandes, wobei die Extrapolation auf der Grundlage des weiteren Verlaufs der Referenztraktorie (tr) erfolgt,b) Ermitteln und Ausgeben der zum jeweiligen so prognostizierten Prozeßzustand gehörigen Prozeßgrößen und Prozeßwerte, undc) Bereitstellen der prognostizierten Prozeßwerte für ausgewählte Prozeßgrößen für nachgeschaltete Regel- und Steuerungssysteme.
- Verfahren nach Anspruch 1, dadurch gekennzeichnet, daß die Verteilung einer ausgewählten Prozeßgröße über der Kohonen-Karte höhen- oder farbcodiert dargestellt wird, indem die der Prozeßgröße entsprechende Gewichtsverteilung als Höhe oder Farbe über der Karte aufgetragen wird.
- Verfahren nach Anspruch 1, dadurch gekennzeichnet, daß die Verteilung mehrerer ausgewählter Prozeßgrößen über der Kohonen-Karte dargestellt wird, wobei die Gewichtsdifferenzen eines Neurons zu seinem Nachbarneuronen ausgewählter Prozeßgrößen ermittelt und farbcodiert dargestellt wird.
Applications Claiming Priority (2)
| Application Number | Priority Date | Filing Date | Title |
|---|---|---|---|
| DE19649633 | 1996-12-02 | ||
| DE19649633A DE19649633A1 (de) | 1996-12-02 | 1996-12-02 | Verfahren zur Analyse und Darstellung von transienten Prozeßvorgängen |
Publications (2)
| Publication Number | Publication Date |
|---|---|
| EP0845720A1 true EP0845720A1 (de) | 1998-06-03 |
| EP0845720B1 EP0845720B1 (de) | 1999-11-17 |
Family
ID=7813205
Family Applications (1)
| Application Number | Title | Priority Date | Filing Date |
|---|---|---|---|
| EP97120787A Expired - Lifetime EP0845720B1 (de) | 1996-12-02 | 1997-11-27 | Verfahren zur Analyse und Darstellung von transienten Prozessvorgängen |
Country Status (3)
| Country | Link |
|---|---|
| US (1) | US6321216B1 (de) |
| EP (1) | EP0845720B1 (de) |
| DE (2) | DE19649633A1 (de) |
Cited By (5)
| Publication number | Priority date | Publication date | Assignee | Title |
|---|---|---|---|---|
| ES2169009A1 (es) * | 2000-12-14 | 2002-06-16 | Alma Bioinformatics S L | Algoritmo auto-organizativo de datos de expresion genica |
| DE102008027605A1 (de) | 2008-06-10 | 2010-01-14 | Intelligement Ag | System und Verfahren zur rechnerbasierten Analyse großer Datenmengen |
| DE102008058016A1 (de) | 2008-11-19 | 2010-11-04 | Optiminig Gmbh | System und Verfahren zur rechnerbasierten Analyse großer Datenmengen |
| EP2696251A2 (de) | 2012-08-07 | 2014-02-12 | Prüftechnik Dieter Busch AG | Verfahren zum Überwachen von rotierenden Maschinen |
| CN107729985A (zh) * | 2016-08-11 | 2018-02-23 | 西门子公司 | 更好识别技术设施的过程异常的方法和相应的诊断系统 |
Families Citing this family (15)
| Publication number | Priority date | Publication date | Assignee | Title |
|---|---|---|---|---|
| US6785736B1 (en) * | 2000-09-12 | 2004-08-31 | International Business Machines Corporation | Method and system for optimizing the network path of mobile programs |
| US20020123996A1 (en) * | 2001-02-06 | 2002-09-05 | O'brien Christopher | Data mining system, method and apparatus for industrial applications |
| GB0505396D0 (en) * | 2005-03-16 | 2005-04-20 | Imp College Innovations Ltd | Spatio-temporal self organising map |
| US20060247798A1 (en) * | 2005-04-28 | 2006-11-02 | Subbu Rajesh V | Method and system for performing multi-objective predictive modeling, monitoring, and update for an asset |
| US7536364B2 (en) * | 2005-04-28 | 2009-05-19 | General Electric Company | Method and system for performing model-based multi-objective asset optimization and decision-making |
| JP4201012B2 (ja) * | 2006-04-06 | 2008-12-24 | ソニー株式会社 | データ処理装置、データ処理方法、およびプログラム |
| US20080161652A1 (en) * | 2006-12-28 | 2008-07-03 | Potts Steven J | Self-organizing maps in clinical diagnostics |
| US20080221395A1 (en) * | 2006-12-28 | 2008-09-11 | Potts Steven J | Self-organizing maps in clinical diagnostics |
| US8756180B2 (en) * | 2011-11-28 | 2014-06-17 | General Electric Company | Method and system for managing plant operation |
| US10229092B2 (en) | 2017-08-14 | 2019-03-12 | City University Of Hong Kong | Systems and methods for robust low-rank matrix approximation |
| JP7021052B2 (ja) * | 2018-11-06 | 2022-02-16 | 株式会社東芝 | 製品状態推定装置 |
| DE102019215016A1 (de) * | 2018-12-28 | 2020-07-02 | Robert Bosch Gmbh | Messanordnung, Verfahren zum Einrichten einer Messanordnung und Verfahren zum Betreiben einer Messanordnung |
| CN110320880B (zh) * | 2019-07-31 | 2021-03-02 | 翔创科技(北京)有限公司 | 一种牲畜屠宰线监控方法、装置及设备 |
| EP4060433A1 (de) * | 2021-03-19 | 2022-09-21 | Siemens Aktiengesellschaft | Verfahren und system zur prädiktion des betriebs einer technischen anlage |
| CN113344137B (zh) * | 2021-07-06 | 2022-07-19 | 电子科技大学成都学院 | 基于som的数据融合方法、装置、存储介质及电子设备 |
Citations (4)
| Publication number | Priority date | Publication date | Assignee | Title |
|---|---|---|---|---|
| JPH05130737A (ja) * | 1991-09-10 | 1993-05-25 | Toshiba Corp | 電力系統監視装置 |
| JPH0649515A (ja) * | 1992-08-05 | 1994-02-22 | Kobe Steel Ltd | 高炉炉熱制御装置 |
| US5448681A (en) * | 1992-03-27 | 1995-09-05 | National Semiconductor Corporation | Intelligent controller with neural network and reinforcement learning |
| WO1997014113A2 (de) * | 1995-10-13 | 1997-04-17 | Asoc Ag Associative Computing | Verfahren zum verarbeiten von daten auf einer semantischen ebene mittels 2d- oder 3d-visualisierung |
Family Cites Families (15)
| Publication number | Priority date | Publication date | Assignee | Title |
|---|---|---|---|---|
| CA2012702A1 (en) * | 1989-04-10 | 1990-10-10 | Peter Breitkopf | Multispectral remote sensing of minerals using neural networks |
| SE463338B (sv) * | 1989-06-14 | 1990-11-05 | Ludwik Liszka | Saett att oevervaka och/eller diagnosticera aktuella drifttillstaand hos komplicerade maskiner |
| US5222210A (en) * | 1990-12-03 | 1993-06-22 | Motorola, Inc. | Method of displaying the state of an artificial neural network |
| DE4132666A1 (de) * | 1991-10-01 | 1993-04-08 | Dieter Dr Vetterkind | Lernendes prozessnetz |
| DE4200260A1 (de) * | 1992-01-08 | 1993-07-22 | Dieter W Dr Ing Vetterkind | Prozess-evolutionsrechner |
| JPH05342191A (ja) * | 1992-06-08 | 1993-12-24 | Mitsubishi Electric Corp | 経済時系列データ予測及び解析システム |
| US5353207A (en) * | 1992-06-10 | 1994-10-04 | Pavilion Technologies, Inc. | Residual activation neural network |
| AU6358394A (en) * | 1993-03-02 | 1994-09-26 | Pavilion Technologies, Inc. | Method and apparatus for analyzing a neural network within desired operating parameter constraints |
| SE9304246L (sv) * | 1993-12-22 | 1995-06-23 | Asea Brown Boveri | Förfarande vid övervakning av multivariata processer |
| DE19518804A1 (de) * | 1994-05-27 | 1995-12-21 | Fraunhofer Ges Forschung | Verfahren zur Überwachung eines Produktionsprozesses |
| US5625751A (en) * | 1994-08-30 | 1997-04-29 | Electric Power Research Institute | Neural network for contingency ranking dynamic security indices for use under fault conditions in a power distribution system |
| US5602886A (en) * | 1995-10-10 | 1997-02-11 | The University Of Chicago | Neural net controlled tag gas sampling system for nuclear reactors |
| JPH1063634A (ja) * | 1996-04-05 | 1998-03-06 | Nec Corp | 時系列予測・分類のための方法及び装置 |
| US5809490A (en) * | 1996-05-03 | 1998-09-15 | Aspen Technology Inc. | Apparatus and method for selecting a working data set for model development |
| DE19637651A1 (de) * | 1996-09-16 | 1998-03-19 | Abb Patent Gmbh | Verfahren zur Prozeßvisualisierung |
-
1996
- 1996-12-02 DE DE19649633A patent/DE19649633A1/de not_active Withdrawn
-
1997
- 1997-11-27 DE DE59700716T patent/DE59700716D1/de not_active Expired - Lifetime
- 1997-11-27 EP EP97120787A patent/EP0845720B1/de not_active Expired - Lifetime
- 1997-12-02 US US08/982,613 patent/US6321216B1/en not_active Expired - Lifetime
Patent Citations (4)
| Publication number | Priority date | Publication date | Assignee | Title |
|---|---|---|---|---|
| JPH05130737A (ja) * | 1991-09-10 | 1993-05-25 | Toshiba Corp | 電力系統監視装置 |
| US5448681A (en) * | 1992-03-27 | 1995-09-05 | National Semiconductor Corporation | Intelligent controller with neural network and reinforcement learning |
| JPH0649515A (ja) * | 1992-08-05 | 1994-02-22 | Kobe Steel Ltd | 高炉炉熱制御装置 |
| WO1997014113A2 (de) * | 1995-10-13 | 1997-04-17 | Asoc Ag Associative Computing | Verfahren zum verarbeiten von daten auf einer semantischen ebene mittels 2d- oder 3d-visualisierung |
Non-Patent Citations (7)
| Title |
|---|
| HIROYUKI MORI ET AL: "AN ARTIFICIAL NEURAL-NET BASED TECHNIQUE FOR POWER SYSTEM DYNAMIC STABILITY WITH THE KOHONEN MODEL", 7 May 1991, PROCEEDINGS OF THE POWER INDUSTRY COMPUTER APPLICATION CONFERENCE, BALTIMORE, MAY 7 - 10, 1991, NR. CONF. 17, PAGE(S) 293 - 301, INSTITUTE OF ELECTRICAL AND ELECTRONICS ENGINEERS, XP000294083 * |
| KOHONEN T: "THE SELF-ORGANIZING MAP", 1 September 1990, PROCEEDINGS OF THE IEEE, VOL. 78, NR. 9, PAGE(S) 1464 - 1480, XP000165407 * |
| NIEBUR D ET AL: "POWER SYSTEM STATIC SECURITY ASSESSMENT USING THE KOHONEN NEURAL NETWORK CLASSIFIER", 7 May 1991, PROCEEDINGS OF THE POWER INDUSTRY COMPUTER APPLICATION CONFERENCE, BALTIMORE, MAY 7 - 10, 1991, NR. CONF. 17, PAGE(S) 270 - 277, INSTITUTE OF ELECTRICAL AND ELECTRONICS ENGINEERS, XP000294080 * |
| PATENT ABSTRACTS OF JAPAN vol. 017, no. 511 (E - 1432) 14 September 1993 (1993-09-14) * |
| PATENT ABSTRACTS OF JAPAN vol. 018, no. 285 (C - 1206) 31 May 1994 (1994-05-31) * |
| RITTER H ET AL: "KOHONEN'S SELF-ORGANIZING MAPS: EXPLORING THEIR COMPUTATIONAL CAPABILITIES", 24 July 1988, PROCEEDINGS OF THE INTERNATIONAL CONFERENCE ON NEURAL NETWORKS, SAN DIEGO, JULY 24 - 27, 1988, NR. 1988, PAGE(S) 109 - 116, INSTITUTE OF ELECTRICAL AND ELECTRONICS ENGINEERS, XP000014740 * |
| WHITTINGTON G ET AL: "AN EFFICIENT MULTIPROCESSOR MAPPING ALGORITHM FOR THE KOHONEN FEATURE MAP AND ITS DERIVATIVE MODELS", 27 June 1994, INTERNATIONAL CONFERENCE ON NEURAL NETWORKS/ WORLD CONGRESS ON COMPUTATIONAL INTELLIGENCE, ORLANDO, JUNE 27 - 29, 1994, VOL. 1, PAGE(S) 17 - 21, INSTITUTE OF ELECTRICAL AND ELECTRONICS ENGINEERS, XP000510384 * |
Cited By (8)
| Publication number | Priority date | Publication date | Assignee | Title |
|---|---|---|---|---|
| ES2169009A1 (es) * | 2000-12-14 | 2002-06-16 | Alma Bioinformatics S L | Algoritmo auto-organizativo de datos de expresion genica |
| WO2002048963A1 (es) * | 2000-12-14 | 2002-06-20 | Alma Bioinformatics, S.L. | Algoritmo auto-organizativo de datos de expresion genica |
| DE102008027605A1 (de) | 2008-06-10 | 2010-01-14 | Intelligement Ag | System und Verfahren zur rechnerbasierten Analyse großer Datenmengen |
| DE102008058016A1 (de) | 2008-11-19 | 2010-11-04 | Optiminig Gmbh | System und Verfahren zur rechnerbasierten Analyse großer Datenmengen |
| EP2696251A2 (de) | 2012-08-07 | 2014-02-12 | Prüftechnik Dieter Busch AG | Verfahren zum Überwachen von rotierenden Maschinen |
| DE102012015485A1 (de) | 2012-08-07 | 2014-05-15 | Prüftechnik Dieter Busch AG | Verfahren zum Überwachen von rotierenden Maschinen |
| CN107729985A (zh) * | 2016-08-11 | 2018-02-23 | 西门子公司 | 更好识别技术设施的过程异常的方法和相应的诊断系统 |
| CN107729985B (zh) * | 2016-08-11 | 2021-03-09 | 西门子公司 | 识别技术设施的过程异常的方法和相应的诊断系统 |
Also Published As
| Publication number | Publication date |
|---|---|
| EP0845720B1 (de) | 1999-11-17 |
| DE59700716D1 (de) | 1999-12-23 |
| US6321216B1 (en) | 2001-11-20 |
| DE19649633A1 (de) | 1998-06-04 |
Similar Documents
| Publication | Publication Date | Title |
|---|---|---|
| EP0845720B1 (de) | Verfahren zur Analyse und Darstellung von transienten Prozessvorgängen | |
| EP0789861B1 (de) | Verfahren zur analyse von prozessdaten einer technischen anlage | |
| DE3416939C2 (de) | ||
| WO2002010866A2 (de) | Verfahren zur ferndiagnose eines technologischen prozesses | |
| DE19734947B4 (de) | Verfahren zur Steuerung von Prozeßvorgängen | |
| WO2022069258A1 (de) | Vorrichtung und verfahren zur erkennung von anomalien in einer industriellen anlage zur ausführung eines produktionsprozesses | |
| EP3232282A1 (de) | Diagnoseeinrichtung und verfahren zur überwachung des be-triebs einer technischen anlage | |
| EP2881822A1 (de) | Computer-implementiertes Verfahren und System zur automatischen Überwachung und Statusermittlung ganzer Prozessabschnitte in einer Process Unit | |
| EP0875808A2 (de) | Verfahren und System zur Generierung eines Prozessmodells eines technischen Prozesses | |
| DE3786546T2 (de) | Verfahren zur berechnung eines normalvektors. | |
| EP0829809B1 (de) | Verfahren zur Prozessvisualisierung | |
| EP0838054B1 (de) | Verfahren und steuereinrichtung für eine graphische steuerung von abläufen in einem netzwerkmanagementsystem | |
| DE69118736T2 (de) | Operationskontrollapparat | |
| EP4268029B1 (de) | Verfahren und system zur überwachung des betriebs einer technischen anlage | |
| DE112019007889T5 (de) | Bearbeitungsprogramm-umwandlungseinrichtung, numerische-steuereinrichtung und bearbeitungsprogramm-umwandlungsverfahren | |
| AT522639B1 (de) | Vorrichtung und Verfahren zum Visualisieren oder Beurteilen eines Prozesszustandes | |
| EP1451689A2 (de) | Verfahren und system zur bearbeitung von fehlerhypothesen | |
| DE102022214233B3 (de) | Bestimmen einer Ähnlichkeit von Verkehrsszenen zur Verbesserung maschineller Lernsysteme bzw. Algorithmen zur Trajektorienprädiktion oder Manöverplanung für automatisierte Fahrzeuge | |
| DE19742906A1 (de) | Verfahren zum Optimieren von Produkten und Produktionsprozessen | |
| EP4060441A1 (de) | Verfahren und system zur erkennung von anomalien im betrieb einer technischen anlage | |
| EP2996001A1 (de) | Verfahren zur rechnergestützten Analyse eines Datensatzes aus Beobachtungen | |
| DE19748527A1 (de) | Verfahren zum Bilden eines Simulationsmodells für hydraulische oder elektrische Kreise | |
| EP4485348B1 (de) | Computer-implementiertes verfahren und werkzeug zur optischen qualitätskontrolle von zwischen- oder endprodukten von produktionsanlagen sowie produktionsanlagensteuerung | |
| DE69626964T2 (de) | Verfahren zur Steuerung eines Prozessablaufs nach von einem Rechner spezifizierten Verhalten | |
| DE102022212907A1 (de) | Computerimplementiertes Verfahren und Vorrichtung zur Vorhersage eines Zustandes eines technischen Systems |
Legal Events
| Date | Code | Title | Description |
|---|---|---|---|
| PUAI | Public reference made under article 153(3) epc to a published international application that has entered the european phase |
Free format text: ORIGINAL CODE: 0009012 |
|
| AK | Designated contracting states |
Kind code of ref document: A1 Designated state(s): DE FR GB |
|
| AX | Request for extension of the european patent |
Free format text: AL;LT;LV;MK;RO;SI |
|
| 17P | Request for examination filed |
Effective date: 19980713 |
|
| 17Q | First examination report despatched |
Effective date: 19981016 |
|
| AKX | Designation fees paid |
Free format text: DE FR GB |
|
| RBV | Designated contracting states (corrected) |
Designated state(s): DE FR GB |
|
| GRAG | Despatch of communication of intention to grant |
Free format text: ORIGINAL CODE: EPIDOS AGRA |
|
| GRAG | Despatch of communication of intention to grant |
Free format text: ORIGINAL CODE: EPIDOS AGRA |
|
| GRAH | Despatch of communication of intention to grant a patent |
Free format text: ORIGINAL CODE: EPIDOS IGRA |
|
| GRAH | Despatch of communication of intention to grant a patent |
Free format text: ORIGINAL CODE: EPIDOS IGRA |
|
| GRAA | (expected) grant |
Free format text: ORIGINAL CODE: 0009210 |
|
| AK | Designated contracting states |
Kind code of ref document: B1 Designated state(s): DE FR GB |
|
| REF | Corresponds to: |
Ref document number: 59700716 Country of ref document: DE Date of ref document: 19991223 |
|
| GBT | Gb: translation of ep patent filed (gb section 77(6)(a)/1977) |
Effective date: 19991206 |
|
| ET | Fr: translation filed | ||
| PLBE | No opposition filed within time limit |
Free format text: ORIGINAL CODE: 0009261 |
|
| STAA | Information on the status of an ep patent application or granted ep patent |
Free format text: STATUS: NO OPPOSITION FILED WITHIN TIME LIMIT |
|
| 26N | No opposition filed | ||
| REG | Reference to a national code |
Ref country code: GB Ref legal event code: IF02 |
|
| REG | Reference to a national code |
Ref country code: GB Ref legal event code: 732E |
|
| REG | Reference to a national code |
Ref country code: FR Ref legal event code: TP |
|
| REG | Reference to a national code |
Ref country code: DE Ref legal event code: R081 Ref document number: 59700716 Country of ref document: DE Owner name: TECDATA AG, CH Free format text: FORMER OWNER: OTTE, RALF, DR., 69469 WEINHEIM, DE Effective date: 20110823 |
|
| PGFP | Annual fee paid to national office [announced via postgrant information from national office to epo] |
Ref country code: GB Payment date: 20131122 Year of fee payment: 17 Ref country code: DE Payment date: 20131126 Year of fee payment: 17 Ref country code: FR Payment date: 20131119 Year of fee payment: 17 |
|
| REG | Reference to a national code |
Ref country code: DE Ref legal event code: R119 Ref document number: 59700716 Country of ref document: DE |
|
| GBPC | Gb: european patent ceased through non-payment of renewal fee |
Effective date: 20141127 |
|
| REG | Reference to a national code |
Ref country code: FR Ref legal event code: ST Effective date: 20150731 |
|
| PG25 | Lapsed in a contracting state [announced via postgrant information from national office to epo] |
Ref country code: GB Free format text: LAPSE BECAUSE OF NON-PAYMENT OF DUE FEES Effective date: 20141127 Ref country code: DE Free format text: LAPSE BECAUSE OF NON-PAYMENT OF DUE FEES Effective date: 20150602 |
|
| PG25 | Lapsed in a contracting state [announced via postgrant information from national office to epo] |
Ref country code: FR Free format text: LAPSE BECAUSE OF NON-PAYMENT OF DUE FEES Effective date: 20141201 |