EP0899569A2 - Analysegerät für Flüssigkeitschromatographie und Analysemethode für Flüssigkeitschromatographie - Google Patents
Analysegerät für Flüssigkeitschromatographie und Analysemethode für Flüssigkeitschromatographie Download PDFInfo
- Publication number
- EP0899569A2 EP0899569A2 EP98115912A EP98115912A EP0899569A2 EP 0899569 A2 EP0899569 A2 EP 0899569A2 EP 98115912 A EP98115912 A EP 98115912A EP 98115912 A EP98115912 A EP 98115912A EP 0899569 A2 EP0899569 A2 EP 0899569A2
- Authority
- EP
- European Patent Office
- Prior art keywords
- spectrum
- peak
- analysis apparatus
- liquid chromatographic
- chromatographic analysis
- Prior art date
- Legal status (The legal status is an assumption and is not a legal conclusion. Google has not performed a legal analysis and makes no representation as to the accuracy of the status listed.)
- Withdrawn
Links
Images


Classifications
-
- G—PHYSICS
- G01—MEASURING; TESTING
- G01N—INVESTIGATING OR ANALYSING MATERIALS BY DETERMINING THEIR CHEMICAL OR PHYSICAL PROPERTIES
- G01N30/00—Investigating or analysing materials by separation into components using adsorption, absorption or similar phenomena or using ion-exchange, e.g. chromatography or field flow fractionation
- G01N30/02—Column chromatography
- G01N30/86—Signal analysis
- G01N30/8624—Detection of slopes or peaks; baseline correction
-
- G—PHYSICS
- G01—MEASURING; TESTING
- G01N—INVESTIGATING OR ANALYSING MATERIALS BY DETERMINING THEIR CHEMICAL OR PHYSICAL PROPERTIES
- G01N30/00—Investigating or analysing materials by separation into components using adsorption, absorption or similar phenomena or using ion-exchange, e.g. chromatography or field flow fractionation
- G01N30/02—Column chromatography
- G01N30/62—Detectors specially adapted therefor
- G01N30/74—Optical detectors
-
- G—PHYSICS
- G01—MEASURING; TESTING
- G01N—INVESTIGATING OR ANALYSING MATERIALS BY DETERMINING THEIR CHEMICAL OR PHYSICAL PROPERTIES
- G01N30/00—Investigating or analysing materials by separation into components using adsorption, absorption or similar phenomena or using ion-exchange, e.g. chromatography or field flow fractionation
- G01N30/02—Column chromatography
- G01N30/80—Fraction collectors
- G01N30/82—Automatic means therefor
-
- G—PHYSICS
- G01—MEASURING; TESTING
- G01N—INVESTIGATING OR ANALYSING MATERIALS BY DETERMINING THEIR CHEMICAL OR PHYSICAL PROPERTIES
- G01N30/00—Investigating or analysing materials by separation into components using adsorption, absorption or similar phenomena or using ion-exchange, e.g. chromatography or field flow fractionation
- G01N30/02—Column chromatography
- G01N30/86—Signal analysis
- G01N30/8624—Detection of slopes or peaks; baseline correction
- G01N30/8631—Peaks
Definitions
- the present invention relates to a liquid chromatographic Analysis apparatus and a liquid chromatographic analyzing method.
- identification is performed by comparing a spectrum of each peak at a retention time in an actual sample with a spectrum in a spectrum library pre-storing spectrums of contained components in addition to the identifying method using the retention time described above to improve the accuracy of identifying the objective component.
- the above-mentioned conventional identification technology is effective only when analysis of the actual sample has been completed. Therefore, in a case where the analysis time is as very long as several hours, even if the peak of the objective component is detected just soon after starting the analysis of the actual sample, it is necessary to wait at least the remaining several hours until the analysis is completed in order to perform the identifying processing by comparing the result with the library data, which is inefficient.
- An object of the present invention is to provide a liquid chromatograph which is capable of rapidly performing identification, improving the identifying ability and easily confirming that the identification is certainly performed, and also to provide a liquid chromatograph which is capable of selectively acquiring an objective component out of an actual sample.
- the present invention is characterized by a liquid chromatograph comprising a means for analyzing a sample containing a single component or a plurality of mixed components and displaying the analysis result of the sample as a graph of a wave-shaped line of retention time versus signal strength; and a means for forming a spectrum datum at a retention time during generating a wave-form with peak on the graph of the wave-shaped line in a form of a graph and displaying the graph, which comprises a standard data library including retention times and spectrum data for a plurality of components, and identification processing is performed by comparing a spectrum of an objective component in the standard data library selected before starting an analysis or during performing the analysis with the spectrum at the time of generating the wave-form with peak.
- each similar degree of the spectrum of the objective component is calculated to each of the wave-forms with peak in the graph of the wave-shaped line, and to convert the similar degree into a numeral and display it by superposing the similar degree on the graph of the wave-shaped line.
- the liquid chromatograph comprises a means for setting a threshold in regard to signal intensities of the wave-forms with peak, and the means compares the wave-forms with peak within the range of the preset threshold with a selected datum in the standard data library.
- the liquid chromatograph comprises a means for setting a specified range in regard to the retention time, and the means compares the wave-forms with peak within the range of the set retention time with a selected datum in the standard data library.
- the comparisons of the selected datum in the standard data library with the data of the analysis result are performed during performing the analysis at the same time.
- the present invention is characterized by a liquid chromatograph comprising a means for analyzing a sample containing a single component or a plurality of mixed components and displaying the analysis result of the sample as a graph of a wave-shaped line of retention time versus signal strength; and a means for forming a spectrum datum at a retention time during generating a wave-form with peak on the graph of the wave-shaped line in a form of a graph and outputting the graph, which comprises a library storing spectrum data for a plurality of components; a means for selecting a spectrum of a component to be identified from the library before analyzing a sample; a means for identifying an objective component from the sample by successively comparing the spectrum data obtained by the analysis of the sample with the spectrum datum in the library; and a means for calculating a time when the wave-form with peak of the objective component reaches its peak top, and therein the selective acquisition unit is controlled based on the time when the wave-form with peak reaches its
- the present invention is characterized by a liquid chromatograph comprising a means for analyzing a sample containing a single component or a plurality of mixed components and displaying the analysis result of the sample as a graph of a wave-shaped line of retention time versus signal strength; and a means for forming a spectrum datum at a retention time during generating a wave-form with peak on the graph of the wave-shaped line in a form of a graph and outputting the graph, which comprises a library storing spectrum data for a plurality of components; a means for selecting a spectrum of a component to be identified out of the library before analyzing a sample; a means for identifying an objective component from the sample by successively comparing the spectrum data obtained by the analysis of the sample with the spectrum datum in the library; and a means for calculating a rise time and a fall time of the wave-form with peak of the objective component, and therein the selective acquisition unit is controlled based on the rise time and the fall time of the wave
- the present invention by selecting a spectrum of an objective component to be identified a spectrum of a known component out of the spectrum library in advance and providing the means for comparing the selected Spectrum with a spectrum of each of peaks, it is possible to reduce number of spectrum comparisons required for identification and to substantially shorten time for the identification. Further, by selecting the selected spectrum before analyzing and providing the means for comparing the spectrum of each of the peak in real time, it is possible to identify the objective component during analyzing the actual sample and not necessary to wait until the analysis is completed.
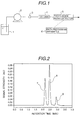
- FIG. 1 shows the basic construction of an example of a liquid chrmatograph system.
- the reference character 1 is an effluent and the reference character 2 is a pump, and the effluent 1 is transferred to a sample injecting unit indicated by the reference character 3 using the pump 3.
- a sample to be measured is injected by the sample injection unit 3 and is separated by a column indicated by the reference character 4.
- a photo-diode array detector indicated by the reference character 5 detects absorption spectrums of the effluent from the column continuously on a time axis (the detection is performed with a certain sampling interval, in the strict sense), and the data is transmitted to a data processing unit indicated by the reference character 6 having a spectrum library to perform identification of an objective component.
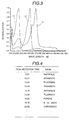
- FIG. 2 is an example of chromatograph of a detected result obtained from a case of injecting an actual sample containing three components of naphthale, anthrace and chrysene, and each of the wave-form peaks 7, 8 and 9 corresponds to a wave-form indicating any one of naphthale, anthrace and chrysene.
- a detected result commonly used is such a graph of wave-shaped line expressed by retention time versus signal strength, and output to and displayed on a display unit (not shown) such as a display unit in the data processing unit 6.
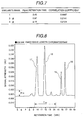
- FIG. 3 shows the spectrums at the peak top time of the respective wave-forms of the detected result of FIG. 2, and each of the spectrums 11, 12 and 13 is a spectrum datum obtained from the analysis of the actual sample at the retention time when each of the wave-form peaks 7, 8 and 9 is at its peak top, respectively.
- the identification is performed based on the spectrum data.
- FIG. 4 shows a part of a library stored in the data processing unit 6 which is obtained by using reference samples.
- the data of the library are formed by analyzing each of samples containing a single component as a reference sample, and detecting its peak retention time and its spectrum, and then classifying the results by each of the components as the reference datum.
- each of the peak retention times for each of the components is displayed together with each of the component names in the form of a table in the library as shown in FIG. 4.
- An operator operating the apparatus specifies an objective component to be identified out of this table of the library.
- spectrum data are registered in the library with corresponding to each of the components.
- FIG. 5 shows an aspect of superposing the spectrum datum in the library with the spectrum data of the detected result.
- the wave-form peak 10 is the spectrum of anthrace registered in the spectrum library contained in the data processing unit as a known component. According to FIG. 5, it can be understood that the spectrum 12 is most similar to the spectrum of anthrace, and consequently it can be estimated that the peak 8 in the graph expressed the analysis result using the retention time shown in FIG. 2 is the peak of anthrace to be identified.
- comparison of the spectrum 10 of anthrace in the library with the spectrum at each of the peak tops in the wave-form shown using the retention time is performed by calculating a numeral as a similar degree.
- FIG. 6 is a graph adding the identification result to the detected result shown in FIG. 2, and displayed on the displaying screen of the data processing unit 6 or the like as a result of the identification processing.
- the numeral 14 displayed near each of the peaks in FIG. 6 is the numeral which is converted from the similar degree, and is a correlation coefficient obtained by comparing the peak top spectrum of each of the peaks with the spectrum 10 of anthrace registered in the library. The correlation coefficient is calculated based on the following equation.
- a number indicating the rank of the similar degree of the spectrum as shown by the reference character 15 is displayed together with the correlation coefficient in order to be easily judged that the peak 8 having the first rank of the similar degree corresponds to anthrace. Further, by classifying the peaks by color corresponding to the similar degree, it is possible to easily judge by the sense of sight that the peak 8 corresponds to anthrace.
- number of comparisons of the spectrums required for identification is only three times corresponding to number of the detected peaks. Accordingly the identification time can be substantially shortened compared to the conventional identification technology in which number of comparisons required is the product of the total number of peaks and the total number of spectrums registered in the library. Further, if the spectrum of anthrace 10 of the objective component is selected before analyzing the actual sample, by successively comparing the spectrum of anthrace with the spectrum of each of the peaks in real time it is possible to identify the objective component of anthrace at the time when the peak 8 is detected without waiting until the time when the analysis is completed.
- FIG. 7 is an example of an output report of the identification result of anthrace.
- a range capable of making the identification with a certain reliability is set as a reference value and the peaks not reaching the reference value are marked with (#) in the column of the rank of similar degree.
- FIG. 8 shows an example of chromatograph obtained from a case of injecting an actual sample containing a plurality of components.
- FIG. 9 shows an example of spectrums at peak tops of the peaks 17, 18, 19 and 20 in FIG. 8, and the spectrums 21, 22, 23 and 24 correspond to the peaks 17, 18, 19 and 20, respectively.
- a threshold of peak height A TH and a range of retention time (a retention time range) T TH are preset before analyzing the sample or before performing comparison with the library.
- number of comparisons can be reduced and erroneous identification of very small peaks such as noise can be prevented because very small peaks below the threshold are excluded from peaks to be compared.
- Number of comparisons is further reduced because peaks outside the retention time range are also excluded from peaks to be compared.
- number of comparisons required for identifying the objective component is only twice.
- FIG. 10 shows an example of an output report of the identification result.
- a mark (?) is output and attached in the column of the rank of similar degree for a peak of which the height does not reach the preset threshold A TH .
- a mark (*) is output and attached in the column of the rank of similar degree for a peak of which the retention time is outside the preset range T TH.
- FIG. 11 shows the construction of an example of a system in which an objective component is selectively acquired.
- the reference character 25 indicates an effluent and the reference character 26 indicates a pump.
- a sample is injected from a sample injecting unit indicated by the reference character 27, and separated by a column indicated by the reference character 28.
- a photo-diode array detector indicated by the reference character 29 detects absorption spectrums of the effluent from the column continuously on a time axis (the detection is performed with a certain sampling interval, in the strict sense), and the data is transmitted to a data processing unit indicated by the reference character 30 having a spectrum library to perform identification of an objective component.
- the data processing unit When the objective component is identified by the data processing unit 30, the data processing unit performs processing for calculating a start time (rise time), a retention time and an end time (fall time) of the identified peak. These times are calculated in such a manner that in a wave-form datum expressed by retention time versus signal strength as shown in FIG. 2, the start time or the end time is determined by detecting a sampling data time point at which a difference between a signal strength at an identified retention time (the time when the wave-form with peak reaches a peak top) and a signal strength in the data sampled before or after the identified retention time becomes a certain value.
- the certain different value from the signal strength at the peak top point can be freely set, and accordingly sensitivity of detecting the wave-form with peak can be adjusted by adjusting the setting of the certain value.
- the data processing unit 30 outputs control signals for starting of selective acquisition and ending of selective acquisition to a selective acquisition unit indicated by the reference character 31 based on the start time, the retention time and the end time of the identified peak.
- the selective acquisition of the objective component can be performed.
- the timings of starting and ending of selective acquisition there are a method in which the timings are measured using the starting time and the ending time described above and a method in which arbitrary time periods are set before and after the retention time and the timings are measured using the time periods.
- identification of the objective component can be performed by the time when the sample reaches the selective acquisition unit 31 through the photo-diode array detector 29 and the process from analyzing the sample to selectively acquiring the objective component can be performed in real time without interrupting the work.
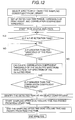
- FIG. 12 is a flow chart showing the processing for selectively acquiring an objective component out of an actual sample using the system of FIG. 11.
- a spectrum of an objective component to be selectively acquired is selected out of the library. An operator can easily perform this processing through the displayed screen from the data processing unit 30 as described previously.
- a range of retention time, a peak height and a value of correlation coefficient are set as thresholds.
- an actual sample is analyzed, and it is judged whether or not the analyzed result obtained in real time is within the range of retention time, above the threshold of peak height based on the preset thresholds. If the analyzed result is below the thresholds, judging processing of other data are successively repeated.
- the data processing unit 30 identifies the detected peak as the objective component, and after elapsing a dead volume time (the time until the sample reaches the selective acquisition unit 31 through the photo-diode array detector 29) from a peak start time (a starting time of the retention time of the peak of the objective component) the data processing unit 30 outputs a control signal to the selective acquisition unit so as to start selective acquisition.
- the data processing unit 30 outputs a control signal to the selective acquisition unit so as to end the selective acquisition.
- the correlation coefficient between the selected spectrum of the objective component and the spectrum at the peak top of the detected peak is calculated in addition to the range of retention time and the threshold of peak height described above and a threshold is also provided in the obtained correlation coefficient.
- the objective component can be selectively acquired out of the actual sample containing the plurality of mixed components even if the peak retention time of the objective component changes due to change in the measuring conditions such as the effluent, the column and so on. Furthermore, by controlling the selective acquisition unit so that selective acquisition is limited to be performed only a short time before and after the retention time of the peak of the objective component.
- the liquid chromatograph can perform identification speedy since number of comparisons required for identifying an objective component can be reduced and the identification can be performed even during analyzing. Further, load of the data processing unit for performing the identification processing can be also substantially reduced.
- the identification capability can be improved and number of the comparisons can be reduced by setting the various kinds of thresholds as the identification conditions.
- the selective acquisition work can be start at the time when the objective component is identified during analyzing but not after completion of all analysis and accordingly the series of work processes from analysis to selective acquisition can be performed once-through since the analyzing processing and the identifying processing can be performed at a time.
- the selective acquisition unit based on the identification result, only the objective component can be certainly selectively acquired even if the retention time is changed due to change in the measuring conditions.
Landscapes
- Physics & Mathematics (AREA)
- Health & Medical Sciences (AREA)
- Life Sciences & Earth Sciences (AREA)
- Chemical & Material Sciences (AREA)
- Analytical Chemistry (AREA)
- Biochemistry (AREA)
- General Health & Medical Sciences (AREA)
- General Physics & Mathematics (AREA)
- Immunology (AREA)
- Pathology (AREA)
- Investigating Or Analysing Materials By Optical Means (AREA)
Applications Claiming Priority (3)
| Application Number | Priority Date | Filing Date | Title |
|---|---|---|---|
| JP23211297 | 1997-08-28 | ||
| JP232112/97 | 1997-08-28 | ||
| JP9232112A JPH1172489A (ja) | 1997-08-28 | 1997-08-28 | 液体クロマトグラフ |
Publications (2)
| Publication Number | Publication Date |
|---|---|
| EP0899569A2 true EP0899569A2 (de) | 1999-03-03 |
| EP0899569A3 EP0899569A3 (de) | 1999-07-28 |
Family
ID=16934202
Family Applications (1)
| Application Number | Title | Priority Date | Filing Date |
|---|---|---|---|
| EP98115912A Withdrawn EP0899569A3 (de) | 1997-08-28 | 1998-08-24 | Analysegerät für Flüssigkeitschromatographie und Analysemethode für Flüssigkeitschromatographie |
Country Status (3)
| Country | Link |
|---|---|
| US (2) | US20020062683A1 (de) |
| EP (1) | EP0899569A3 (de) |
| JP (1) | JPH1172489A (de) |
Cited By (3)
| Publication number | Priority date | Publication date | Assignee | Title |
|---|---|---|---|---|
| WO2015140543A1 (en) * | 2014-03-17 | 2015-09-24 | Q Analytica Llc | Profiling apparatus and method |
| CN107850567A (zh) * | 2015-07-01 | 2018-03-27 | 株式会社岛津制作所 | 数据处理装置 |
| CN109196354A (zh) * | 2016-05-30 | 2019-01-11 | 株式会社岛津制作所 | 色谱装置 |
Families Citing this family (9)
| Publication number | Priority date | Publication date | Assignee | Title |
|---|---|---|---|---|
| UA78194C2 (en) * | 2000-12-08 | 2007-03-15 | Council Scient Ind Res | Method for revealing and identification of active components in extracts by chromatographic fingerprinting of "fingerprints" and processor of program data processing chromatograms |
| US20060025932A1 (en) * | 2001-02-08 | 2006-02-02 | Dadala Vijaya K | Novel method for chromatographic finger printing and standardization of single medicines and formulations |
| EP1544612A1 (de) * | 2003-12-09 | 2005-06-22 | Agilent Technologies, Inc. | Chromatographisches System und Verfahren zur Operation desselben |
| JP2006058110A (ja) * | 2004-08-19 | 2006-03-02 | Shimadzu Corp | クロマトグラフ用データ処理装置 |
| JP2008122081A (ja) * | 2006-11-08 | 2008-05-29 | Dkk Toa Corp | 分析計及び分析プログラム |
| TWI355491B (en) * | 2007-12-07 | 2012-01-01 | Anchor Res & Consultation Co Ltd | Method for ingredient analysis |
| CN108508122B (zh) * | 2013-09-02 | 2020-07-14 | 株式会社岛津制作所 | 色谱仪用数据处理装置 |
| JP7012998B2 (ja) * | 2017-09-21 | 2022-01-31 | 株式会社日立ハイテクサイエンス | クロマトグラフのデータ処理装置 |
| JP2022123952A (ja) * | 2021-02-15 | 2022-08-25 | 株式会社島津製作所 | 液体クロマトグラフ |
Family Cites Families (3)
| Publication number | Priority date | Publication date | Assignee | Title |
|---|---|---|---|---|
| JPS6371651A (ja) * | 1986-09-16 | 1988-04-01 | Hitachi Ltd | クロマトグラム同定方法 |
| DE69013137T2 (de) * | 1990-01-18 | 1995-03-02 | Hewlett Packard Co | Verfahren zur Unterscheidung von Mischungen chemischer Verbindungen. |
| US5352585A (en) * | 1993-06-29 | 1994-10-04 | Bio-Rad Laboratories, Inc. | System for benzodiazepine detection |
-
1997
- 1997-08-28 JP JP9232112A patent/JPH1172489A/ja active Pending
-
1998
- 1998-08-24 EP EP98115912A patent/EP0899569A3/de not_active Withdrawn
-
2001
- 2001-12-10 US US10/006,892 patent/US20020062683A1/en not_active Abandoned
-
2003
- 2003-02-10 US US10/360,640 patent/US20030115937A1/en not_active Abandoned
Cited By (5)
| Publication number | Priority date | Publication date | Assignee | Title |
|---|---|---|---|---|
| WO2015140543A1 (en) * | 2014-03-17 | 2015-09-24 | Q Analytica Llc | Profiling apparatus and method |
| CN107850567A (zh) * | 2015-07-01 | 2018-03-27 | 株式会社岛津制作所 | 数据处理装置 |
| US11222773B2 (en) | 2015-07-01 | 2022-01-11 | Shimadzu Corporation | Data processing device |
| US11776799B2 (en) | 2015-07-01 | 2023-10-03 | Shimadzu Corporation | Data processing device |
| CN109196354A (zh) * | 2016-05-30 | 2019-01-11 | 株式会社岛津制作所 | 色谱装置 |
Also Published As
| Publication number | Publication date |
|---|---|
| US20020062683A1 (en) | 2002-05-30 |
| JPH1172489A (ja) | 1999-03-16 |
| EP0899569A3 (de) | 1999-07-28 |
| US20030115937A1 (en) | 2003-06-26 |
Similar Documents
| Publication | Publication Date | Title |
|---|---|---|
| US6002986A (en) | Fraction purity measuring apparatus for chromatogram peak | |
| EP0899569A2 (de) | Analysegerät für Flüssigkeitschromatographie und Analysemethode für Flüssigkeitschromatographie | |
| EP3540425B1 (de) | Datenanalysevorrichtung für chromatographie-massenspektrometrie | |
| US11567047B2 (en) | Chromatographic data system processing apparatus | |
| JPS60239669A (ja) | クロマトグラフイ−におけるデ−タ処理方法 | |
| US10935526B2 (en) | Liquid chromatograph and method for correcting detector output value fluctuation of liquid chromatograph | |
| JP5962775B2 (ja) | クロマトグラフ質量分析用データ処理装置 | |
| US20170356889A1 (en) | Three-dimensional spectral data processing device and processing method | |
| US11061006B2 (en) | Chromatograph-mass spectrometry system and measurement condition display method | |
| US10481138B2 (en) | Chromatogram data processing device and processing method | |
| JP2010181350A (ja) | クロマトグラフ用データ処理装置 | |
| JP2021148776A (ja) | ピーク解析方法及び波形処理装置 | |
| JP5315025B2 (ja) | スペクトル解析および表示 | |
| JP2005221276A (ja) | クロマトグラフ質量分析用データ処理装置 | |
| JP4057664B2 (ja) | クロマトグラフ/質量分析装置のデータ処理装置 | |
| US9823228B2 (en) | Chromatograph mass spectrometer and control method therefor | |
| JP2666838B2 (ja) | ガスクロマトグラフイ質量分析計を用いた定量分析方法 | |
| JPH04184166A (ja) | クロマトグラムピークの成分純度測定装置 | |
| JP2568311B2 (ja) | クロマトグラフによる定量分析方法および装置 | |
| JP3082571B2 (ja) | 信号処理装置 | |
| WO2018158801A1 (ja) | スペクトルデータの特徴抽出装置および方法 | |
| JP7012989B2 (ja) | 液体クロマトグラフおよび液体クロマトグラフの検出器出力値変動補正手段 | |
| JPH11344482A (ja) | 質量分析システム | |
| JPH09269319A (ja) | 定量分析用データ処理装置 | |
| JP2879782B2 (ja) | 多波長検出器のデータ処理装置 |
Legal Events
| Date | Code | Title | Description |
|---|---|---|---|
| PUAI | Public reference made under article 153(3) epc to a published international application that has entered the european phase |
Free format text: ORIGINAL CODE: 0009012 |
|
| 17P | Request for examination filed |
Effective date: 19980824 |
|
| AK | Designated contracting states |
Kind code of ref document: A2 Designated state(s): DE FR GB |
|
| AX | Request for extension of the european patent |
Free format text: AL;LT;LV;MK;RO;SI |
|
| PUAL | Search report despatched |
Free format text: ORIGINAL CODE: 0009013 |
|
| AK | Designated contracting states |
Kind code of ref document: A3 Designated state(s): AT BE CH CY DE DK ES FI FR GB GR IE IT LI LU MC NL PT SE |
|
| AX | Request for extension of the european patent |
Free format text: AL;LT;LV;MK;RO;SI |
|
| AKX | Designation fees paid |
Free format text: DE FR GB |
|
| STAA | Information on the status of an ep patent application or granted ep patent |
Free format text: STATUS: THE APPLICATION IS DEEMED TO BE WITHDRAWN |
|
| 18D | Application deemed to be withdrawn |
Effective date: 20040302 |