EP0907883B1 - Verfahren und vorrichtung zur fernkonzentrationsmessung von gasspuren - Google Patents
Verfahren und vorrichtung zur fernkonzentrationsmessung von gasspuren Download PDFInfo
- Publication number
- EP0907883B1 EP0907883B1 EP98923303A EP98923303A EP0907883B1 EP 0907883 B1 EP0907883 B1 EP 0907883B1 EP 98923303 A EP98923303 A EP 98923303A EP 98923303 A EP98923303 A EP 98923303A EP 0907883 B1 EP0907883 B1 EP 0907883B1
- Authority
- EP
- European Patent Office
- Prior art keywords
- information
- gas plume
- plume
- contrast
- background
- Prior art date
- Legal status (The legal status is an assumption and is not a legal conclusion. Google has not performed a legal analysis and makes no representation as to the accuracy of the status listed.)
- Expired - Lifetime
Links
- 239000007789 gas Substances 0.000 title claims description 92
- 238000000034 method Methods 0.000 title claims description 52
- 238000001228 spectrum Methods 0.000 claims description 53
- 230000003595 spectral effect Effects 0.000 claims description 26
- 238000001914 filtration Methods 0.000 claims description 17
- 230000005540 biological transmission Effects 0.000 claims description 6
- 238000012886 linear function Methods 0.000 claims description 5
- 238000004458 analytical method Methods 0.000 claims description 4
- 230000001629 suppression Effects 0.000 claims description 4
- 238000007405 data analysis Methods 0.000 claims description 2
- 239000000945 filler Substances 0.000 claims 1
- 238000005259 measurement Methods 0.000 description 12
- 230000006870 function Effects 0.000 description 9
- 239000013598 vector Substances 0.000 description 8
- 101000844800 Lactiplantibacillus plantarum (strain ATCC BAA-793 / NCIMB 8826 / WCFS1) D-alanyl carrier protein 1 Proteins 0.000 description 7
- 238000004088 simulation Methods 0.000 description 5
- 239000000779 smoke Substances 0.000 description 5
- 101000844801 Lactiplantibacillus plantarum (strain ATCC BAA-793 / NCIMB 8826 / WCFS1) D-alanyl carrier protein 2 Proteins 0.000 description 4
- 238000010521 absorption reaction Methods 0.000 description 4
- 230000003190 augmentative effect Effects 0.000 description 4
- 238000001739 density measurement Methods 0.000 description 4
- 230000008901 benefit Effects 0.000 description 3
- 230000010354 integration Effects 0.000 description 3
- 238000000691 measurement method Methods 0.000 description 3
- 238000000862 absorption spectrum Methods 0.000 description 2
- 238000000354 decomposition reaction Methods 0.000 description 2
- 238000001514 detection method Methods 0.000 description 2
- 238000000295 emission spectrum Methods 0.000 description 2
- 239000011159 matrix material Substances 0.000 description 2
- 238000012544 monitoring process Methods 0.000 description 2
- 230000005855 radiation Effects 0.000 description 2
- 230000002123 temporal effect Effects 0.000 description 2
- 238000013459 approach Methods 0.000 description 1
- 238000003491 array Methods 0.000 description 1
- 238000005284 basis set Methods 0.000 description 1
- 230000033228 biological regulation Effects 0.000 description 1
- 230000002596 correlated effect Effects 0.000 description 1
- 238000005314 correlation function Methods 0.000 description 1
- 230000008878 coupling Effects 0.000 description 1
- 238000010168 coupling process Methods 0.000 description 1
- 238000005859 coupling reaction Methods 0.000 description 1
- 230000003247 decreasing effect Effects 0.000 description 1
- 238000010586 diagram Methods 0.000 description 1
- 230000009977 dual effect Effects 0.000 description 1
- 230000007613 environmental effect Effects 0.000 description 1
- 238000000605 extraction Methods 0.000 description 1
- 238000009472 formulation Methods 0.000 description 1
- 238000005286 illumination Methods 0.000 description 1
- 239000000203 mixture Substances 0.000 description 1
- 238000010606 normalization Methods 0.000 description 1
- 230000003287 optical effect Effects 0.000 description 1
- 238000004886 process control Methods 0.000 description 1
- 238000012545 processing Methods 0.000 description 1
- 238000011002 quantification Methods 0.000 description 1
- 230000009897 systematic effect Effects 0.000 description 1
- 238000012360 testing method Methods 0.000 description 1
- 238000002834 transmittance Methods 0.000 description 1
Images


Classifications
-
- G—PHYSICS
- G01—MEASURING; TESTING
- G01N—INVESTIGATING OR ANALYSING MATERIALS BY DETERMINING THEIR CHEMICAL OR PHYSICAL PROPERTIES
- G01N21/00—Investigating or analysing materials by the use of optical means, i.e. using sub-millimetre waves, infrared, visible or ultraviolet light
- G01N21/17—Systems in which incident light is modified in accordance with the properties of the material investigated
- G01N21/25—Colour; Spectral properties, i.e. comparison of effect of material on the light at two or more different wavelengths or wavelength bands
- G01N21/31—Investigating relative effect of material at wavelengths characteristic of specific elements or molecules, e.g. atomic absorption spectrometry
- G01N21/35—Investigating relative effect of material at wavelengths characteristic of specific elements or molecules, e.g. atomic absorption spectrometry using infrared light
- G01N21/3504—Investigating relative effect of material at wavelengths characteristic of specific elements or molecules, e.g. atomic absorption spectrometry using infrared light for analysing gases, e.g. multi-gas analysis
- G01N21/3518—Devices using gas filter correlation techniques; Devices using gas pressure modulation techniques
-
- G—PHYSICS
- G01—MEASURING; TESTING
- G01N—INVESTIGATING OR ANALYSING MATERIALS BY DETERMINING THEIR CHEMICAL OR PHYSICAL PROPERTIES
- G01N21/00—Investigating or analysing materials by the use of optical means, i.e. using sub-millimetre waves, infrared, visible or ultraviolet light
- G01N21/17—Systems in which incident light is modified in accordance with the properties of the material investigated
- G01N21/25—Colour; Spectral properties, i.e. comparison of effect of material on the light at two or more different wavelengths or wavelength bands
- G01N21/31—Investigating relative effect of material at wavelengths characteristic of specific elements or molecules, e.g. atomic absorption spectrometry
- G01N21/35—Investigating relative effect of material at wavelengths characteristic of specific elements or molecules, e.g. atomic absorption spectrometry using infrared light
- G01N21/3504—Investigating relative effect of material at wavelengths characteristic of specific elements or molecules, e.g. atomic absorption spectrometry using infrared light for analysing gases, e.g. multi-gas analysis
Definitions
- the present invention relates to digital filters, and more specifically to a method for detecting and monitoring atmospheric gases, such as gases emitted from smoke stacks or tail pipes, through use of a gas sensor and a digital filter constructed to correlate only with the spectrum of the gas of interest to yield the density of the gas.
- atmospheric gases such as gases emitted from smoke stacks or tail pipes
- the detection and measurement of trace gases is often essential in order to adhere to environmental standards and regulations, or process control standards.
- the sensors may be as close to an emissions source as the base of a smoke stack, or as far away as on an orbiting satellite.
- spectral signal of interest associated with the trace gas is typically a small part of the overall signal measured by the sensor. It is often difficult for a basic correlation filter to detect this small target signal unless the background component of the measured spectrum is removed.
- Two spectrum differencing involves measuring a scene and subtracting the background spectrum from the target spectrum.
- the two pixel differencing does not eliminate spectrally correlated background features in a target spectrum, therefore leading to large errors in gas amount quantification, and leaving a large residual which masks the desired signal.
- a second technique known as model matching, takes a spectral measurement and generates a complex numerical model of the spectrum. The technique then adjusts model parameters until a spectral match is found.
- model matching techniques typically require long, complex computer runs that require a large amount of operator involvement to adjust the model parameters.
- a third known technique is known as an orthogonal background suppression (OBS) technique as for example disclosed in the paper A. Hayden et al. "Determination of trace-gas amounts in plumes by the use of orthogonal digital filtering of thermal-emission spectra", Applied Optics, vol. 35, no. 16, 1 June 1996, pages 2802-2809 .
- OBS techniques are used to measure the column density/thermal radiance contrast product of a gas plume using a passive thermal/infrared emission spectrometer. Column density refers to the number of molecules per unit area seen by the sensor, while thermal radiance contrast is the difference between the radiance of the scene behind a plume, and a Planck function generated with the temperature of the plume.
- Such a technique facilitates target signal detection in the presence of low signal to spectral clutter ratio.
- OBS techniques are based upon the assumption that background spectral clutter can be assumed to be a linear combination of background spectra taken with no target gas in the field of view.
- Such a technique finds the proper combination of background scene components and removes the components completely from the target spectrum, thereby leaving only the spectrum of the gas of interest, along with associated random noise.
- OBS technique One advantage of the OBS technique is that an optimal linear filter associated with the technique is able to suppress a large background component of a measurement, while yielding the column density thermal radiance contrast product (DCP) of a gas plume in the atmosphere.
- DCP column density thermal radiance contrast product
- present OBS techniques exhibit certain desirable results, the techniques are limited in effectiveness in that the techniques cannot separate column density measurement from the thermal radiance contrast measurement.
- Orthogonal linear components of background clutter are found by the application of singular value decomposition (SVD) to a set of background spectra. These components are then removed from a target-plus-background spectrum, leaving as a residual only instrument noise and the spectral signature of interest.
- SVD singular value decomposition
- EP 0 604 124 A2 is directed at multispectral signature extraction techniques which are utilized to separate a multispectral electro-optical signal of interest from a background. It is proposed to employ a spectrometer which results the optical spectrum from optics into a multispectral input spectrum.
- a multispectral spectrum is understood as a signal having a plurality of bands of radiation. In order to function each channel assigned to a band of radiation must comprise a matched filter using a spectral template.
- N-1 channnels include a known spectral template of a respective one of N-1 targets and the Nth channel includes a known spectral template of the background.
- US 5,528,037 discloses a band analysis system for determining the optimal signal-to-noise ratio between the spectral emissions from an object of interest and the spectral emissions from background noise for a target detecting and tracking system.
- Known target and background spectra are applied to a band select system in order to select an initial choice of bands. These bands are then applied to a sensor model system which determines a template for each spectrum.
- the templates are applied to a noise generation system in order to generate a noise function indicative of the vibrational noise of the sensor and the electronic noise of the system.
- the noise function also includes a function of the integration time over each band.
- the noise function and the templates are then used to determine a signal-to-noise ratio based on a weighting function.
- the signal-to-noise ratio is applied to the band select system and the integration time select system in order to adjust the bands and their integrations time to the optimum value.
- US 5,371,542 is directed at a dual waveband signal processing system (DWSPS) for differentiating between any primary target signal and background clutter to detect targets and objects with a particularly unique spectral characteristic.
- the DWSPS is responsive to a plurality of sensors operating on different wavelengths.
- the output wavebands of the sensors are filtered by either spatial or temporal high-pass filters, and is processed through a network comprising a series of multiplies, dividers, comparators, and subtractors to obtain the weighted correlation functions or "alpha coefficient", which, when compared to the input wavebands, produces a filtered or processed output signal of the detected features.
- US 4,320,975 discloses a smoke opacity monitor which obtains a measurement of opacity by measuring the proportion of polarized light from the background sky which is detectable through the smoke plume. Compensation and normalization is provided to minimize errors generated by illumination of the plume itself and for the overall intensity of the background sky light.
- US 3,931,462 is directed at a method and apparatus for measuring, at a remote location, the concentration and velocity of SO 2 in plume from a smokestack.
- An ultraviolet video system views the plume against the background sky at wavelengths where SO 2 molecules absorb light. The result is a real time display of the plume coupled with means for measuring the SO 2 concentration at any point in the plume and at any time desired.
- means are provided in combination with the ultraviolet video system for measuring the velocity of the SO 2 in the plume.
- the solution to this object is provided by the method according to claim 1 and by the system according to claim 9.
- the present invention provides an improved OBS based technique that monitors gas emissions from smoke stacks, tail pipes, and other sources, and that separates gas column density from thermal radiance contrast.
- the technique of the present invention utilizes a software generated digital filter constructed to correlate with only the spectrum of gas of interest, and have zero correlation with background components.
- the present invention provides a method of measuring trace gases in a gas plume.
- the method comprises the steps of : detecting a target scene including gas plume information and background information; filtering the background information from the gas plume information to yield a density contrast product including both gas plume column density and gas plume thermal radiance contrast values; filtering the gas plume thermal radiance contrast value from the density contrast product to yield a gas plume column density estimate; and outputting the gas plume column density estimate for gas plume anlysis purposes.
- the present invention provides a system for measuring column density of a plume of gas.
- the system provides a sensor that measures target pixel information including background and gas plume information.
- a processor is connected to the sensor to store and process the target pixel information, and filter the background information from the target pixel information to yield a gas plume column density/thermal radiance contrast product.
- the processor also filters the gas plume column density/thermal radiance contrast product to separate the thermal radiance contrast from the gas plume column density to yield gas plume column density information.
- An output associated with the processor outputs the gas plume column density information from the processor for data analysis purposes.
- an OBS measurement system 10 measuring a gas plume 12 emitted from a smokestack 14.
- the system 10 is installed in an airplane 16 for maintaining purposes so that a system sensor 20 is above the plume 12 looking down through it to the ground.
- the sensor 20 views the ground through intervening atmosphere 22 and through the plume 12.
- a background pixel not shown
- the sensor views ground through intervening atmosphere only.
- the simulations and data discussed below are based on this geometry; however, it should be appreciated that the system may be implemented along a wide range of distances from the plume without affecting system results.
- FIG. 2 illustrates a preferred embodiment of the OBS system 10.
- the system 10 is a conventional personal computer having an Intel ® Pentium ® 486 or higher processor.
- the system includes a processor 22 and associated power source 23 connected to the sensor 20.
- the processor 22 processes target pixel information measured by the sensor in accordance with the OBS technique of the present invention.
- the sensor shown is a JPL Airborne Emission Spectrometer.
- ground based sensors such as the Hughea Mobile FTS ground spectrometer, may also be used.
- the OBS technique of the present invention is programmed into a computer memory 24 using conventional programming language such as C ++ , and generates digital filters 28, 30 based on pixel information measured by the sensor.
- the digital filters produce a plume column density measurement that is separable from the plume radiance contrast, and output through system output 32 for plume analysis purposes.
- the measured radiance in a target scene, or pixel, measured by the sensor 20 can be expressed as a sum of: background radiance transmitted through the atmosphere, background radiance transmitted through the plume and through the atmosphere, plume radiance transmitter through the atmosphere, and atmospheric radiance (Equation 1).
- N i g 1 - f ⁇ N i g ⁇ ⁇ i ⁇ background not propogated through plume + f ⁇ N i g ⁇ e - n c ⁇ ⁇ i ⁇ ⁇ i ⁇ background propogated through plume + f ⁇ 1 - e - n c ⁇ ⁇ i ⁇ B i T p ⁇ ⁇ i ⁇ plume radiance + N i ⁇ atmospheric radiance
- N i t is the measured target radiance
- f is the fraction of the pixel filled by the plume
- N i g is the radiance of the scene behind the plume
- t i a is the transmission of the atmosphere between the plume and the sensor
- n c is the column density
- ⁇ i is the absorption cross section of the molecule interest
- B is the Plank function
- T p is the plume temperature
- N i a is the radiance of the atmosphere between the plume and the sensor.
- the subscript "i" indicates the quantifies are arrays of values at varying wavenumber.
- Equation 3 Equation 5.
- a conventional OBS technique assumes that the background components of the target signal, represented by the last two terms in equations 3 and 5, can be expressed as a linear combination of a set of measured background pixels. The following paragraphs describe how the correct linear combination of backgrounds is found.
- a set of basis vectors spanning the set of measured background spectra can be constructed using singular value decomposition (SVD) of the set of measured background spectra (Equation 6).
- S singular value decomposition
- B is the set of background spectra expressed as an array of vectors
- U are the principal spectral components of the background set as found by SVD.
- ⁇ is the set of singular values describing the weights of the principal components.
- V is a "rotation matrix" describing how much of each principal component is in each background spectrum.
- the number of background spectra measured was fewer that the number of wavenumber, samples in a spectrum. This does not lead to an under-constrained problem, however. It has been determined that for a wide variety of scenarios the number of non-noise basis vectors in the spanning set is fewer than the number of background spectra in the measured background set. SVD is able to separate random noise degrees of freedom from actual scene spectral clutter components.
- Equation 5 The OBS assumption, that the background radiance in a target pixel is a linear sum of measured background spectra, means that Equation 5 can be rewritten as Equation 7.
- N t fn c ⁇ ⁇ a ⁇ ⁇ b + Uc
- Equation 5 Where the background terms of Equation 5 have been replaced by the linear sum of principal components, which are in turn a linear sum of the background spectra.
- the coefficient array ⁇ are the weights of the principal components describing the background in the target pixel.
- the orthonormality of U is used to find ⁇ and remove background components from the target spectrum.
- the digital filter 28 can be constructed (Equation 8) such that its normalized dot product with N t yielded the n c ⁇ b product (Equation 9).
- the superscript T indicates vector or matrix transpose .
- the atmospheric transmission, ⁇ a used in constructing the filter in Equation 8, is an estimate based on knowledge of the atmospheric conditions during the measurements and is generated using the commercially available programming language FASCODE .
- the OBS technique of the present invention is able to separate n c and ⁇ b by using higher order terms in exponent expansion.
- Equation 11 modelling ⁇ b as a linear function of wavenumber (Equation 11) allowed more accurate estimation of n c .
- ⁇ ⁇ b i ⁇ ⁇ b ⁇ + v - v i ⁇ b
- Equation 11 ⁇ b , ⁇ , b are constants and v i is the i th wavenumber.
- the average thermal radiance contrast term, ⁇ b is the thermal contrast constant of original OBS.
- Equation 5 By analogy to Equation 8 and 9, it would be desirable to create the filter 30 so that when applied to Equation 12 yields the coefficient of a particular ⁇ i .
- an augmented background B' needs to be constructed (see Equation 5) so that the basis set of vectors (U') spanning B' includes principal background components (U) as well as ( ⁇ j ⁇ a ), and (v ⁇ j ⁇ a ) terms. Note that j ⁇ i.
- Equation 13 The filter (Equation 13) applied to Equation 12, yields Equation 14.
- Equation 13 The filter (Equation 13) applied to Equation 12, yields Equation 14.
- fl c is a biased estimator for n c for at least two reasons:
- NE DCP ⁇ 1 NESR ⁇ a ⁇ T ⁇ a 1 2
- NE DCP ⁇ 2 NESR ⁇ 2 ⁇ ⁇ ⁇ a ⁇ T ⁇ 2 ⁇ ⁇ ⁇ a 1 2
- the thermal radiance contrast can be estimated using DCP 1 and DCP 2 in a fashion similar to n c determination (Equation 24).
- ⁇ b ⁇ - DCP 1 2 2 ⁇ f ⁇ ⁇ DCP 2 where f is an estimate of the plume fill factor.
- Equation 25 can then be solved for T p , (Equation 26).
- B u is the value of Planck's function at the spectral window's average wavelength
- N ⁇ i g ⁇ is the estimated average background radiance in the target pixel
- c 1 and c 2 are the coefficients of Planck's equation.
- Figure 3 shows a simulated SO 2 plume spectrum at 40.
- the OBS technique of the present invention is used to extract n c of SO 2 in this spectrum.
- the simulated SO 2 plume spectrum 40 is simulated downlooking from 4.5km and includes: ground radiance, plume radiance and transmission atmospheric radiance and transmission, and white noise.
- Table 1 n c of SO 2 1x10 19 molecule/cm -2 T p 305K T g 295K ground emissivity 1 fill factor 1 atmosphere model mid-latitude winter sensor altitude 4.5 km (nadir view) NESR 1x10 -7 w/cm 2 sr cm -1
- the peak target signal to NESR ratio in the target pixel is 10.
- the peak target signal to scene clutter ratio is 1/7.
- FIG. 4 shows the molecular absorption cross-section of SO 2 used to construct the SO 2 filter at 42. Note that visually the SO 2 features are almost completely obscured by the spectral clutter in the target spectrum.
- FIG. 5 shows filter results for the simulated SO 2 plume at 44.
- the x-axis is number of ⁇ i terms added to the augmented background set B'. For example, if the number of ⁇ i terms indicated is 2 then B' includes: the non-noise background principal components, ( ⁇ 2 ⁇ a ), and ( v ⁇ 2 ⁇ a ).
- the error bars indicate the noise equivalent column density (NE nc ) .
- nc results (based on simulation) is plotted versus number of terms included in the augmented background set. Error bars indicate NE nc . Amount of SO 2 in plume is indicated by the line "nc input”.
- the plot 44 in FIG. 5 starts with ⁇ 2 added to B' since at least two terms are required in the expansion to determine n c .
- n c As number of terms used to generate filter increases the estimated value of n c approaches the input value. But, at the same time, noise equivalent n c (NE nc ) increases. There is a number of terms where-the best estimate of n c is found. This estimate will be biased by the early cutoff of expansion terms.
- the sensor is a linear array of 4 detectors which can be "push-broomed” to build a 4xm ultra-special image (m is the number of scans in a run).
- the sensor can also track a stationary target on the ground as the aircraft flies over. During scans 1-9 the sensor was push-broomed across the ground leading up to target smokestack. These 36 spectra comprised the original background set, B. During scans 9-28 the sensor locked on to the stack and viewed the plume from various angles as the aircraft flew over.
- FIG. 5 shows a graph of smokestack spectral plume radiance generated from field data at 46.
- the emission feature between 1050 cm-1 and 1100 cm-1 is hot CO 2 which is also an effluent from the stack. If the CO 2 is not accounted for in constructing a filter for SO 2 the filter may couple with the CO 2 feature and give an incorrect SO 2 measurement result.
- interferant gases e.g., in this case, CO 2
- the absorption spectrum of a suspected interferant is added to the augmented background set, B'.
- B' When a spectrum is added to B' the filter constructed from B' will not correlate with that spectrum. With CO 2 added to the B' the CO 2 emission will not interfere with the SO 2 measurement.
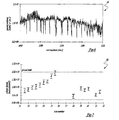
- FIG. 7 shows n c estimates, calculated NE nc and ground truth estimates for SO 2 column density in the plume at 48.
- the error bars indicate only the NE nc and do not take into account any other possible systematic errors.
- the ground truth estimate range is indicated by the horizontal lines.
- Scans 1-9 where used as background so no SO 2 measurements are shown for them. In scans 10, and after 21 the plume was either too thin or the thermal contrast too low to be able to make column density measurements (even though for those scans SO 2 could be detected). In scans 16 and 17 the plume was being viewed against the hot roof of a building. In these two scans the plume was about the same temperature as the background, so the thermal contrast was too low to make column density measurements.
- the OBS technique of the present invention is a linear filtering technique based on the assumption that background scene components in a target pixel are a linear sum of measured scene background spectra.
- a linear filter is constructed to reject background scene components and yield plume gas column density-thermal radiance contrast products. If filters for various powers of target gas absorption spectra are constructed, absolute column density and plume temperature can be separately determined for plume analysis purposes.
Landscapes
- Physics & Mathematics (AREA)
- Spectroscopy & Molecular Physics (AREA)
- Health & Medical Sciences (AREA)
- Life Sciences & Earth Sciences (AREA)
- Chemical & Material Sciences (AREA)
- Analytical Chemistry (AREA)
- Biochemistry (AREA)
- General Health & Medical Sciences (AREA)
- General Physics & Mathematics (AREA)
- Immunology (AREA)
- Pathology (AREA)
- Investigating Or Analysing Materials By Optical Means (AREA)
- Radiation Pyrometers (AREA)
Claims (11)
- Verfahren zum Bestimmen einer Säulendichte (nc) einer Abgasfahne (12) oder zum Messen von Spurengasen in einer Abgasfahne (12), wobei das Verfahren auf Algorithmen für eine Orthogonale Unterdrückung des Hintergrunds (OBS) basiert und die folgenden Schritte aufweist:Messen einer Zielpixelinformation, die eine Hintergrundinformation, eine Information des Kontrasts (Δb) der thermischen Radianz und eine Abgasfahneninformation enthält;Filtern der Hintergrundinformation und der Information (Δb) des Kontrasts der thermischen Radianz aus der Zielpixelinformation, um eine Information (nc ) der Säulendichte der Abgasfahne zu erhalten; undAusgeben der Information (nc ) der Säulendichte der Abgasfahne für Zwecke einer Analyse der Abgasfahne,dadurch gekennzeichnet, dass der Schritt des Filterns der Hintergrundinformation und der Information des Kontrasts (Δb) der thermischen Radianz aus der Zielpixelinformation den Schritt aufweist, dass der Kontrast (Δb) der thermischen Radianz als eine lineare Funktion von der Wellenzahl (vi ) des Spektrums der Abgasfahne modelliert wird, wobei die lineare Funktion Δbi =
Δb + (ν - νi)b ist, wobeiΔbi das i-te Element des Kontrasts (Δb) der thermischen Radianz ist,Δb eine Konstante ist, die den Durchschnitt des Kontrasts der thermischen Radianz repräsentiert,v eine Konstante ist, die die durchschnittliche Wellenzahl repräsentiert,vi die i-te Wellenzahl ist, undb eine Konstante ist. - Verfahren nach Anspruch 1, wobei die Zielpixelinformation wie folgt dargestellt wird

wobeif der Anteil der Pixel ist, die von der Abgasfahne (12) bedeckt werden, α' ein Koeffizient zur Potenz i ist,τ a die Transmission der Atmosphäre zwischen der Abgasfahne (12) und dem Sensor (20) ist,U die hauptsächlichen spektralen Anteile des Hintergrunds sind, undc eine Matrix mit Koeffizienten für die Gewichte der hauptsächlichen Anteile ist.
 - Verfahren nach Anspruch 1 oder 2, ferner aufweisend die Schritte:Berechnen einer Schwankungsbreite der Abgasfahne, die der Information (nc ) der Säulendichte der Abgasfahne zugeordnet ist; undAusgeben der Information der Schwankungsbreite der Abgasfahne zusammen mit der Information (nc ) der Säulendichte der Abgasfahne, um Rauschen bei den Szeneriepixeln zu berücksichtigen.
- Verfahren nach Anspruch 1 oder 2, ferner aufweisend den Schritt des Berechnens einer Information einer Abgasfahnentemperatur (TP) aus der Information des Kontrasts (Δb) der thermischen Radianz der Abgasfahne.
- Verfahren nach Anspruch 1 oder 2, wobei
das Filtern der Hintergrundinformation aus der Abgasfahneninformation ein Dichtekontrastprodukt ergibt, das sowohl Werte der Säulendichte (nc ) der Abgasfahne als auch Kontrastwerte der thermischen Radianz der Abgasfahne enthält;
Filtern des Kontrastwerts der thermischen Radianz der Abgasfahne aus dem Dichtekontrastprodukt, so dass sich eine Schätzung für die Säulendichte der Abgasfahne ergibt; und
die Information (nc ) der Säulendichte der Abgasfahne eine Schätzung der Säulendichte der Abgasfahne ist. - Verfahren nach Anspruch 5, ferner aufweisend den Schritt des Erzeugens eines Werts der rauschäquivalenten spektralen Radianz, und zwar basierend auf dem Schritt des Filterns der Hintergrundinformation aus der Abgasfahneninformation und dem Schritt des Filterns des Kontrastwerts der thermischen Radianz der Abgasfahne aus dem Dichtekontrastprodukt.
- Verfahren nach Anspruch 5, ferner aufweisend die Schritte:Messen der Bodentemperatur während des Schritts des Messens der Zielpixelinformation; undBestimmen der Abgasfahnentemperatur (TP) basierend auf den Schritten des Messens der Bodentemperatur, des Filterns der Hintergrundinformation aus der Abgasfahneninformation und des Filterns des Kontrasts der thermischen Radianz der Abgasfahne aus dem Dichtekontrastprodukt.
- Verfahren nach Anspruch 7, wobei der Schritt des Messens der Abgasfahnentemperatur (TP) mittels der folgenden Gleichung implementiert ist:


wobei Bν der Wert der Planck-Funktion bei der durchschnittlichen Wellenlänge des spektralen Fensters ist,

c1 und c2 Koeffizienten der Planck-Gleichung sind,
v eine Konstante ist und
Δb der durchschnittliche Kontrast der thermischen Radianz der Abgasfahne ist. - System zum Messen einer Säulendichte einer Gasfahne (12) aus Abgas, mit:einem Sensor (20), der eine Zielpixelinformation misst, die eine Hintergrundradianz, eine atmosphärische Radianz und eine Abgasfahnenradianz enthält; undeinen Prozessor (22), der mit dem Sensor (20) verbunden ist und die Zielpixelinformation speichert und verarbeitet;einem ersten Filter (28), der mittels des Prozessors (22) realisiert ist und der die Radianz des Hintergrunds und die atmosphärische Radianz aus der Zielpixelinformation filtern, um ein Produkt aus der Säulendichte der Abgasfahne und dem Kontrast der thermischen Radianz zu erhalten;einem zweiten Filter (30), der mittels des Prozessors (22) realisiert ist und der den Kontrast der thermischen Radianz aus dem Produkt aus der Säulendichte der Abgasfahne und dem Kontrast der thermischen Radianz filtern, um eine Information der Säulendichte der Abgasfahne zu erhalten; undeinem Ausgang (32), der dem Prozessor (22) zugeordnet ist und der die Information der Säulendichte der Abgasfahne von dem Prozessor für Zwecke der Datenanalyse ausgibt,wobei die Filter (28, 30) dafür ausgebildet sind, Algorithmen für eine Orthogonale Unterdrückung des Hintergrunds (OBS) durchzuführen,dadurch gekennzeichnet, dass der erste Filter (28) zum Filtern der Hintergrundinformation und der zweite Filter (30) zum Filtern der Information des Kontrasts der thermischen Radianz dafür ausgebildet sind, den Kontrast (Δb) der thermischen Radianz als eine lineare Funktion von der Wellenzahl (ν i ) des Spektrums der Abgasfahne zu modellieren, wobei die lineare Funktion Δbi =
Δ b + (v - vi )b, wobeiΔbi das i-te Element des Kontrasts (Δb) der thermischen Radianz ist,Δb eine Konstante ist, die den Durchschnitt des Kontrasts der thermischen Radianz repräsentiert,v eine Konstante ist, die die durchschnittliche Wellenzahl repräsentiert,vi die i-te Wellenzahl ist, undb eine Konstante ist. - System nach Anspruch 9, wobei die Zielpixelinformation wie folgt dargestellt wird

wobeif der Anteil der Pixel ist, die von der Abgasfahne (12) bedeckt werden, α' ein Koeffizient zur Potenz i ist,τα die Transmission der Atmosphäre zwischen der Abgasfahne (12) und dem Sensor (20) ist,U die hauptsächlichen spektralen Anteile des Hintergrunds sind, undc eine Matrix mit Koeffizienten für die Gewichte der hauptsächlichen Anteile ist.
 - System nach Anspruch 9 oder 10, wobei der Prozessor (22) dafür ausgebildet ist, Rauschinformation zu erzeugen, die ein Rauschen kompensiert, das mit der Zielpixelinformation in Zusammenhang steht, und/oder eine Temperatur der Abgasfahne basierend auf dem Kontrast der thermischen Radianz zu berechnen, die vom zweiten Filter (30) gefiltert wurde, und eine Schätzung der Bodenradianz wie sie vom Sensor (20) erfasst wird.
Applications Claiming Priority (3)
| Application Number | Priority Date | Filing Date | Title |
|---|---|---|---|
| US4468597P | 1997-04-18 | 1997-04-18 | |
| US44685P | 1997-04-18 | ||
| PCT/US1998/007903 WO1998048260A1 (en) | 1997-04-18 | 1998-04-17 | Method and system for remotely determining column density of trace gases |
Publications (2)
| Publication Number | Publication Date |
|---|---|
| EP0907883A1 EP0907883A1 (de) | 1999-04-14 |
| EP0907883B1 true EP0907883B1 (de) | 2009-09-23 |
Family
ID=21933749
Family Applications (1)
| Application Number | Title | Priority Date | Filing Date |
|---|---|---|---|
| EP98923303A Expired - Lifetime EP0907883B1 (de) | 1997-04-18 | 1998-04-17 | Verfahren und vorrichtung zur fernkonzentrationsmessung von gasspuren |
Country Status (4)
| Country | Link |
|---|---|
| US (1) | US6295859B1 (de) |
| EP (1) | EP0907883B1 (de) |
| DE (1) | DE69841173D1 (de) |
| WO (1) | WO1998048260A1 (de) |
Cited By (1)
| Publication number | Priority date | Publication date | Assignee | Title |
|---|---|---|---|---|
| DE10225722C1 (de) * | 2002-06-11 | 2003-12-11 | Sensorentechnologie Gettorf Gm | Prüfsensor |
Families Citing this family (25)
| Publication number | Priority date | Publication date | Assignee | Title |
|---|---|---|---|---|
| US6772071B2 (en) * | 2001-04-18 | 2004-08-03 | Techtrac Systems, Llc | Estimation of toxic substance release |
| ES2546457T3 (es) * | 2005-08-17 | 2015-09-23 | Nuvo Ventures, Llc | Método y sistema para supervisar la capacidad operativa de una planta |
| US7446878B2 (en) * | 2006-11-16 | 2008-11-04 | Trutouch Technologies, Inc. | Method and apparatus for improvement of spectrometer stability, and multivariate calibration transfer |
| US8145439B2 (en) * | 2007-08-06 | 2012-03-27 | Safer Systems, L.L.C. | Substance release estimation using path-averaged concentration measurements |
| IL190757A (en) * | 2008-04-09 | 2013-03-24 | Rafael Advanced Defense Sys | Method for remote spectral analysis of gas plumes |
| US8559721B1 (en) * | 2010-04-28 | 2013-10-15 | Exelis, Inc. | Filter mosaic for detection of fugitive emissions |
| US9146195B2 (en) * | 2010-06-04 | 2015-09-29 | Robert L. Spellicy | Systems and methods for radiance efficiency measurement |
| CN103983599B (zh) * | 2014-02-13 | 2016-08-17 | 中国科学院合肥物质科学研究院 | 直射太阳光谱反演环境大气中二氧化碳垂直柱浓度的方法 |
| US12399164B2 (en) | 2018-06-19 | 2025-08-26 | Seekops Inc. | Emissions estimate model algorithms and methods |
| US12216105B2 (en) | 2018-06-19 | 2025-02-04 | Seekops Inc. | Localization analytics algorithms and methods |
| WO2019246280A1 (en) | 2018-06-19 | 2019-12-26 | Seekops Inc. | Emissions estimate model algorithms and methods |
| US12044666B2 (en) | 2018-07-30 | 2024-07-23 | Seekops Inc. | Ultra-lightweight, handheld gas leak detection device |
| US11062614B2 (en) * | 2018-09-12 | 2021-07-13 | Alliance Solutions Group, Inc. | Systems and methods for collecting and analyzing hazardous materials information using an unmanned aerial vehicle |
| WO2020086499A1 (en) | 2018-10-22 | 2020-04-30 | Seekops Inc. | A uav-borne, high-bandwidth, lightweight point sensor for quantifying greenhouse gases in atmospheric strata |
| US12188847B2 (en) | 2019-04-05 | 2025-01-07 | Seekops Inc. | Time-and data-efficient assurance of leak detection |
| EP4010246A4 (de) | 2019-08-05 | 2023-09-13 | SeekOps Inc. | Schnell einsetzbares uas-system für autonome inspektionsoperationen unter verwendung einer kombinierten nutzlast |
| US12392680B2 (en) | 2019-09-20 | 2025-08-19 | Seekops Inc. | Spectral fitting of compact laser-based trace gas sensor measurements for high dynamic range (HDR) |
| EP4038357A4 (de) * | 2019-10-04 | 2023-11-08 | SeekOps Inc. | Erzeugung von flugmustern mit geschlossener oberfläche für fluxebenenbewertung unbemannter luftfahrzeuge (uav) |
| US12055485B2 (en) | 2020-02-05 | 2024-08-06 | Seekops Inc. | Multispecies measurement platform using absorption spectroscopy for measurement of co-emitted trace gases |
| WO2021158916A1 (en) | 2020-02-05 | 2021-08-12 | Seekops Inc. | Multiple path length optical cell for trace gas measurement |
| WO2022016107A1 (en) | 2020-07-17 | 2022-01-20 | Seekops Inc. | Uas work practice |
| US11748866B2 (en) | 2020-07-17 | 2023-09-05 | Seekops Inc. | Systems and methods of automated detection of gas plumes using optical imaging |
| WO2022093864A1 (en) | 2020-10-27 | 2022-05-05 | Seekops Inc. | Methods and apparatus for measuring methane emissions with an optical open-cavity methane sensor |
| CN112986983B (zh) * | 2021-02-06 | 2023-12-19 | 中国人民解放军国防科技大学 | 一种全息穿透成像雷达杂波抑制方法 |
| US20240077416A1 (en) * | 2022-09-01 | 2024-03-07 | Maxar Technologies Holdings Inc. | Estimating gas quantity in a pixel based on spectral matched filtering |
Family Cites Families (5)
| Publication number | Priority date | Publication date | Assignee | Title |
|---|---|---|---|---|
| US3931462A (en) | 1975-03-11 | 1976-01-06 | The United States Of America As Represented By The United States National Aeronautics And Space Administration Office Of General Counsel-Code Gp | Stack plume visualization system |
| US4320975A (en) | 1979-12-17 | 1982-03-23 | Gca Corporation | Passive smoke plume opacity monitor |
| US5371542A (en) | 1992-06-23 | 1994-12-06 | The United States Of America As Represented By The Secretary Of The Navy | Dual waveband signal processing system |
| US5479255A (en) | 1992-12-17 | 1995-12-26 | Trw Inc. | Multispectral signature extraction technique |
| US5528037A (en) | 1995-06-08 | 1996-06-18 | Trw Inc. | Band analysis system |
-
1998
- 1998-04-17 EP EP98923303A patent/EP0907883B1/de not_active Expired - Lifetime
- 1998-04-17 DE DE69841173T patent/DE69841173D1/de not_active Expired - Lifetime
- 1998-04-17 WO PCT/US1998/007903 patent/WO1998048260A1/en not_active Ceased
- 1998-04-17 US US09/202,506 patent/US6295859B1/en not_active Expired - Lifetime
Cited By (1)
| Publication number | Priority date | Publication date | Assignee | Title |
|---|---|---|---|---|
| DE10225722C1 (de) * | 2002-06-11 | 2003-12-11 | Sensorentechnologie Gettorf Gm | Prüfsensor |
Also Published As
| Publication number | Publication date |
|---|---|
| EP0907883A1 (de) | 1999-04-14 |
| US6295859B1 (en) | 2001-10-02 |
| DE69841173D1 (de) | 2009-11-05 |
| WO1998048260A1 (en) | 1998-10-29 |
Similar Documents
| Publication | Publication Date | Title |
|---|---|---|
| EP0907883B1 (de) | Verfahren und vorrichtung zur fernkonzentrationsmessung von gasspuren | |
| US9927356B2 (en) | Systems and methods for detecting gases, airborne compounds, and other particulates | |
| Manolakis et al. | Long-wave infrared hyperspectral remote sensing of chemical clouds: A focus on signal processing approaches | |
| JP2547948B2 (ja) | ミサイル監視方法及び装置 | |
| Yoshida et al. | Retrieval algorithm for CO 2 and CH 4 column abundances from short-wavelength infrared spectral observations by the Greenhouse gases observing satellite | |
| EP1303742B1 (de) | Spektrale drift und korrektionsverfahren für hyperspektrale abbildungssysteme | |
| US20210239606A1 (en) | Computationally efficient method for retrieving physical properties from 7-14 um hyperspectral imaging data under clear and cloudy background conditions | |
| KR101958541B1 (ko) | 적외선 분광 스펙트럼을 이용한 실시간 오염수준 정량화 방법 | |
| CN114061766A (zh) | 一种颗粒燃烧过程多光谱重建测温装置与方法 | |
| WO2009125413A1 (en) | Method and apparatus for gas detection based on spectral spatial misregistration | |
| US7149652B2 (en) | Method for modeling detection of camouflaged targets | |
| Kastek et al. | Method of gas detection applied to infrared hyperspectral sensor | |
| Hayden et al. | Remote trace gas quantification using thermal IR spectroscopy and digital filtering based on principal components of background scene clutter | |
| Thomas et al. | Infrared detection and analysis of vapor plumes using an airborne sensor | |
| Harig et al. | New scanning infrared gas imaging system (SIGIS 2) for emergency response forces | |
| KR102309680B1 (ko) | 주성분 분석 기법을 이용한 초분광 영상 실시간 독성 화학가스 탐지 방법 및 이를 실행시키기 위한 프로그램을 기록한 컴퓨터 판독 가능한 기록 매체 | |
| CN105784626B (zh) | 一种基于红外光谱成像技术的大气污染物自适应识别方法及系统 | |
| Manolakis et al. | Statistical models for LWIR hyperspectral backgrounds and their applications in chemical agent detection | |
| Barducci et al. | Atmospheric effects on hyperspectral data acquired with aerospace imaging spectrometers | |
| Zelinski | Off-nadir longwave infrared hyperspectral material identification using radiometric models | |
| Spisz et al. | Field test results of standoff chemical detection using the FIRST | |
| Courbot et al. | Detection of faint extended sources in hyperspectral data and application to HDF-S MUSE observations | |
| Puckrin et al. | Airborne infrared-hyperspectral mapping for detection of gaseous and solid targets | |
| Zhao | LWIR Spectral Variability Integration and Improvements to an Earth Observing Statistical Performance Model | |
| Vincent et al. | Subpixel target detection in hyperspectral imaging |
Legal Events
| Date | Code | Title | Description |
|---|---|---|---|
| PUAI | Public reference made under article 153(3) epc to a published international application that has entered the european phase |
Free format text: ORIGINAL CODE: 0009012 |
|
| AK | Designated contracting states |
Kind code of ref document: A1 Designated state(s): DE SE |
|
| 17P | Request for examination filed |
Effective date: 19990428 |
|
| 17Q | First examination report despatched |
Effective date: 20050304 |
|
| RAP1 | Party data changed (applicant data changed or rights of an application transferred) |
Owner name: GOODRICH CORPORATION |
|
| GRAP | Despatch of communication of intention to grant a patent |
Free format text: ORIGINAL CODE: EPIDOSNIGR1 |
|
| GRAS | Grant fee paid |
Free format text: ORIGINAL CODE: EPIDOSNIGR3 |
|
| GRAA | (expected) grant |
Free format text: ORIGINAL CODE: 0009210 |
|
| AK | Designated contracting states |
Kind code of ref document: B1 Designated state(s): DE SE |
|
| REF | Corresponds to: |
Ref document number: 69841173 Country of ref document: DE Date of ref document: 20091105 Kind code of ref document: P |
|
| REG | Reference to a national code |
Ref country code: SE Ref legal event code: TRGR |
|
| PLBE | No opposition filed within time limit |
Free format text: ORIGINAL CODE: 0009261 |
|
| STAA | Information on the status of an ep patent application or granted ep patent |
Free format text: STATUS: NO OPPOSITION FILED WITHIN TIME LIMIT |
|
| 26N | No opposition filed |
Effective date: 20100624 |
|
| PGFP | Annual fee paid to national office [announced via postgrant information from national office to epo] |
Ref country code: SE Payment date: 20130412 Year of fee payment: 16 Ref country code: DE Payment date: 20130508 Year of fee payment: 16 |
|
| REG | Reference to a national code |
Ref country code: DE Ref legal event code: R119 Ref document number: 69841173 Country of ref document: DE |
|
| REG | Reference to a national code |
Ref country code: SE Ref legal event code: EUG |
|
| PG25 | Lapsed in a contracting state [announced via postgrant information from national office to epo] |
Ref country code: SE Free format text: LAPSE BECAUSE OF NON-PAYMENT OF DUE FEES Effective date: 20140418 Ref country code: DE Free format text: LAPSE BECAUSE OF NON-PAYMENT OF DUE FEES Effective date: 20141101 |
|
| REG | Reference to a national code |
Ref country code: DE Ref legal event code: R119 Ref document number: 69841173 Country of ref document: DE Effective date: 20141101 |