EP0959140B1 - Méthodes, appareil et programme d'ordinateur pour la détermination quantitative de séquences d'acides nucléiques utilisant des courbes standard et des éstimations de rapport d'amplification - Google Patents
Méthodes, appareil et programme d'ordinateur pour la détermination quantitative de séquences d'acides nucléiques utilisant des courbes standard et des éstimations de rapport d'amplification Download PDFInfo
- Publication number
- EP0959140B1 EP0959140B1 EP99106838A EP99106838A EP0959140B1 EP 0959140 B1 EP0959140 B1 EP 0959140B1 EP 99106838 A EP99106838 A EP 99106838A EP 99106838 A EP99106838 A EP 99106838A EP 0959140 B1 EP0959140 B1 EP 0959140B1
- Authority
- EP
- European Patent Office
- Prior art keywords
- nucleic acid
- determining
- amplification
- quantities
- target
- Prior art date
- Legal status (The legal status is an assumption and is not a legal conclusion. Google has not performed a legal analysis and makes no representation as to the accuracy of the status listed.)
- Expired - Lifetime
Links
Images


Classifications
-
- C—CHEMISTRY; METALLURGY
- C12—BIOCHEMISTRY; BEER; SPIRITS; WINE; VINEGAR; MICROBIOLOGY; ENZYMOLOGY; MUTATION OR GENETIC ENGINEERING
- C12Q—MEASURING OR TESTING PROCESSES INVOLVING ENZYMES, NUCLEIC ACIDS OR MICROORGANISMS; COMPOSITIONS OR TEST PAPERS THEREFOR; PROCESSES OF PREPARING SUCH COMPOSITIONS; CONDITION-RESPONSIVE CONTROL IN MICROBIOLOGICAL OR ENZYMOLOGICAL PROCESSES
- C12Q1/00—Measuring or testing processes involving enzymes, nucleic acids or microorganisms; Compositions therefor; Processes of preparing such compositions
- C12Q1/68—Measuring or testing processes involving enzymes, nucleic acids or microorganisms; Compositions therefor; Processes of preparing such compositions involving nucleic acids
- C12Q1/6844—Nucleic acid amplification reactions
- C12Q1/6851—Quantitative amplification
Definitions
- This invention relates to methods for characterizing nucleic acid sequences, and more particularly to methods for determining quantities of nucleic acid sequences in samples.
- Quantitative nucleic sequence analysis plays an increasingly important role in the fields of biological and medical research. For example, quantitative gene analysis has been used to determine the genome quantity of a particular gene, as in the case of the human HER-2 oncogene which is found at amplified levels in approximately 30% of human breast cancers. D.J. Slamon et al., Science 235, 177-182 (1987 ). More recently, gene and genome quantitation have also been used in determining and monitoring the levels of human immunodeficiency virus (HIV) in patients throughout the different phases of HIV infection and disease. M.R. Furtado et al., J. Virol. 69, 2092-2100 (1995 ).
- HIV human immunodeficiency virus
- HIV replication virus level
- an accurate determination of HIV nucleic acid levels early in an infection may serve as a useful tool in diagnosing illness, while the ability to correctly monitor changing levels of viral nucleic acid throughout the course of an illness may provide clinicians with critical information regarding the effectiveness of treatment and progression of disease.
- the determination of virion-associated HIV RNA levels in plasma represents a marker of viral replication with potential widespread applicability in assessment of the activity of antiretroviral therapy. Id .
- PCR polymerase chain reaction
- RT-PCR reverse-transcriptase PCR
- these methods involve measuring PCR product at the end of nonisothermal amplification and relating this endpoint measurement level back to the starting nucleic acid concentration.
- the absolute amount of product generated does not always bear a consistent and easily quantifiable relationship to the amount of target sequence present at the initiation of the amplification reaction.
- the kinetics and efficiency of amplification of a target nucleic acid sequence may also be strongly dependent on the starting abundance of the target sequence and the sequence match of the primers and target template.
- some RT-PCR amplification methods which rely on "endpoint" analysis may be capable of only revealing the presence or absence of the target nucleic acid sequence, but not the actual starting quantity with any degree of accuracy. For these reasons, comparison of the amount of specimen-derived PCR product to the amount of product from a separately amplified external control standard typically does not provide a highly accurate basis for quantitation.
- QC-PCR quantitative competitive PCR
- QC-PCR relies on the inclusion of a known amount of an internal control competitor in each reaction mixture. The efficiency of each reaction is also normalized to the internal competitor.
- the unknown target PCR product is compared with the known competitor PCR product, usually via gel electrophoresis.
- the relative amount of target-specific and competitor DNA is measured and used to calculate the starting number of target templates. Basically, in this kind of analysis, the larger the ratio of target specific product to competitor specific product, the higher the starting DNA concentration.
- the prefix "QC' in QC-PCR refers to the fact that competition occurs between target and standard templates for available substrates when PCR is allowed to proceed into the saturation phase. Because the sum of the masses of both products cannot exceed some maximum value, the amount of product formed from one template will decrease with the increasing quantity of the other template. As will be understood by those skilled in the art, the products of target and standard sequences are discriminated either by a difference in length or by a specific restriction site in the region between the primer templates. In practice, a plurality of PCR tubes containing the same but unknown amount of target sequence is spiked with a dilution series of defined quantities of the standard.
- Raeymaekers recommends that a "curve" be generated which relates the logarithm of the ratio of PCR products standard/target to the logarithm of the initial known amount of standard cDNA added (i.e., log (T n /S n ) versus log (S 0 ).
- a curve be generated which relates the logarithm of the ratio of PCR products standard/target to the logarithm of the initial known amount of standard cDNA added (i.e., log (T n /S n ) versus log (S 0 ).
- Raeymakers also explains that if there is a difference in the amplification factor, theory predicts a parallel shift of the curve. This shift will cause a displacement in the point of equivalence and a faulty quantification because the magnitude of the displacement typically cannot be detected (because a reference point is typically not available). According to Raeymaekers, any determination that the curve has a slope of -1 does not suggest that the amplification factors are the same for both target and standard.
- Raeymaekers concludes that if a PCR assay yields a curve relating log (T n /S n ) to log (S 0 ) which is not linear or does not have a slope of -1 (or +1 in the event the abscissa provides log (To)), it cannot be used for either absolute or relative quantitation.
- SDA Strand Displacement Amplification
- a plurality of standard samples and at least one test sample are formed.
- the plurality of standard samples each contain a known starting quantity of a nucleic acid control sequence and a known starting quantity of a nucleic acid target sequence therein.
- the starting concentrations of the nucleic acid control sequence in the standard samples are also preferably set to equal levels to improve quantitation accuracy.
- the test sample contains a known starting quantity of the nucleic acid control sequence and an unknown starting quantity of the nucleic acid target sequence therein.
- the nucleic acid sequences in these standard samples and test sample are then amplified, preferably in parallel, during an amplification time interval.
- the isothermal reaction method utilizes two differentially labeled detector probes (signal primers). One probe is specific for target sequences being amplified (i.e., target amplicons) and the other probe is specific for control sequences being amplified (i.e., control amplicons). During the amplification reaction, each detector probe binds to its specific amplicon and is then converted to a cleaved form which preferably exhibits a much higher fluorescence intensity than the unconverted form of the probe.
- SDA Strand Displacement Amplification
- PCR Polymerase Chain Reaction
- Indicia of the amplified quantities of the nucleic acid control and target sequences in each of the standard samples and in the test sample are then measured in real-time, preferably at respective measurement time intervals (which may be normalized to respective measurement time points) in the amplification time interval if a real-time amplification method such as SDA is utilized.
- the indicia of the quantities of the nucleic acid control and target sequences being amplified may take the form of fluorescence signals (e.g., fluorescence intensities or detectable fluorescent energy transfers) if the samples contain fluorescent indicators therein (e.g., fluorescent dyes, labels, intercalators, etc).
- a plurality of fluorescence measurements may be performed on the plurality of control and test samples.
- other indicia which are suitable for real-time measurement (e.g., radioactive signals) may also be used instead of fluorescence.
- the measured indicia may then be collected over a range of measurement time intervals as respective normalized target fluorescence and normalized control fluorescence curves (i.e., NF T (t) and NF c (t)).
- NF T (t) and NF c (t) normalized target fluorescence and normalized control fluorescence curves
- fluorescence measurements for all measurement time intervals may be analyzed and then normalized to respective measurement time points within the amplification time interval.
- the normalized control fluorescence curves are generated as a two-dimensional graph, for example, the measurement time points may be assigned along the abscissa of the graph and the normalized fluorescence values may be assigned along the ordinate of the graph.
- Preferred operations are then performed to determine an amplification ratio (R*) from the measured indicia of the amplified quantities of the nucleic acid control and target sequences in the standard samples.
- R* an amplification ratio
- a magnitude of the starting quantity of the nucleic acid sequence in the test sample is then determined in a preferred manner from the amplification ratio and the measured indicia of the amplified quantities of the nucleic acid control and target sequences in the test sample.
- base )/ ⁇ T and C(t) ⁇ C /N P (NF C (t)-NF Clbase )/ ⁇ C , where N P equals the starting number of probes, ⁇ T equals the number of probes converted for every target amplicon generated, ⁇ C equals the number of probes converted for every control amplicon generated, ⁇ T equals (NF T
- the operations to determine an amplification ratio R* in a preferred manner do not require the separate determination of ⁇ T. ⁇ T , r, ⁇ C and ⁇ C .
- the operations also recognize that R* may vary as a function of time "t", To and C 0 , and that a preferred R*(t) should be determined based on a preferred statistical criterion.
- operations are performed to determine respective amplification ratios from indicia measurements performed during respective measurement time intervals within the amplification time interval, and then determine, relative to a statistical criterion, which of the amplification ratios better satisfies the statistical criterion against known starting quantities of the nucleic target sequences in the standard samples.
- These respective amplification ratios may also be determined as an average of amplification ratios for a number of selected standard samples, with each ratio for each of the selected standard samples being determined at each of the measurement time points.
- measurement indicia from two or more standard samples having identical starting quantities of control and target sequences (C 0 ,T 0 ) therein may be used to determine a respective average amplification ratio corresponding to measurement indicia obtained during a respective measurement time interval.
- the operations of the present invention preferably generate a set of amplification ratios ⁇ R 1 *, R 2 *, R 3 *, R 4 *, ..., R n * ⁇ with each ratio being an average value based on control samples having identical starting quantities of control and target sequences therein, for example, and also corresponding to an effective measurement time point along the abscissa of the graphs of NF T (t) and NF c (t)).
- operations for explicitly determining amplification ratio estimates may be bypassed by utilizing the measured indicia from the plurality of standard samples to predict a best "time" to perform absolute quantitation.
- a statistical criterion such as a conventional fit-to-line statistical criterion, may be applied to relationships between measured fluorescence indicia (at various time points within the amplification time interval) and the starting quantities of the nucleic acid target sequence in the standard samples, to determine a most preferred relationship upon which to base absolute quantitation.
- These relationships preferably take the form of log [(NF(t)-NF T
- An apparatus for determining a quantity of a nucleic acid sequence in a test sample comprises means, such as a fluorescence measurement tool, for measuring indicia of quantities of nucleic acid target and control sequences being amplified in a test sample, which contains an unknown starting quantity of the nucleic acid target sequence and a known starting quantity of the nucleic acid control sequence therein, and in a plurality of standard samples which each contain respective known starting quantities of the nuclei acid control and target sequences therein.
- a computer program product can be employed for controlling operation of the measuring means and performing numerical calculations to carry out the above-described operations.
- a preferred computer program product comprises a computer readable storage medium having computer-read able program code means embodied in the medium.
- the preferred computer-readable program code means comprises computer-readable program code means for determining an amplification ratio from the measured indicia of the amplified quantities of the nucleic acid control and target sequences in the standard samples.
- Computer-readable program code means is also employed for determining a magnitude of the starting quantity of the nucleic acid target sequence in the test sample from the amplification ratio and the measured indicia of the amplified quantities of the nucleic acid control and target sequences in the test sample.
- computer-readable program code means is also employed for performing more detailed ones of the above-described operations numerically.
- This comptuter program product therefore provides a tool which can more accurately perform absolute quantitation to determine starting quantities of nucleic acid target sequences in test samples, even if the amplification factors for the target and control sequences undergoing amplification are different and/or time dependent.
- These computer program products may be realized in whole or in part as software modules running on a computer system. Alternatively, a dedicated stand-alone system with application specific integrated circuits for performing the above described operations may be provided.
- preferred operations 100 for performing absolute quantitation of starting quantities of nucleic acid target sequences (e.g., RNA, DNA) in test samples use amplification ratio estimates. These amplification ratio estimates take into account differences in amplification and related factors (e.g., detection efficiency) associated with competitive amplification of nucleic acid control and target sequences.
- amplification ratio estimates take into account differences in amplification and related factors (e.g., detection efficiency) associated with competitive amplification of nucleic acid control and target sequences.
- a plurality of standard samples and at least one test sample are initially formed, Blocks 102 and 104 .
- the plurality of standard samples each contain a known starting quantity of a nucleic acid control sequence and a known (and different) starting quantity of a nucleic acid target sequence therein and the test sample contains a known starting quantity of the nucleic acid control sequence and an unknown starting quantity of the nucleic acid target sequence therein. It is this unknown starting quantity of the nucleic acid target sequence that is to be determined by absolute quantitation.
- the starting concentrations of the nucleic acid control sequence in the standard samples are also preferably set to equal known levels to enable quantitation.
- the nucleic acid sequences in these standard samples and test sample are then preferably amplified in parallel during an amplification time interval, Block 106 .
- the amplification operations may be performed separately for each of the samples during respective nonoverlapping time intervals. These separate time intervals may then be normalized to a common starting time and time interval for purposes of analysis.
- the samples may be amplified according to any known nucleic acid amplification methods, including both thermal cycling amplification methods and isothermal amplification methods.
- the present invention can enhance absolute quantitation of nucleic acids amplified by either thermal cycling methods or isothermal methods, although the present invention may provide particular advantages to isothermal amplification methods.
- Suitable thermal cycling methods useful in the practice of the present invention include, but are not limited to, the Polymerase Chain Reaction (PCR) (see, U.S Patent Nos. 4,683,202 , 4,683,195 and 4,965,188 ); Reverse Transcriptase PCR (RT-PCR); DNA Ligase Chain Reaction (LCR) (see, International Patent Application No. WO 89/09835 ); and transcription-based amplification (see, e.g., D.Y. Kwoh et al. 1989, Proc. Natl. Acad. Sci. USA 86, 1173-1177 ).
- PCR Polymerase Chain Reaction
- RT-PCR Reverse Transcriptase PCR
- LCR DNA Ligase Chain Reaction
- transcription-based amplification see, e.g., D.Y. Kwoh et al. 1989, Proc. Natl. Acad. Sci. USA 86, 1173-1177 ).
- Suitable isothermal amplification methods useful in the practice of the present invention include, but are not limited to, Strand Displacement Amplification (SDA) (see, e.g., Walker et al. 1992, Proc. Natl. Acad. Sci. USA 89, 392-396 ); Q- ⁇ replicase ( Lizardi et al. 1988, Bio/Technology 6, 1197-1202 ); Nucleic Acid-Based Sequence Amplification (NASBA; R. Sooknanan and L. Malek 1995, Bio/Technology 13, 563-65 ); and Self-Sustained Sequence Replication (3SR; Guatelli et al. 1990, Proc. Natl. Acad. Sci. USA 87, 1874-1878 ).
- SDA Strand Displacement Amplification
- Exemplary SDA methods are also described in U.S. Patent Nos. 5,445,166 to Walker and 5,270,184 to Walker et al. , the disclosures of which are hereby incorporated herein by reference.
- the isothermal reaction method may utilize two differentially labeled detector probes (signal primers). One probe is specific for target sequences being amplified (i.e., target amplicons) and the other probe is specific for control sequences being amplified (i.e., control amplicons). During the amplification reaction, each detector probe binds to its specific amplicon and is then converted to a cleaved form which preferably exhibits a much higher fluorescence intensity than the unconverted form of the probe.
- Indicia of the amplified quantities of the nucleic acid control and target sequences in each of the standard samples and in the test sample are then measured, preferably at respective measurement time intervals in the amplification time interval if a real-time amplification method such as SDA is utilized, Block 108.
- These measurements may be made by a microwell plate fluorescence measurement tool such as the CytoFluor Series 4000 from PerSeptive Biosystems.
- the Model 7700 Sequence Detector manufactured and distributed by Applied Biosystems, a division of Perkin Elmer, Foster City, California, may also be used as a measurement tool.
- the indicia of the quantities of the nucleic acid control and target sequences being amplified may take the form of fluorescence signals (e.g., fluorescence intensities or detectable fluorescent energy transfers) if the samples contain fluorescent indicators therein (e.g., fluorescent dyes, labels, intercalators, etc).
- the measurement tool may contain one or more photodetectors for measuring the fluorescence signals from the samples undergoing parallel amplification.
- the measurement tool may also contain a computer-controlled stepper motor so that the control and test samples can be arranged as an array of samples and automatically and repeatedly positioned opposite a photodetector upon measurement of fluorescence intensity.
- a preferred measurement tool is more fully described hereinbelow with reference to FIG. 6 .
- a plurality of fluorescence measurements may be obtained from the plurality of control and test samples.
- the fluorescence measurements made during a respective measurement time interval may also be normalized to respective measurement time points.
- indicia which are suitable for real-time measurement may also be used instead of fluorescence.
- indicia of nucleic acid concentration may be provided by labels that produce signals detectable by fluorescence, radioactivity, colorimetry, X-ray diffraction or absorption, magnetism, or enzymatic activity. Chemiluminescence and fluorescence lifetime measurements may also be utilized.
- Suitable labels include, fluorophores, chromophores, radioactive isotopes (e.g., 32 P or 125 I), electron-dense reagents, enzymes, and ligands having specific binding partners (e.g., biotin-avidin).
- Labeling of nucleic acids may be achieved by a number of means, including chemical modification of a nucleic acid primer or probe.
- Suitable fluorescent labels may include non-covalently binding labels (e.g., intercalating dyes) such as ethidium bromide, propidium bromide, chromomycin, acridine orange, and the like.
- non-covalently binding labels e.g., intercalating dyes
- covalently bound fluorescent agents is preferred in the present invention.
- Such covalently bound fluorescent labels include fluorescein and derivatives thereof such as FAM, HEX, TET and JOE (all of which can be obtained from the Applied Biosystems Division of Perkin Elmer, Foster City, California); rhodamine and derivatives such as Texas Red (Molecular Probes, Eugene, Oregon); ROX and TAMRA (Applied Biosystems, Foster City, CA); Lucifer Yellow; coumarin derivatives and the like.
- fluorescein and derivatives thereof such as FAM, HEX, TET and JOE (all of which can be obtained from the Applied Biosystems Division of Perkin Elmer, Foster City, California); rhodamine and derivatives such as Texas Red (Molecular Probes, Eugene, Oregon); ROX and TAMRA (Applied Biosystems, Foster City, CA); Lucifer Yellow; coumarin derivatives and the like.
- FET fluorescence energy-transfer
- a fluorescent reporter (or “donor”) label and a quencher (or “acceptor”) label are used in tandem to produce a detectable signal that is proportional to the amount of amplified nucleic acid product (e.g., in the form of double-stranded nucleic acid) present in the reaction mixture.
- FP fluorescence polarization
- Fluorescence lifetime measurements may be made by a microwell fluorescence reader such as Flowstar, manufactured by BMG. Chemiluminescence measurements may be made by a luminometer such as the Luminoskan, manufactured by Labsystems. Radioactivity measurements may be made by a scintillation counter, such as the Beckman LS6500.
- the measured indicia may then be collected over a plurality of consecutive measurement time intervals and processed to generate respective normalized target fluorescence and normalized control fluorescence curves (i.e., NF T (t) and NF C (t)).
- NF T (t) and NF C (t) normalized target fluorescence and normalized control fluorescence curves
- the fluorescence measurements for all measurement time intervals may be analyzed and then normalized to respective measurement time points and if the normalized control fluorescence curves are generated as a two-dimensional graph, the measurement time points may be assigned to the abscissa of the graph and the normalized fluorescence values may be assigned to the ordinate of the graph.
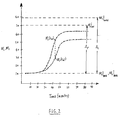
- FIG. 2 is a graph of normalized fluorescence curves NF C (t) and NF T (t) corresponding to a standard or test sample containing amplified quantities of control sequence (C n ) and target nucleic acid sequence (T n ) therein, where "n" represents the sample number.
- the normalized value of 1.0 on the y-axis of FIG. 2 represents NF C
- R* an amplification ratio
- a magnitude of the starting quantity of the nucleic acid sequence in the test sample is then determined in a preferred manner from the amplification ratio and the measured indicia of the amplified quantities of the nucleic acid control and target sequences in the test sample, Block 112 .
- any variation in "r” will influence the y-intercept associated with a graph of log (T(t)/C(t)r) versus log (T 0 ).
- the operations described below to determine an amplification ratio R* in a preferred manner do not require the separate and computationally expensive determination of ⁇ T .
- ⁇ T , r, ⁇ C and ⁇ C which may be functionally dependent on time and the starting concentrations To and C 0 .
- the amplification ratio R* is not equivalent to the statistical fit-to-line correlation factor R and R 2 illustrated by FIGS. 2-6 of the aforementioned Piatak et al. article.
- the preferred operations also recognize that R* may vary as a function of time "t" (and the starting concentrations To and C 0 ) and that a preferred R*(t) should be determined based on a preferred statistical criterion (e.g., fit-to-line).
- R*(t) may also be considered as a recognition that there exists a preferred point in time during amplification where R*(t,T 0 ,C 0 ) changes systematically to yield a curve of points which best approximates a straight line, as illustrated and described more fully hereinbelow with respect to FIG. 3 .
- operations are performed to determine respective amplification ratios from indicia measurements performed during respective measurement time intervals within the amplification time interval, and then determine, relative to a statistical criterion, which of the amplification ratios better satisfies the statistical criterion against known starting quantities of the nucleic target sequences in the standard samples.
- these respective amplification ratios R* may also be determined as an average of amplification ratios determined for a number of selected standard samples, with each ratio for each of the selected standard samples being determined at each of the normalized measurement time points.
- Operations are then performed which use the first estimated amplification ratio R*(t mi ) to determine a plurality of log-log relationships (e.g., x-y graphs), with each log-log relationship corresponding to a respective time point in the plurality of time points t mi .
- Each of these log-log relationships includes a respective data point for each of the standard samples (where T 0 is known).
- the log-log relationships may be determined as respective x-y graphs by plotting, for each respective t mi , the left side of equation (7) versus log (T 0 ), using the corresponding first estimated amplification ratio R*(t mi ).
- each x-y graph will provide a curve of points with the number of points being equal to the number of standard samples.
- Conventional line-fitting algorithms can then be used to generate, for each graph, a line having a positive slope, for example.
- a "best" line (corresponding to a "best” t m ⁇ ) can then be determined using a statistical criterion, and then the magnitude of the starting quantity of the nucleic acid target sequence in the test sample can be determined from the "best' line by calculating the left side of equation (7) for the test sample at the "best" t mi and then reading the corresponding value of log (T 0 ) off the line.
- the "best" line may also be determined from a “best" average amplification ratio R* i (t mi ) by using an exemplary statistical criterion (fit-to-line) which will now be described.
- a set of average amplification ratios can be generated as ⁇ R 1 , R 2 , R 3 , ..., R i ⁇ :
- R ⁇ 1 * R * t m ⁇ 1
- R ⁇ 2 * R * t m ⁇ 2
- R ⁇ 3 * R * t m ⁇ 3
- S ⁇ 2 / 2 9.3 * * * * * * R ⁇ i * R * t mi
- a respective x-y graph can be obtained for each t mi , as illustrated by FIG. 3 , with each data point corresponding to a respective standard sample (including points corresponding to S 1 , and S 2 which have the same x-value).
- a conventional line fitting algorithm can then be used to fit a corresponding line through the data points in each x-y graph.
- the "calculated" magnitudes of the starting quantities of the nucleic acid target sequences in the two standard samples can be determined by using each line to read respective logarithms of these calculated magnitudes off each x-axis. These calculated magnitudes are illustrated as T 0 (C1) and T 0 (C2) on FIG.
- Operations are then performed to determine which of the measurement time points t mi yields "calculated" magnitudes which are closest to the known starting quantity of the nucleic acid target sequence in the two standard samples. For example, an average calculated magnitude can be determined by averaging the two calculated magnitudes T 0 (C1) and T 0 (C2) and then determining which average calculated magnitude is closest to the known starting quantity. The line which yields the closest average calculation is then used to determine the starting quantity of the nucleic acid target sequence in the test sample. This line corresponds to the "best' t mi at which absolute quantitation should be performed to yield accurate results, notwithstanding the fact that the amplification factors associated with the target and control sequences are different.
- operations for explicitly determining amplification ratio estimates may be bypassed by utilizing the measured indicia from the plurality of standard samples to directly predict a best "time" to perform absolute quantitation.
- a statistical criterion such as a conventional fit-to-line statistical criterion, may be applied to relationships between measured fluorescence indicia (at various time points within the amplification time interval) and the starting quantities of the nucleic acid target sequence in the standard samples, to determine a most preferred relationship upon which to base absolute quantitation.
- FIG. 4 illustrates preferred operations 200 for performing absolute quantitation of starting quantities of nucleic acid target sequences (e.g., RNA, DNA) in test samples by analyzing standard curves.
- nucleic acid target sequences e.g., RNA, DNA
- standard curves are determined from indicia measured in real-time during amplification from standard samples containing known starting quantities of control and target sequences therein (with the known starting quantities of the control sequence preferably being the same in each of the standard samples).
- a plurality of standard samples and at least one test sample are initially formed, Blocks 202 and 204 .
- the plurality of standard samples each contain a known starting quantity of a nucleic acid control sequence and a known starting quantity of a nucleic acid target sequence therein and the test sample contains a known starting quantity of the nucleic acid control sequence and an unknown starting quantity of the nucleic acid target sequence therein.
- the nucleic acid sequences in these standard samples and test sample are then preferably amplified in parallel during an amplification time interval, Block 206 .
- Multiple sets of indicia e.g., fluorescence indicia
- indicia e.g., fluorescence indicia
- a plurality of fluorescence measurements may be obtained from the plurality of control and test samples.
- the measured indicia may then be collected over a plurality of consecutive measurement time intervals and processed to generate respective normalized target fluorescence and normalized control fluorescence curves (i.e., NF T (t) and NF C (t)) for each of the samples.
- NF T (t) and NF C (t) normalized target fluorescence and normalized control fluorescence curves
- the fluorescence measurements for all measurement time intervals may be analyzed and then normalized to respective measurement time points and if the normalized control fluorescence curves are generated as a two-dimensional graph, the measurement time points may be assigned to the abscissa of the graph and the normalized fluorescence values may be assigned to the ordinate of the graph, as illustrated best by FIG. 2 .
- operations are then performed to determine respective relationships between the measured indicia and the known starting quantities of the target sequence in the standard samples, Block 210 , at each of a plurality of measurement time points in the amplification time interval (e.g., t m1, t m2 . ..., t mi ).
- These relationships may take the form of respective x-y graphs of log[(NF T (t m1 )-NF T
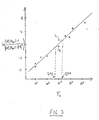
- An exemplary x-y graph derived from fluorescence measurements made for each of the standard samples at a respective time point t mi is illustrated by FIG. 5 . Each graph contains a curve of discrete points with each point corresponding to a standard sample.
- Operations are then performed at Block 212 to determine, relative to a statistical criterion, which of the first or second relationships better satisfies the statistical criterion against the known starting quantities of the target sequence in the plurality of standard samples.
- these operations may include operations to fit the first curve to a first line and fit the second curve to a second line and determine which of the first and second lines provides a better statistical fit to its respective curve.
- the operations to determine which of the first and second lines provides a better statistical fit may include the operations of determining a first "T-value" as the slope of the first line divided by a standard error in the slope of the first line, determining a second "T-value” as the slope of the second line divided by a standard error in the slope of the second line and then selecting the curve which results in the largest T-value.
- the line corresponding to the selected curve is then used to determine a magnitude of the starting quantity of the nucleic acid target sequence in the test sample (T 0
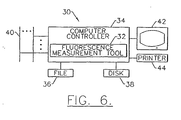
- FIG. 6 An apparatus 30 for determining quantities of nucleic acid target sequences in test samples is illustrated by FIG. 6 .
- This apparatus comprises means 32 , such as the aforementioned fluorescence measurement tool, for measuring indicia of quantities of nucleic acid target and control sequences being amplified in a test sample and being amplified in a plurality of standard samples.
- the apparatus 30 also operates under computer control.
- the measurement tool 32 is preferably operatively coupled to a general purpose or application specific computer controller 34 .
- the controller 34 preferably comprises a computer program product(s) for controlling operation of the measurement tool 32 and performing numerical operations relating to the above-described steps.
- the controller 34 may accept set-up and other related data via a file 36 , disk input 38 or data bus 40 .
- a display 42 and printer 44 are also preferably provided to visually display the operations performed by the controller 34 .
- controller 34 may be realized in whole or in part as software modules running on a general purpose computer system.
- a dedicated stand-alone system with application specific integrated circuits for performing the above described functions and operations may be provided.
- a preferred computer program product will comprise a computer readable storage medium having computer-readable program code means embodied in the medium.
- the preferred computer-readable program code means comprises computer-readable program code means for performing the operations described with respect to FIGS. 1 and 4 and throughout the present description.
- base are also inclusive of respective functions and constants obtained using normalized data (i.e., NF T (t), NF C (t), NF T
Landscapes
- Chemical & Material Sciences (AREA)
- Life Sciences & Earth Sciences (AREA)
- Organic Chemistry (AREA)
- Engineering & Computer Science (AREA)
- Zoology (AREA)
- Wood Science & Technology (AREA)
- Proteomics, Peptides & Aminoacids (AREA)
- Health & Medical Sciences (AREA)
- Biophysics (AREA)
- Chemical Kinetics & Catalysis (AREA)
- Immunology (AREA)
- Microbiology (AREA)
- Molecular Biology (AREA)
- Analytical Chemistry (AREA)
- Physics & Mathematics (AREA)
- Biotechnology (AREA)
- Biochemistry (AREA)
- Bioinformatics & Cheminformatics (AREA)
- General Engineering & Computer Science (AREA)
- General Health & Medical Sciences (AREA)
- Genetics & Genomics (AREA)
- Measuring Or Testing Involving Enzymes Or Micro-Organisms (AREA)
- Investigating Or Analysing Biological Materials (AREA)
Claims (8)
- Procédé pour déterminer la quantité d'une séquence d'acide nucléique dans un échantillon, comprenant les étapes consistant à :> former une pluralité d'échantillons standard qui contiennent chacun une quantité de départ connue d'une séquence d'acide nucléique témoin et une quantité de départ connue d'une séquence d'acide nucléique cible dans ceux-ci ;> former un échantillon de test contenant une quantité de départ connue de la séquence d'acide nucléique témoin et une quantité de départ inconnue de la séquence d'acide nucléique cible ;> amplifier les quantités des séquences d'acide nucléique témoin et cible dans chacun des échantillons standard et de l'échantillon de test, durant un intervalle de temps d'amplification ;> mesurer des premier et deuxième indices des quantités amplifiées des séquences d'acide nucléique témoin et cible dans chacun des échantillons standard et de l'échantillon de test, durant des premier et deuxième intervalles de temps de mesure ;> déterminer des premier et deuxième rapports d'amplification à partir des premier et deuxième indices des quantités amplifiées des séquences d'acide nucléique témoin et cible dans les échantillons standard ; et> déterminer une amplitude de la quantité de départ de la séquence d'acide nucléique cible dans l'échantillon de test à partir du premier ou deuxième rapport d'amplification ou à partir d'une moyenne des premier et deuxième rapports d'amplification et des indices mesurés des quantités amplifiées des séquences d'acide nucléique témoin et cible dans l'échantillon de test.
- Procédé selon la revendication 1, dans lequel ladite étape de détermination de rapports d'amplification comprend les étapes consistant à :➢ déterminer les relations de fluorescence témoin et cible (FC(t)) et (FT(t) en fonction du temps (t) pour le premier échantillon standard, à partir des intensités de fluorescence témoin et cible mesurées ; et➢ déterminer un rapport d'amplification (R*) basé sur la relation suivante (où C0 et T0 représentent respectivement les quantités de départ égales des séquences d'acide nucléique témoin et cible dans le premier échantillon standard) :

- Procédé selon la revendication 1, dans lequel ladite étape de formation d'une pluralité d'échantillon standard comprend la formation de premier et deuxième échantillons standard qui contiennent chacun des quantités de départ égales de séquences d'acide nucléique témoin et cible dans ceux-ci.
- Procédé selon la revendication 3, dans lequel ladite étape de détermination d'une amplitude comprend les étapes consistant à :➢ déterminer des relations de fluorescence témoin et cible (FC(t)) et (FT(t)) en fonction du temps (t) pour le troisième échantillon standard, à partir des intensités de fluorescence témoin et cible mesurées ; et> déterminer une relation entre (FT(t) - FT|base) /((FC(t) - FC|base)R 1*) et To, où To représente la quantité de départ de la séquence d'acide nucléique cible dans le troisième échantillon standard.
- Procédé pour déterminer la quantité d'une séquence d'acide nucléique dans un échantillon, comprenant les étapes consistant à :> former une pluralité d'échantillons standard qui contiennent chacun une quantité de départ connue d'une séquence d'acide nucléique témoin et une quantité de départ connue d'une séquence d'acide nucléique cible dans ceux-ci ;> former un échantillon de test contenant une quantité de départ connue d'une séquence d'acide nucléique témoin et une quantité de départ inconnue d'une séquence d'acide nucléique cible ;> amplifier les quantités des séquences d'acide nucléique témoin et cible dans chacun des échantillons standard et de l'échantillon de test, durant un intervalle de temps d'amplification ;> mesurer des premier et deuxième indices des quantités amplifiées des séquences d'acide nucléique témoin et cible dans les échantillons standard et l'échantillon de test, durant des premier et deuxième intervalles de temps de mesure respectivement ;> déterminer une première relation entre le premier indice et les quantités de départ connues de la séquence d'acide nucléique cible dans les échantillons standard ;> déterminer une deuxième relation entre le deuxième indice et les quantités de départ connues de la séquence d'acide nucléique cible dans les échantillons standard ;> déterminer, par rapport à un critère statistique, laquelle des première et deuxième relations satisfait mieux au critère statistique contre les quantités de départ connues des séquences d'acide nucléique cibles dans les échantillons standard ; et> déterminer une amplitude de la quantité de départ de la séquence d'acide nucléique cible dans l'échantillon de test à partir de la première ou deuxième relation déterminée de manière à mieux satisfaire au critère statistique.
- Procédé selon la revendication 5, dans lequel la pluralité d'échantillons standard ont des quantités de départ égales de séquence d'acide nucléique témoin dans ceux-ci ; dans lequel ladite étape de détermination d'une première relation comprend la détermination d'un premier ensemble de points à partir de log [(FT(tm1) - FT|base) / (FC tm1) - FC|base)] en fonction de log(T0) pour chacun de la pluralité d'échantillons standard, où T0 représente la quantité de départ de la séquence d'acide nucléique cible dans un échantillon standard respectif et tm1 représente un premier repère temporel dans l'intervalle de temps d'amplification ; et dans lequel ladite étape de détermination d'une deuxième relation comprend la détermination d'un deuxième ensemble de points à partir de log [(FT(tm2) - FT|base) / (FC(tm2) - FC|base) en fonction de log(T0) pour chacun de la pluralité d'échantillons standard, où tm2 représente un deuxième repère temporel dans l'intervalle de temps d'amplification.
- Procédé selon la revendication 6, dans lequel ladite étape de détermination de laquelle des première et deuxième relations satisfait mieux au critère statistique comprend les étapes consistant à :➢ ajuster le premier ensemble de points à une première ligne ;➢ ajuster le deuxième ensemble de points à une deuxième ligne ; et➢ déterminer laquelle des première et deuxième lignes offre un meilleur ajustement statistique à sa courbe respective.
- Procédé selon la revendication 7, dans lequel ladite étape de détermination de laquelle des première et deuxième lignes offre un meilleur ajustement statistique comprend les étapes consistant à :➢ déterminer une première valeur T en tant que pente de la première ligne divisée par une erreur type dans la pente de la première ligne ; i et➢ déterminer une deuxième valeur T en tant que pente de la deuxième ligne divisée par une erreur type dans la pente de la deuxième ligne.
Applications Claiming Priority (2)
| Application Number | Priority Date | Filing Date | Title |
|---|---|---|---|
| US09/080,589 US6066458A (en) | 1998-05-18 | 1998-05-18 | Methods, apparatus and computer program products for determining quantities of nucleic acid sequences in samples using standard curves and amplification ratio estimates |
| US80589 | 1998-05-18 |
Publications (3)
| Publication Number | Publication Date |
|---|---|
| EP0959140A2 EP0959140A2 (fr) | 1999-11-24 |
| EP0959140A3 EP0959140A3 (fr) | 2003-12-10 |
| EP0959140B1 true EP0959140B1 (fr) | 2009-07-01 |
Family
ID=22158339
Family Applications (1)
| Application Number | Title | Priority Date | Filing Date |
|---|---|---|---|
| EP99106838A Expired - Lifetime EP0959140B1 (fr) | 1998-05-18 | 1999-04-06 | Méthodes, appareil et programme d'ordinateur pour la détermination quantitative de séquences d'acides nucléiques utilisant des courbes standard et des éstimations de rapport d'amplification |
Country Status (5)
| Country | Link |
|---|---|
| US (1) | US6066458A (fr) |
| EP (1) | EP0959140B1 (fr) |
| JP (1) | JP2000023669A (fr) |
| CA (1) | CA2272273C (fr) |
| DE (1) | DE69941044D1 (fr) |
Families Citing this family (28)
| Publication number | Priority date | Publication date | Assignee | Title |
|---|---|---|---|---|
| US6180340B1 (en) | 1997-10-31 | 2001-01-30 | Gen-Probe Incorporated | Extended dynamic range assays |
| US6440706B1 (en) | 1999-08-02 | 2002-08-27 | Johns Hopkins University | Digital amplification |
| DE10045521A1 (de) | 2000-03-31 | 2001-10-04 | Roche Diagnostics Gmbh | Nukleinsäureamplifikationen |
| US6691041B2 (en) | 2000-03-31 | 2004-02-10 | Roche Molecular Systems, Inc. | Method for the efficiency-corrected real-time quantification of nucleic acids |
| US6783934B1 (en) | 2000-05-01 | 2004-08-31 | Cepheid, Inc. | Methods for quantitative analysis of nucleic acid amplification reaction |
| EP1440311B1 (fr) * | 2001-08-31 | 2009-01-07 | Gen-Probe Incorporated | Sondes presentant differentes affinites pour quantifier des polynucleotides d'un analyte |
| US7060082B2 (en) | 2002-05-06 | 2006-06-13 | Scimed Life Systems, Inc. | Perfusion guidewire in combination with a distal filter |
| NL1021160C2 (nl) | 2002-07-26 | 2004-01-27 | Multigen Internat B V | Werkwijze voor het bepalen van het kopieaantal van een nucleotidevolgorde. |
| MXPA05002565A (es) * | 2002-09-06 | 2005-05-05 | Chiron Corp | Metodo de verificacion de movimiento de fluido. |
| CN101410530B (zh) | 2003-04-18 | 2013-03-27 | 贝克顿·迪金森公司 | 免疫-扩增 |
| US20050233332A1 (en) * | 2004-04-14 | 2005-10-20 | Collis Matthew P | Multiple fluorophore detector system |
| US7964413B2 (en) | 2005-03-10 | 2011-06-21 | Gen-Probe Incorporated | Method for continuous mode processing of multiple reaction receptacles in a real-time amplification assay |
| EP1930730B1 (fr) | 2005-03-10 | 2019-08-14 | Gen-Probe Incorporated | Systèmes et procédés pour effectuer des analyses afin de détecter ou quantifier des analytes |
| JP5068748B2 (ja) * | 2005-06-22 | 2012-11-07 | ジェン−プロウブ インコーポレイテッド | ポリヌクレオチドを定量するための方法およびアルゴリズム |
| US7831417B2 (en) * | 2005-11-14 | 2010-11-09 | Gen-Probe Incorporated | Parametric calibration method |
| JP2010511390A (ja) * | 2006-11-30 | 2010-04-15 | ジェン−プロウブ インコーポレイテッド | 予め規定されたマスター検量線の調整を使用する定量方法 |
| FR2922897B1 (fr) * | 2007-10-25 | 2009-11-27 | Bio Rad Pasteur | Mesure d'une population d'acides nucleiques,en particulier par pcr en temps reel. |
| US8346485B2 (en) | 2008-11-25 | 2013-01-01 | Quest Diagnostics Investments Incorporated | Methods and apparatuses for estimating initial target nucleic acid concentration in a sample by modeling background signal and cycle-dependent amplification efficiency of a polymerase chain reaction |
| AU2010276236B2 (en) | 2009-07-21 | 2014-03-20 | Gen-Probe Incorporated | Methods and compositions for quantitative detection of nucleic acid sequences over an extended dynamic range |
| AU2012222178B2 (en) | 2011-02-24 | 2014-12-18 | Gen-Probe Incorporated | Systems and methods for distinguishing optical signals of different modulation frequencies in an optical signal detector |
| AU2013202804A1 (en) | 2012-06-14 | 2014-01-16 | Gen-Probe Incorporated | Use of a fluorescent material to detect failure or deteriorated performance of a fluorometer |
| CN102994647B (zh) * | 2012-06-21 | 2014-11-19 | 宁波海尔施基因科技有限公司 | 一种人乳头瘤病毒(hpv)的分型定量检测试剂盒 |
| US9932628B2 (en) | 2012-07-27 | 2018-04-03 | Gen-Probe Incorporated | Dual reference calibration method and system for quantifying polynucleotides |
| JP6463332B2 (ja) * | 2013-03-15 | 2019-01-30 | ジェン−プローブ・インコーポレーテッド | 較正の方法、装置およびコンピュータプログラム製品 |
| US10465237B2 (en) | 2014-01-20 | 2019-11-05 | Life Technologies Corporation | Methods and systems for quantification without standard curves |
| EP3764079B1 (fr) | 2015-12-31 | 2023-08-09 | Gen-Probe Incorporated | Système et procédé d'analyse de surveillance de la performance d'un détecteur de signal optique |
| CN105678110B (zh) * | 2016-01-29 | 2019-03-29 | 东南大学 | 一种样本组合分析核酸序列的方法 |
| DE102018213026A1 (de) * | 2018-08-03 | 2020-02-06 | Robert Bosch Gmbh | Verfahren zur Durchführung einer Echtzeit-PCR |
Family Cites Families (13)
| Publication number | Priority date | Publication date | Assignee | Title |
|---|---|---|---|---|
| US5455166A (en) * | 1991-01-31 | 1995-10-03 | Becton, Dickinson And Company | Strand displacement amplification |
| US5994056A (en) * | 1991-05-02 | 1999-11-30 | Roche Molecular Systems, Inc. | Homogeneous methods for nucleic acid amplification and detection |
| US5270184A (en) * | 1991-11-19 | 1993-12-14 | Becton, Dickinson And Company | Nucleic acid target generation |
| US5457027A (en) * | 1993-05-05 | 1995-10-10 | Becton, Dickinson And Company | Internal controls for isothermal nucleic acid amplification reactions |
| CA2129787A1 (fr) * | 1993-08-27 | 1995-02-28 | Russell G. Higuchi | Surveillance de plusieurs reactions d'amplification simultanement et analyse de ces reactions simultanement |
| US5547861A (en) * | 1994-04-18 | 1996-08-20 | Becton, Dickinson And Company | Detection of nucleic acid amplification |
| DE69519783T2 (de) * | 1994-04-29 | 2001-06-07 | Perkin-Elmer Corp., Foster City | Verfahren und vorrichtung zur echtzeiterfassung der produkte von nukleinsäureamplifikation |
| US5766889A (en) * | 1994-06-08 | 1998-06-16 | The Perkin-Elmer Corporation | Method for determining the characteristics of the concentration growth of target nucleic acid molecules in polymerase chain reaction sample |
| US5710029A (en) * | 1995-06-07 | 1998-01-20 | Gen-Probe Incorporated | Methods for determining pre-amplification levels of a nucleic acid target sequence from post-amplification levels of product |
| US5550025A (en) * | 1995-07-19 | 1996-08-27 | Becton, Dickinson And Company | Detection of hydrophobic amplification products by extraction into an organic phase |
| EP0910666B1 (fr) * | 1996-05-02 | 2006-08-09 | Applera Corporation | Quantification des transcrits d'arn utilisant l'adn genomique comme competiteur d'amplification interne |
| US5736333A (en) * | 1996-06-04 | 1998-04-07 | The Perkin-Elmer Corporation | Passive internal references for the detection of nucleic acid amplification products |
| US5863736A (en) * | 1997-05-23 | 1999-01-26 | Becton, Dickinson And Company | Method, apparatus and computer program products for determining quantities of nucleic acid sequences in samples |
-
1998
- 1998-05-18 US US09/080,589 patent/US6066458A/en not_active Expired - Fee Related
-
1999
- 1999-04-06 DE DE69941044T patent/DE69941044D1/de not_active Expired - Lifetime
- 1999-04-06 EP EP99106838A patent/EP0959140B1/fr not_active Expired - Lifetime
- 1999-05-17 JP JP11135326A patent/JP2000023669A/ja active Pending
- 1999-05-18 CA CA002272273A patent/CA2272273C/fr not_active Expired - Fee Related
Also Published As
| Publication number | Publication date |
|---|---|
| EP0959140A3 (fr) | 2003-12-10 |
| CA2272273C (fr) | 2008-12-09 |
| CA2272273A1 (fr) | 1999-11-18 |
| US6066458A (en) | 2000-05-23 |
| EP0959140A2 (fr) | 1999-11-24 |
| JP2000023669A (ja) | 2000-01-25 |
| DE69941044D1 (de) | 2009-08-13 |
Similar Documents
| Publication | Publication Date | Title |
|---|---|---|
| EP0959140B1 (fr) | Méthodes, appareil et programme d'ordinateur pour la détermination quantitative de séquences d'acides nucléiques utilisant des courbes standard et des éstimations de rapport d'amplification | |
| US5863736A (en) | Method, apparatus and computer program products for determining quantities of nucleic acid sequences in samples | |
| JP4443717B2 (ja) | 被験体の定量方法 | |
| US8450063B2 (en) | Determination of copy number differences by amplification | |
| Vaerman et al. | Evaluation of real-time PCR data | |
| US7920971B2 (en) | Quantification schemes for quantifying nucleic acids | |
| US20220389495A1 (en) | Methods and systems for multiplex analysis | |
| US20110151461A1 (en) | Detection algorithm for pcr assay | |
| US12378602B2 (en) | Methods and kits for determining the efficiency of plasma separation from whole blood | |
| Handy et al. | Simultaneous enumeration of multiple raphidophyte species by quantitative real‐time PCR: capabilities and limitations | |
| US20180346976A1 (en) | Dual reference calibration method and system for quantifying polynucleotides | |
| US20180247015A1 (en) | Multiple dataset analysis for determining the presence or absence of target analyte | |
| Huggett et al. | Standardisation and reporting for nucleic acid quantification | |
| US20060286587A1 (en) | Methods for quantitative analysis of a nucleic acid amplification reaction | |
| US20060141518A1 (en) | Detection of gene expression | |
| EP4381097A1 (fr) | Procédés, systèmes et compositions permettant la détection de multiples analytes | |
| US20240376534A1 (en) | Master mix compositions, kits, and methods | |
| WO2024027961A1 (fr) | Procédé de détection du sars-cov-2 par pcr numérique | |
| Bowyer | Real-time PCR | |
| US20210395807A1 (en) | System and method for data analysis in quantitative pcr measurements | |
| Kessler | Design and work-up of a new molecular diagnostic assay based on real-time PCR | |
| IL305532A (en) | Fragmentomics-based plasma separation assays |
Legal Events
| Date | Code | Title | Description |
|---|---|---|---|
| PUAI | Public reference made under article 153(3) epc to a published international application that has entered the european phase |
Free format text: ORIGINAL CODE: 0009012 |
|
| AK | Designated contracting states |
Kind code of ref document: A2 Designated state(s): AT BE CH CY DE DK ES FI FR GB GR IE IT LI LU MC NL PT SE |
|
| AX | Request for extension of the european patent |
Free format text: AL;LT;LV;MK;RO;SI |
|
| PUAL | Search report despatched |
Free format text: ORIGINAL CODE: 0009013 |
|
| AK | Designated contracting states |
Kind code of ref document: A3 Designated state(s): AT BE CH CY DE DK ES FI FR GB GR IE IT LI LU MC NL PT SE |
|
| AX | Request for extension of the european patent |
Extension state: AL LT LV MK RO SI |
|
| 17P | Request for examination filed |
Effective date: 20040525 |
|
| AKX | Designation fees paid |
Designated state(s): DE FR GB IT |
|
| 17Q | First examination report despatched |
Effective date: 20041020 |
|
| GRAP | Despatch of communication of intention to grant a patent |
Free format text: ORIGINAL CODE: EPIDOSNIGR1 |
|
| GRAS | Grant fee paid |
Free format text: ORIGINAL CODE: EPIDOSNIGR3 |
|
| GRAA | (expected) grant |
Free format text: ORIGINAL CODE: 0009210 |
|
| AK | Designated contracting states |
Kind code of ref document: B1 Designated state(s): DE FR GB IT |
|
| REG | Reference to a national code |
Ref country code: GB Ref legal event code: FG4D |
|
| REF | Corresponds to: |
Ref document number: 69941044 Country of ref document: DE Date of ref document: 20090813 Kind code of ref document: P |
|
| PLBE | No opposition filed within time limit |
Free format text: ORIGINAL CODE: 0009261 |
|
| STAA | Information on the status of an ep patent application or granted ep patent |
Free format text: STATUS: NO OPPOSITION FILED WITHIN TIME LIMIT |
|
| 26N | No opposition filed |
Effective date: 20100406 |
|
| PGFP | Annual fee paid to national office [announced via postgrant information from national office to epo] |
Ref country code: IT Payment date: 20100427 Year of fee payment: 12 |
|
| PGFP | Annual fee paid to national office [announced via postgrant information from national office to epo] |
Ref country code: FR Payment date: 20110504 Year of fee payment: 13 Ref country code: DE Payment date: 20110427 Year of fee payment: 13 |
|
| PGFP | Annual fee paid to national office [announced via postgrant information from national office to epo] |
Ref country code: GB Payment date: 20110426 Year of fee payment: 13 |
|
| PG25 | Lapsed in a contracting state [announced via postgrant information from national office to epo] |
Ref country code: IT Free format text: LAPSE BECAUSE OF NON-PAYMENT OF DUE FEES Effective date: 20110406 |
|
| GBPC | Gb: european patent ceased through non-payment of renewal fee |
Effective date: 20120406 |
|
| REG | Reference to a national code |
Ref country code: FR Ref legal event code: ST Effective date: 20121228 |
|
| PG25 | Lapsed in a contracting state [announced via postgrant information from national office to epo] |
Ref country code: GB Free format text: LAPSE BECAUSE OF NON-PAYMENT OF DUE FEES Effective date: 20120406 |
|
| PG25 | Lapsed in a contracting state [announced via postgrant information from national office to epo] |
Ref country code: FR Free format text: LAPSE BECAUSE OF NON-PAYMENT OF DUE FEES Effective date: 20120430 |
|
| REG | Reference to a national code |
Ref country code: DE Ref legal event code: R119 Ref document number: 69941044 Country of ref document: DE Effective date: 20121101 |
|
| PG25 | Lapsed in a contracting state [announced via postgrant information from national office to epo] |
Ref country code: DE Free format text: LAPSE BECAUSE OF NON-PAYMENT OF DUE FEES Effective date: 20121101 |