EP0977055A2 - Verfahren und System zur Lieferung einer Rückführungsinformation auf einer zerstörungsfreien Prüfen eines Verbundteils - Google Patents
Verfahren und System zur Lieferung einer Rückführungsinformation auf einer zerstörungsfreien Prüfen eines Verbundteils Download PDFInfo
- Publication number
- EP0977055A2 EP0977055A2 EP99202500A EP99202500A EP0977055A2 EP 0977055 A2 EP0977055 A2 EP 0977055A2 EP 99202500 A EP99202500 A EP 99202500A EP 99202500 A EP99202500 A EP 99202500A EP 0977055 A2 EP0977055 A2 EP 0977055A2
- Authority
- EP
- European Patent Office
- Prior art keywords
- information
- parts
- actuated
- button
- window
- Prior art date
- Legal status (The legal status is an assumption and is not a legal conclusion. Google has not performed a legal analysis and makes no representation as to the accuracy of the status listed.)
- Granted
Links
Images


Classifications
-
- G—PHYSICS
- G01—MEASURING; TESTING
- G01N—INVESTIGATING OR ANALYSING MATERIALS BY DETERMINING THEIR CHEMICAL OR PHYSICAL PROPERTIES
- G01N29/00—Investigating or analysing materials by the use of ultrasonic, sonic or infrasonic waves; Visualisation of the interior of objects by transmitting ultrasonic or sonic waves through the object
- G01N29/44—Processing the detected response signal, e.g. electronic circuits specially adapted therefor
- G01N29/4445—Classification of defects
-
- G—PHYSICS
- G01—MEASURING; TESTING
- G01N—INVESTIGATING OR ANALYSING MATERIALS BY DETERMINING THEIR CHEMICAL OR PHYSICAL PROPERTIES
- G01N29/00—Investigating or analysing materials by the use of ultrasonic, sonic or infrasonic waves; Visualisation of the interior of objects by transmitting ultrasonic or sonic waves through the object
- G01N29/04—Analysing solids
- G01N29/06—Visualisation of the interior, e.g. acoustic microscopy
- G01N29/0609—Display arrangements, e.g. colour displays
- G01N29/0618—Display arrangements, e.g. colour displays synchronised with scanning, e.g. in real-time
- G01N29/0636—Display arrangements, e.g. colour displays synchronised with scanning, e.g. in real-time with permanent recording
-
- G—PHYSICS
- G01—MEASURING; TESTING
- G01N—INVESTIGATING OR ANALYSING MATERIALS BY DETERMINING THEIR CHEMICAL OR PHYSICAL PROPERTIES
- G01N2291/00—Indexing codes associated with group G01N29/00
- G01N2291/26—Scanned objects
- G01N2291/263—Surfaces
- G01N2291/2632—Surfaces flat
Definitions
- the present invention relates to the inspection of parts and, more particularly, to the non-destructive inspection of parts.
- NDI inspection of composite parts occurs as one of the last steps in the production of a composite part.
- NDI information identifying a deficiency may not be related back to the manufacturer of the components of the composite part or the crew assembling the part in time to correct the same deficiency in follow-on parts.
- a relatively minor change in the components or techniques used to build a composite part can result in a positive NDI result, provided the change information is made available in a timely manner to the crew building the composite part.
- Prior efforts at sharing NDI results, with a crew building composite parts have included the following: (1) the creation of a story board with hard copy prints of ultrasonic scan images of the parts; (2) weekly status reports summarizing percentages of first time ultrasonic scan discrepancies; and (3) crew meetings with the results of the ultrasonic scans read aloud to the crew and/or the information placed on a viewfoil and displayed using an overhead projector. Because ultrasonic scan results have been manually gathered, a significant lag time has occurred between the preparation and presentation of NDI results to the crew building the composite parts.
- NDI results eventually have been provided to the crew needing the information, a good deal of waste, rework, and possibly scrap has been incurred before the information is utilized.
- no adequate system for quickly and efficiently feeding back pertinent NDI results from the most recent builds of a composite part to the crew manufacturing the part has been available.
- no adequate system for allowing an ultrasonic scan image to be accessed by the crew without a significant lag time to allow for the collection, preparation, and presentation of the image has been available.
- the present invention addresses the need for a method and a system that provides to a crew assembling composite parts timely feedback of the results of an NDI of previously assembled parts, so that changes necessary to correct a deficiency may be promptly performed on follow-on composite parts.
- a computer-implementable method of rapidly and quickly providing NDI information to a crew building parts, particularly composite parts, hereinafter referred to as a Quality Tracking System, or QTS comprises: gathering NDI information about the parts as they are manufactured; gathering other information, including repair information, about parts from manufacturing personnel; linking the NDI information to the other information; storing the linked NDI and other information in a database; and, upon user request, selectively deriving information about the parts from the information stored in the database; and displaying reports based on the derived information.
- the gathering of NDI information comprises ultrasonically scanning the parts as they are manufactured in order to identify defects in the parts.
- gathering other information, including repair information, about the parts includes providing an input window for manufacturing personnel to enter information regarding the identity of parts, defects in parts, and the repair of defects in the parts.
- the computer-implementable method comprises collating the NDI and other information gathered about parts, including defects in the parts, based on user-initiated queries, and displaying the results of such collation.
- results of the collation are displayed in tabular form.
- the NDI and other information gathered about parts is used to produce graphs and other statistical data showing trends and other information about the parts.
- the invention provides a computer-implementable method of rapidly and quickly gathering NDI and other information about parts, particularly composite parts, as they are manufactured and providing the information to manufacturing and other personnel. Because defect and repair information is gathered on parts as they are manufactured, manufacturing process steps can be modified in real time in order to avoid or eliminate defects in subsequent composite parts as they are manufactured.
- the present invention is directed to providing the timely transmittal of data produced by the Non-Destructive Inspection (NDI) of a part, particularly a composite part, in a manufacturing environment.
- NDI Non-Destructive Inspection
- the present invention is directed to reducing, if not entirely eliminating, the waste resulting from manufacturing personnel's lack of knowledge of existing or current deficiencies in the part.
- the NDI data is communicated using existing computing hardware and customized "off-the-shelf" software with discrete and coordinated input fields that document the part status and inspection results.
- the present invention is designed to be used "on-line” and track the progress of part manufacturing performance over time. In effect, the present invention can be used to provide a living document about parts in a manufacturing environment, particularly composite parts.
- the present invention enables statistical data to be retrieved and provides support for future design and manufacturing choices.
- the present invention enables users to view an ultrasonically produced image of a composite part, identify significant problems or anomalies in the part, and transmit the resulting information to other manufacturing personnel so that prompt corrective action can be taken.
- the invention avoids the disadvantages associated with word of mouth communication or rejection tag documents containing discrepancy descriptions.
- a composite part image is produced by a scanning machine performing a Through Transmission Ultrasound (TTU) inspection of the part.
- TTU Through Transmission Ultrasound
- the image may be viewed by personnel involved in the assembly, maintenance, or validation of the composite part.
- Composite part records for an entire product line are captured and stored for retrieval in a relatively short period of time by an on-line Quality Tracking System (QTS), formed in accordance with this invention.
- QTS Quality Tracking System
- the QTS improves throughput in a manufacturing environment and provides the ability to track part manufacturing performance.
- the present invention provides a computer-implementable method and a system that captures, stores, and retrieves ultrasonic inspection results of composite parts in an expeditious manner so that the "lessons learned" from one part can be applied to the very next build of the part.
- the QTS creates an on-line computerized database and is preferably implemented using personal computer (PC) based hardware and software. Because the hardware and software are preferably PC based, the invention is readily implemented using off-the-shelf software with designed and specific input fields.
- the hardware and software have the ability to create "real-time" associative pictures on a per-part basis based on an ultrasonic scan of a composite part.
- the scan image is viewable on a display device, e.g., a PC monitor, when accessed by manufacturing and other personnel.
- the software and hardware have the ability to store historical part record information and the software should have cross-tracking capability so that a "production order" can be tracked on a per-part basis.
- the software has on-line help/document features and on-line step-by-step instruction for usage.
- Local users' PC(s) can be interfaced via a Local Area Network (LAN) and remote users' PCs can be interfaced via a Wide Area Network (WAN) or the Internet.
- LAN Local Area Network
- WAN Wide Area Network
- the Quality Tracking System (QTS) data is partially derived from an ultrasonic inspection of a part using a suitable ultrasonic inspection device such as an automated TTU inspection system.
- a suitable ultrasonic inspection device such as an automated TTU inspection system.
- the composite part is scanned by the automated TTU inspection system. All of the wetted area of a given part is swept so that every square inch of the part is included in the scan image.
- water is employed as the coupling agent for the ultrasonic waves in the wetted area.
- Quality Assurance personnel fill in specifically designed input fields with data associated with the composite part.
- the QTS "links" the scan image to the "designed input fields” so that they are cross-referenced to each other.
- a system administrator e.g., another Quality Assurance individual, verifies the content of the entered composite part data.
- Part record "trends" and statistics are automatically gathered from the "designed input fields" by the software based on user queries and suitable reports are displayed.
- the QTS is designed to be accessed by PCs located in the manufacturing areas, which allows the production records and scan images for previous composite parts to be immediately available to manufacturing personnel building the next composite part.
- the present invention enables users to access a pictorial image via a link between the designed input fields and a related scanned image.
- the link is created by a computer program that combines entered part data and scan image data.
- the link makes both accessible on-line in a manufacturing environment.
- the part input fields are designed to provide information pertinent to the part in terms of parameters that may influence the outcome for a given part.
- the input fields are designed to mesh with the captured and linked image so as to produce an inherently accurate record of the part.
- a feature of a preferred embodiment of a QTS formed in accordance with this invention are the input fields that are available for comment. Data may be extracted from the comment input fields for future determination.
- the type of data requested or recorded in the input fields pertinent to the quality assessment of composite parts preferably include the following: Inspection Machine Number, Part Number, Process Specification, Requalification #, Scan Descriptions, Product Family, Scan Date, Part Record Number, Tool Type and Set, Scan Data File (as it is recorded on the Scanning System), Bake Number, Inspection Number, Image Name, Whether the part Passed, Non-Compliance Record Number, Defect Attenuation, Defect Location, Defect Size, Number of Defects, Repair Information, Part Trend Information, Comments Section, and Log Number reference as well as other traceable information.
- a QTS formed in accordance with this invention successfully recorded an impressive 90 percent average first time inspection pass rate for composite parts.
- a comparative analysis on composite parts that initially did not use the present invention revealed an approximate first time inspection pass rate of only 60 percent.
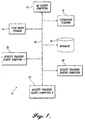
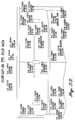
- FIGURE 1 is an exemplary block diagram illustrating a client-server architecture 10 suitable for implementing a QTS formed in accordance with this invention.
- server is used interchangeably with the term “server computer”
- client is used interchangeably with the term “client computer.”
- the single quality tracking server 20 shown in FIGURE 1 coupled to a network 26 may actually comprise a group of distributed servers to allow resource capacity to be scaled as necessary to efficiently administer the QTS.
- the use of distributed servers to administer the QTS provides dynamic scaling of resources to match the number of users accessing the system.
- the network 20 may be a local area network (LAN), a wide area network (WAN), the Internet, or combinations thereof
- the ultrasonic scanner 16 shown in FIGURE 1 is a conventional automated ultrasonic scanner, such as a TTU scanner, that ultrasonically scans composite parts produced in a manufacturing environment and generates a related scan image.
- Other types of scanners such as pulse echo (PE) scanners, for example, may also be employed.
- PE pulse echo
- the output of the scanner 16 is coupled by the network 26 to a scan image storage 14 which stores the scan images produced by the ultrasonic scanner 16.
- the scan image storage may be part of the ultrasonic scanner 16.
- One or more quality assurance (QA) client computers 12 coupled to the network 26 enables manufacturing personnel to enter data associated with a scan image.
- the server 20 links the scan image to the associated data record and stores the linked data and the scan image in a database 18 that is also coupled to the network 26.
- the server 20 administers the database 18 for the QTS.
- a plurality of quality tracking client computers 22 and 24 also coupled to the network 26 enable manufacturing and other personnel to access a pictorial display of a scan image and associated data linked to the image for previous and current composite parts.
- the quality tracking client computers 22 and 24 also enable manufacturing and other personnel to query the information stored in the database 18 and obtain a variety of reports including statistical and trend reports in both graphical and tabular form.
- the quality assurance client computers 12 and the quality tracking client computers 22, 24 may be the same computers.
- the quality assurance client 12, storage 14, scanner 16, database 18, server 20, and quality tracking clients 22 and 24 may be positioned remotely from each other at disparate locations and exchange data and images with each other over the network 26.
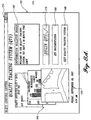
- FIGURE 2 is a high level functional flow diagram 100 that illustrates the steps implemented by the software included in a Quality Tracking System formed in accordance with this invention in a composite part manufacturing environment.
- the logic flow advances to a block 102 where a selected composite part is prepared for ultrasonic scanning. This involves positioning the part with respect to an ultrasonic scanner and wetting the part with a suitable wetting agent such as water. The water serves to couple the TTU or other scanner to the composite part.
- the logic shifts to a block 104 where the scanner 16 scans the composite part and produces one or more scan images thereof. (The part may be repositioned during scanning, if necessary.)
- the logic then advances to a block 106 where the scan image is stored in the scan image storage 14.
- Stepping to a block 108 the inspection data associated with the composite part is entered by quality assurance personnel and the entered data is linked to the scan image.
- the scan image is edited, which adds associated data to the scan image, and the edited scan image is stored in the database 18.
- the entered data associated with the composite part is displayed so that it can be verified by a quality assurance personnel. Obviously, blocks 104-112 are repeated as necessary.
- the logic then shifts to a block 114 where composite part data is manipulated to produce statistic and trend data that is stored in the database 18.
- the scan image of a composite part is retrieved from the database 18 and displayed.
- the stored data is retrieved (at the user's request) and manipulated further, as necessary, to generate statistic and trend data for the composite parts whose data is stored in the database 18, which is then displayed.
- a user may select for display a specific edited scan image or statistics or trends, as well as other data, for the composite parts whose data is entered into the QTS.
- the logic advances from block 118 to the end block.
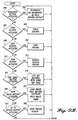
- FIGURE 3 is a functional flow diagram that illustrates in more detail the data entry step (block 108) of FIGURE 2.
- the logic moves to a block 120 where quality assurance (QA) data for the part scanned (block 104, FIGURE 2) is entered by quality assurance personnel.
- the QA data is entered via a window shown in FIGURE 9A and described below.
- the QA DATA RECORD is stored in the database 18.
- repair data associated with the composite part is entered by repair personnel.
- the repair data is entered via a window illustrated in FIGURE 11A and described below.
- the repair data is stored in the database 18.
- other data associated with the inspection of the composite part may be entered via other windows and the resulting records stored in the database 18.
- the logic shown in FIGURE 3 ends at block 122 and returns to the main logic flow illustrated in FIGURE 2 (block 110).
- FIGURE 4 is a functional flow diagram that illustrates in more detail the scan image editing step (block 110) of FIGURE 2).
- the logic steps to a block 124 where a user views the scan image of a composite part to identify the location of a defect.
- the displayed scan image is edited by adding a date, type, and alphanumeric identifier for the defect. Repair information may also be entered.
- FIGURE 33 (described below) is an exemplary illustration of a scan image that has been edited in the manner illustrated in FIGURE 4 and described above.
- the edited image of the composite part is stored in the database 18.
- the logic returns to the main logic flow shown in FIGURE 2 (block 112).
- FIGURE 5 is a functional flow diagram that illustrates in more detail the generate composite part statistic and trend data step (block 114) of FIGURE 2.
- the logic moves to a block 130 where historical trends and statistical information for a composite part are derived from the QA DATA RECORD and REPAIR RECORD information, stored in the database 18.
- the QA DATA RECORD and REPAIR RECORD information is collated and manipulated so that it can be quickly displayed in graphic or tabular from based on a user request.
- the generated historical trends and statistical information for the composite part are stored in the database 18.
- the logic then returns to the main logic flow shown in FIGURE 2 (block 116).
- FIGURE 6 is a functional flow diagram that illustrates in more detail the display scan image of selected composite part step (block 116) of FIGURE 2.
- the logic advances to a block 134 where the QTS is selected by a user.
- a QTS control center window that enables a user to select the QTS is shown in FIGURE 8A and described below.
- the user selects the QA DATA RECORD for a composite part to be displayed.
- the QA DATA RECORD for the composite part is displayed.
- block 140 after a QA DATA RECORD has been displayed, a user can select the edited scan image of a composite part for display.
- the edited scan image of the composite part is displayed.
- the logic returns to the main logic flow shown in FIGURE 2 (block 118).
- FIGURE 7 is a functional flow diagram that illustrates in detail the display composite part statistic and trend data step (block 118) of FIGURE 2.
- the logic moves to a block 142 when the QTS is selected by the user.
- a QTS control center window that enables a user to select the QTS is shown in FIGURE 8A and described below.
- the user selects the QA DATA RECORD for the composite part to be displayed.
- the QA DATA RECORD for the composite part is displayed.
- Stepping to a block 148 the user selects a historical trend graph of a composite part for display.
- the logic flows to a block 150 where the user selects a historical statistic of the composite part for display.
- the historical trends and statistics displays are selected by actuating various window buttons that are illustrated in FIGURES 9A, 11A, and 15A and described below.
- the logic returns to the main logic flow shown in FIGURE 2 (end block).
- the graphs and historical statistics generated by a QTS formed in accordance with the invention can take on a variety of forms.
- the displays which may take the forms of tables and graphs, may be based on user queries or may be based on regularly collated data.
- queries are identified by gray buttons
- graphical reports are identified by maroon buttons
- other reports are identified by dark blue background buttons. This color-coding scheme is designed to help the users to determine the nature of the output that will occur when a button is selected.
- the buttons are used to control the displaying of inspection load charts, part inspection yields, and trends. All windows and reports in a search or a query are referenced to the time clock of the QTS server computer.
- FIGURE 8A A QTS control center window included in one actual embodiment of the invention is illustrated in FIGURE 8A.
- the QTS control center window illustrated in FIGURE 8A includes an Information Bulletin Board 162 that informs users of options, new items, future updates, time limits, etc.
- the Information Bulletin Board will display a user's name and inform the user of previous data entry errors or new features.
- General information in the form of graphs 164 may also be displayed.
- the QTS includes on-line documentation that is accessed by pressing a button 166 labeled "QTS Documentation" in the QTS control center window.
- a button 168 labeled "Exit Quality Tracking System" in the QTS control center window closes the QTS.
- a QA DATA RECORD window When a button 170 in the QTS control center window labeled BEGIN QTS is actuated, a QA DATA RECORD window automatically appears in a read-only mode.
- An example of a QA DATA RECORD window is illustrated in FIGURES 9A and 9B and described below.
- the QTS control center window 160 may also include the current date and time 172 and conventional window minimize, maximize, and close buttons 174.
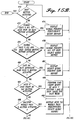
- FIGURE 8B is a functional flow diagram illustrating the operation of the QTS control center window shown in FIGURE 8A. Stepping from a start block, a test 176 is made to determine if the Begin QTS button 170 has been activated. If the Begin QTS button has been activated, a QA DATA RECORD window 178 is opened. If the Begin QTS button 170 has not been activated, a test 180 is made to determine if the QTS Documentation button 166 has been activated. If the QTS Documentation button 166 has been activated, the first page of QTS documentation 182 is displayed. If the QTS Documentation button has not been activated, a test 184 is made to determine if the Exit Quality Tracking System button 168 has been actuated.
- the Exit Quality Tracking System button 168 If the Exit Quality Tracking System button 168 has been activated, the QTS control center window is closed 186 and the process ends. If the Exit Quality Tracking System button 168 is not activated or when the QA DATA RECORD window is closed or the QTS documentation display ends, the process cycles to the Begin QTS button actuated test 176.
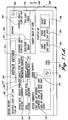
- QA DATA RECORD window (FIGURE 9A) preferably, only personnel with permission may add process of inspection data to QA DATA RECORD. Further, preferably, when a QA DATA RECORD is added to the QTS, all input fields in the record must be completed before the record will be saved. QA DATA RECORD are the stepping stones to all other records, queries, and reports. Preferably, if a QA DATA RECORD is deactivated, all related records are disabled. All process of inspection data is referenced from the QA DATA RECORDS. In the embodiment of the invention being described herein the QA DATA RECORD is a one-page form that combines QA inspection data and AUSS V operating parameters.
- the QA DATA RECORD window 188 illustrated in FIGURE 9A includes a plurality of data entry boxes via which permitted personnel can enter data. Some of the boxes include drop down lists for ease of data entry.
- the illustrated data entry boxes include: a Machine Number box (drop down list) 190; a Part Number box 192; a Reference BAC box (drop down list) 194; a Requalification # box (drop down list) 196; a Scan Description 1 box 198; a Scan Description 2 box 200; an NCR # box 202; a Comments box 204; a Scan Date box 206; an LMF TRK # box 208; a New Tool ?
- the QA DATA RECORD shown in FIGURE 9A may include fixed information, such as product family 234, Operator U # (entered automatically based on the identification of an operator entered at log on) 236; and a Log # (also entered automatically) 238, plus date information 240.
- the QA DATA RECORD window 188 also includes a Pass ? check box 242.
- the QA DATA RECORD window includes a number of "buttons" that are used to navigate through QA DATA RECORDS and cause other windows and records to be displayed. A user of the QTS does not need to operate any of these buttons to complete a QA DATA RECORD and cause it to be stored.
- buttons 244 At the far-left bottom of the QA DATA RECORD window are navigation control buttons 244.
- inner navigation control buttons 246 and 248 move up and down one record at a time.
- Outer navigation control buttons 250 and 252 move up or down a predetermined number of records.
- a center right arrow button 254 is used to start a new record.
- a number 256 to the right of the navigation buttons 244 is the total number of records.
- a number 258 inside of the navigation buttons is the position of the current record within the total number of records.
- the record number 258 is not necessarily the same as the Log # 238.
- the Log # 238 in the QA DATA RECORD window should match the Log # in the REPAIR RECORD window, illustrated in FIGURE 11A and described below.
- the Log # is a real number that is used for tracking purposes.
- the record number 258 in the navigation bar is relative to the number of records that are stored in the database.
- the record number does not include records that may have been archived and removed from the database; thus, neither the record number 258 or total number 256 have any relevant meaning.
- the first control button 260 identified by an eraser icon (UNDO)
- the UNDO button does not remove updates to a previously entered QA DATA RECORD.
- the second control button 262 identified by a disc icon (SAVE) saves the QA DATA RECORD.
- SAVE disc icon
- the third control button 264 identified by a binocular icon (FIND) enables a search engine. All users may use the FIND button to launch searches for a composite part, e.g., a search for an NCR #, Bake #, TKR #, part number, or date.
- a small button with a question mark 266 located near the CMF TKR # field of the QA DATA RECORD provides a quick query listing for all records with same CMF TKR #.
- This quick query button may be used by AUSS V operators and others to review previous entries in the database.
- FIGURE 10 is an exemplary illustration of a quick query listing display that occurs when the small button with a question mark 266 is activated.
- buttons 268 and 270 located in the middle right of the QA DATA RECORD are labeled VIEW IMAGE. Each button references an image name that is listed in the Image Name data box 222 or 224 located to the left of the button. When either button is selected, imaging software is loaded and the listed image is displayed.
- buttons 272 and 274 labeled GO TO REPAIR and MORE QUERIES are located above an analysis row of buttons.
- the GO TO REPAIR button 272 launches a REPAIR RECORD window shown in FIGURE 11A and described below.
- the MORE QUERIES button 274 launches a MORE QUERIES window shown in FIGURE 15A and described below.
- various fields in the REPAIR RECORD, part numbers, and part image may be directly referenced from the QA DATA RECORD form.
- the left four buttons titled PART TREND 1st INSP., PASS % 1st INSP ⁇ 60 DAYS, PASS % TOTAL ⁇ 60 DAYS, and AUSS V RUN cause reports of the type illustrated in FIGURES 21, 22, and 23 and described below to be displayed.
- the last two buttons on the right titled TREND GRAPHS 1st INSP. and TREND GRAPHS 1st INSP. (MONTHLY) cause trend graphs of the type illustrated in FIGURES 12 and 13 and described below to be displayed.
- FIGURES 9B and 9C are a functional flow diagram illustrating the operation of the various control buttons included in the QA DATA RECORD window shown in FIGURE 9A and described above.
- a test 300 is made to determine if one of the navigation buttons 244 have been actuated. If one of the navigation buttons have been actuated, the QA DATA RECORD display is incremented or decremented, as appropriate. See block 302. Then the process cycles to the navigation button activated test 300. If none of the navigation buttons have been actuated, a test 304 is made to determine if the UNDO button 260 has been actuated. If the UNDO button 260 has been actuated, the data in the QA DATA RECORD boxes is cleared. See block 306. Then the process cycles to the navigation button test 300.
- a test 308 is made to determine if the SAVE button 262 has been actuated. If the SAVE button has been actuated, the current QA DATA RECORD information is stored, provided the entered data is complete. See block 310. Then the process cycles to the navigation button test 300. If the SAVE button 262 has not been actuated, a test 312 is made to determine if the FIND button 264 has been actuated. If the FIND button has been actuated, a search engine is enabled. See block 314. When the search is complete and the search engine is closed, the process cycles to the navigation button actuated test 300.
- a test 316 is made to determine if the CMF TKR # ? button has been actuated. If the CMF TKR # ? button has been actuated, all records with the same CMF TKR number are listed. See block 318. When the display listing all records with the same CMF TKR number is closed, the process cycles to the navigation button actuated test 300.
- a test 320 is made to determine if one of the VIEW IMAGE buttons 268 or 270 has been actuated. If one of the VIEW IMAGE buttons has been actuated, image tool imaging software is loaded with the image name and the appropriate image displayed. While various imaging software can be utilized, one suitable software for images in a TIFF format is Image Tool Version 1.27 available from UTHSCSA (University of Texas Health Science Center, San Antonio, Texas). When the image display is closed, the process cycles to the navigation button actuated test 300.
- a test 324 is made to determine if the GO TO REPAIR button 272 has been actuated. If the GO TO REPAIR button has been actuated, the repair window illustrated in FIGURE 11 and described below is opened. See block 326. When the repair window is closed, the process cycles to the navigation button actuated test 300.
- a test 328 (FIGURE 9C) is made to determine if the MORE QUERIES button 274 has been actuated. If the MORE QUERIES button has been actuated, the MORE QUERIES window illustrated in FIGURE 15A and described below is opened. See block 330. When the MORE QUERIES window is closed, the process cycles to the navigation button actuated test 300.
- a test 332 is made to determine if the PART TREND 1st INSP. button 276 has been actuated. If the PART TREND 1st INSP. button 276 has been actuated, a display titled PART TREND 2: SELECT QUERY report is displayed. See block 334. An exemplary PART TREND 2: SELECT QUERY display is illustrated in FIGURE 21 and described below. When the PART TREND 2: SELECT QUERY report display is closed, the process cycles to the navigation button actuated test 300.
- a test 336 is made to determine if the PAST % 1st INSP. ⁇ 60 DAYS button 278 has been actuated. If the PAST % 1st INSP. ⁇ 60 DAYS button has been actuated, a display titled PERCENT: SELECT QUERY report is displayed. See block 338. An exemplary PERCENT: SELECT QUERY report display is illustrated in FIGURE 22 and described below. When the PERCENT: SELECT QUERY report display is closed, the process cycles to the navigation button actuated test 300. If the PAST % 1st INSP.
- a test 340 is made to determine if the PAST % TOTAL ⁇ 60 DAYS button 280 has been actuated. If the PAST % TOTAL ⁇ 60 DAYS button is actuated, the PERCENT: SELECT QUERY report (block 338) is displayed.
- a test 342 is made to determine if the AUSS V RUN button 282 is actuated. If the AUSS V RUN button is actuated, a display titled AUSS V RUN: SELECT QUERY report is displayed. See block 344. When the AUSS V RUN: SELECT QUERY report display is closed, the process cycles to the navigation button activated test 300.
- a test 346 is made to determine if the TREND GRAPHS 1st INSP. button 284 has been actuated. If the TREND GRAPHS 1st INSP. button has been actuated, a First Time Trend report is displayed. See block 348. An example of a FIRST TIME TREND report is illustrated in FIGURE 12 and described below. When the FIRST TIME TREND report display is closed, the process cycles to the navigation button actuated test 300.
- TREND GRAPHS 1st INSP. button 284 has not been actuated, a test 350 is made to determine if the TREND GRAPHS 1st INSP. (MONTHLY) button 286 has been actuated. If the TREND GRAPHS 1st INSP. (MONTHLY) button has been actuated, a MONTHLY PASS TREND report is displayed. See block 352. An example of a MONTHLY PASS TREND report is illustrated in FIGURE 13 and described below. When the MONTHLY PASS TREND report display is closed, the process cycles to the navigation button activated test 300. Likewise, if the TREND GRAPHS 1st INSP. (MONTHLY) button has not been actuated, the process cycles to the navigation button actuated test 300.
- Data entered into the REPAIR RECORD window 358 illustrated in FIGURE 11A and described next is saved with data entered in the QA DATA RECORD.
- the two windows are related by a common log number. They do not have common fields.
- the log number 360 of the exemplary REPAIR RECORD shown in FIGURE 11A is located to the right of a button 362 with a floppy disk icon (SAVE).
- the log number cannot be edited.
- the log number 238 of the QA DATA RECORD window cannot be edited. It is important to note that when the log numbers in both windows are not the same, the database is in need of repair.
- the REPAIR RECORD window opens in a read-only mode when called from the QA DATA RECORD form. Only personnel with write permission may modify the data in the REPAIR RECORD form.
- the REPAIR RECORD window 358 includes a plurality of data entry boxes, some of which include drop-down lists.
- the data entry boxes of the exemplary REPAIR RECORD window 358 illustrated in FIGURE 9A include a Repair Date box 364; a Repair Operator box 366; a Defect Type Found box (drop down list) 368; a TKR # box 370; a Repair NCR # box 372; a Defect Location box (drop down list) 374; a Repair Comments box 376; and an Other Defects box 378.
- the REPAIR RECORD window 358 may include other information, such as the current date 380 and standard view image titles 382, 384 such as Standard Image 1 315W1527-80L and Standard Image 2 315W1527-80R shown in the exemplary REPAIR RECORD window 358 shown in FIGURE 11A.
- the REPAIR RECORD window 358 includes a plurality of control buttons. Located in the upper-right corner of the REPAIR RECORD window is an exit button 386 that, when actuated, closes the REPAIR RECORD window. (All windows and displays other than the QA DATA RECORD window include a similar exit button. In order to avoid unnecessary duplication of description, such exit buttons are not further described in detail.)
- Standard Image 1 315W1527-80L and Standard Image 2 315W1527-80R descriptions are two control buttons 388 and 390 titled EDIT/VIEW IMAGE, one associated with each description.
- a bitmap image viewer such as the Microsoft Paint Win 95 Version 4.00.950 Standard Image View, is launched and the identified image displayed. The viewer will only function properly if a file is saved with the default name contained in the description positioned directly above the selected button. The image displayed by the bitmap image viewer may be annotated with other (i.e., repair) information.
- a control button 392 titled CAMERA IMAGE OF CORE launches a photo editor that displays a digital picture of a repaired core for the composite part.
- the photo editor may contain up to four files loaded under the file menu of the photo editor.
- a suitable photo editor program is Microsoft Photo Editor Version 96101200.
- a three-button 394, 396 and 398 group is located on the bottom right side of the REPAIR RECORD window.
- the left-most button 394 labeled PART TREND (ALL INSP.) causes a 10-part trend analysis display that includes all re-inspections to occur.
- This display titled PART TREND: SELECT QUERY is substantially similar to a similarly identified button in the QA DATA RECORD window and is described below.
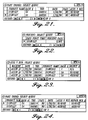
- An example of a PART TREND: SELECT QUERY display is shown in FIGURE 24 and described below.
- the middle button 396 labeled TREND GRAPHS ALL INSP.
- a Rework Trend display occurs.
- An example of a Rework Trend display is illustrated in FIGURE 14 and described below.
- the right side button 398 labeled SELECT IMAGE opens a window (not shown) that allows an operator to type in any image name listed in the records and view the image.
- FIGURE 11B is a functional flow diagram illustrating the operation of the REPAIR RECORD window illustrated in FIGURE 11A and described above.
- the process shifts from a start block to a test 400 to determine if the exit button has been actuated. If the exit button 386 has been actuated, the process ends and the program cycles to the QA DATA RECORD window illustrated in FIGURE 9A and described above. If the exit button has not been actuated, a test 402 is made to determine if one of the EXIT/VIEW IMAGE buttons 388 or 390 has been actuated. If one of the EXIT/VIEW IMAGE buttons has been actuated, the bitmap image viewer is launched, as described above. See block 404. When the bitmap image viewer is closed, the process cycles to the exit button actuated test 400.
- a test 406 is made to determine if the CAMERA IMAGE OF CORE button 390 has been actuated. If the CAMERA IMAGE OF CORE button has been actuated, the photo editor program is launched and a digital image of the repaired core assembly is displayed. See block 408. When the photo editor program is closed, the process cycles to the exit button actuated test 400.
- a test 410 is made to determine if the SAVE button 362 has been actuated. If the SAVE button has been actuated, the updated record is saved. See block 412. After the updated record is saved, the process cycles to the exit button actuated test 400.
- a test 414 is made to determine if the PART TREND (ALL INSP.) button 394 has been actuated. If the PART TREND (ALL INSP.) button has been actuated, a PART TREND: SELECT QUERY report is displayed. An example of a PART TREND: SELECT QUERY report is illustrated in FIGURE 24 and described below. When the PART TREND: SELECT QUERY report display is closed, the process cycles to the exit button actuated test 400.
- a test 418 is made to determine if the TREND GRAPHS (ALL INSP.) button 396 has been actuated. If the TREND GRAPHS (ALL INSP.) button has been actuated, a rework trend report is displayed. See block 420. An example of a rework trend report is illustrated in FIGURE 14 and described below. When the rework trend report display is closed, the process cycles to the exit button actuated test 400. If the TREND GRAPHS (ALL INSP.) button 396 has not been actuated, a test 422 is made to determine if the SELECT IMAGE button 398 has been actuated.
- a SELECT IMAGE window is opened. See block 424.
- the process cycles to the exit button actuated test 400.
- FIGURE 12 An example of a first time trend report is illustrated in FIGURE 12. This report is displayed when the TREND GRAPHS 1st INSP.
- button 284 in the QA DATA RECORD window 188 (FIGURE 9A) is actuated.
- An exit button 426 is located at the top-right corner of the FIRST TIME TREND report. When actuated, the exit button 426 closes the FIRST TIME TREND report.
- the FIRST TIME TREND report provides a graphical view of a 10-part trend (or less if 10 parts have not been manufactured) and defects found in the past 60 days.
- the latest TKR # Part Serial #
- TKR # inspected is located on the right side.
- FIGURE 13 An example of a MONTHLY PASS TREND report is shown in FIGURE 13. This report is displayed when the TREND GRAPHS 1st INSP. (MONTHLY) button 286 in the QA DATA RECORD window 188 (FIGURE 9A) is actuated. An exit button 428 is located at the top-right corner of the MONTHLY PASS TREND report.
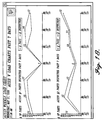
- the MONTHLY PASS TREND report displays a graphical view of the past month's inspection pass percentages for the composite part identified in the part number box 194 of the QA DATA RECORD window 188. Two graphs are included, one showing the number of parts (panels) produced during the months shown in the report, and the other showing the number of parts that passed inspection. The current month is listed on the left of both charts in the MONTHLY PASS TREND report. At the far right side of the report is located the beginning month stored in the database. Preferably, the graphs are for the current year.
- FIGURE 14 An example of a REWORK TREND report is shown in FIGURE 14. This report is displayed when the TREND GRAPHS (ALL RUNS) button 396 in the REPAIR RECORD window 358 (FIGURE 11A) is actuated. An exit button 430 is positioned at the top-right corner of the REWORK TREND report.
- This report includes a graphical view of the 10-part trend (including all reruns) and defects found in the past 60 days for the composite part, or less than 10 if less than 10 parts have been manufactured. The latest TKR # is disposed on the left of the top graph and the tenth (or less) TKR # inspected is found on the right of the REWORK TREND report. Information older than 60 days is accessed using buttons displayed in the QA DATA RECORD window and described below.
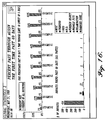
- a MORE QUERIES and other window 432 is illustrated in FIGURE 15A. This window is displayed when the MORE QUERIES button 274 in the QA DATA RECORD 188 (FIGURE 9A) is actuated.
- the MORE QUERIES and other window 432 includes three rows of control buttons and an exit button 434. In general, the top row buttons relate to queries, the middle row buttons relate to reports, and the bottom row buttons relate to printouts.
- a button labeled IMAGE TOOL located at the end of the middle row launches an image viewer.
- the exit button 434 is positioned in the top right corner of the MORE QUERIES and other window.
- the first row of the MORE QUERIES and other window 432 includes six buttons 434, 436, 438, 440, and 442 titled, respectively: GLOBAL PASS % ALL 1st AUSS V INSP. 60 DAYS, GLOBAL PASS % ALL AND 1st INSP. (ENTER MONTH), LAST 60 DAYS AUTOCLAVE BAKE PASS %, AUSS V LOAD CHART BY DAY, MACHINE WEEKLY PASS %, and REJECTIONS PAST 60 DAYS.
- buttons 434, 436, 438, 440, and 442 titled, respectively: GLOBAL PASS % ALL 1st AUSS V INSP. 60 DAYS, GLOBAL PASS % ALL AND 1st INSP. (ENTER MONTH), LAST 60 DAYS AUTOCLAVE BAKE PASS %, AUSS V LOAD CHART BY DAY, MACHINE WEEKLY PASS %, and REJ
- the second row buttons of the MORE QUERIES and other window 432 also includes six buttons 446, 448, 450, 452, 454, and 456 titled, respectively: GLOBAL PASS % 1st INSP. 60 DAYS; GLOBAL GRAPHS DEFECTS, ALL INSP. 60 DAYS; AUSS V GRAPHS LOAD CHART BY DAY; 1st AUSS V GRAPHS LOAD CHART BY MONTH; ALL AUSS V GRAPHS LOAD CHART BY MONTH; and IMAGE TOOL.
- a suitable report is displayed. Examples of such reports are illustrated in FIGURES 16-20 and described below.
- the last row of the MORE QUERIES and other window 432 also includes six buttons 458, 460, 462, 464, 466 and 468 titled, respectively: PRINT PASS BAKE % LAST 60 DAYS, PRINT 10 PART TREND 1st INSP., PRINT 10 PART TREND ALL INSP., PRINT AUSS V RUNS, PRINT PASS % - 1st INSP., and PRINT PASS % ALL INSP.
- buttons 458, 460, 462, 464, 466 and 468 titled, respectively: PRINT PASS BAKE % LAST 60 DAYS, PRINT 10 PART TREND 1st INSP., PRINT 10 PART TREND ALL INSP., PRINT AUSS V RUNS, PRINT PASS % - 1st INSP., and PRINT PASS % ALL INSP.
- FIGURES 15B, 15C, and 15D are a functional flow diagram illustrating the operation of the MORE QUERIES and other window 432 illustrated in FIGURE 15A.
- the process begins with a test 470 to determine if the exit button 434 has been actuated. If the exit button has been actuated, the process ends and the MORE QUERIES and other window 432 closes. If the exit button has not been actuated, a test 472 is made to determine if the GLOBAL PASS % ALL 1st AUSS V INSP. 60 DAYS button 434 has been actuated. If the GLOBAL PASS % ALL 1st AUSS V INSP.
- a GLOBAL % FIRST: SELECT QUERY report is displayed. See block 434.
- the process cycles to the exit button actuated test 470.
- a test 476 is made to determine if the GLOBAL PASS % ALL AND 1st INSP. (ENTER MONTH) button 436 has been actuated. If the GLOBAL PASS % ALL AND 1st INSP. (ENTER MONTH) button has been actuated, a GLOBAL % ALL 1ST INSP.: SELECT QUERY reports, examples of which are illustrated in FIGURES 26-29 and described below, are sequentially displayed. When the GLOBAL % ALL 1ST INSP: SELECT QUERY reports are closed, the process cycles to the exit button actuated test 470.
- a test 480 is made to determine if the LAST 60 DAYS AUTOCLAVE BAKE PASS % button 438 has been actuated. If the LAST 60 DAYS AUTOCLAVE BAKE PASS % button has been actuated, a SELECT QUERY: PERCENT BAKE report is displayed. See block 482. An example of a SELECT QUERY: PERCENT BAKE report is illustrated in FIGURE 30 and described below. When the SELECT QUERY: report display is closed, the process cycles to the exit button actuated test 470. If the LAST 60 DAYS AUTOCLAVE BAKE PASS % button has not been
- a test 484 is made to determine if the AUSS V LOAD CHART BY DAY button 440 has been actuated. If the AUSS V LOAD CHART BY DAY button has been actuated, a Load Chart Query of AUSS V SYSTEM 1 and 2 INSPECTION LOADS FOR THE LAST WEEK is performed. Thereafter, the process cycles to the exit button actuated test 470.
- a test 488 is made to determine if the MACHINE WEEKLY PASS % button has been actuated. If the MACHINE WEEKLY PASS % button is actuated, a AUSS V # 1 WEEKLY PASS PERCENTAGES: SELECT QUERY report is displayed. See block 490. An example of a AUSS V WEEKLY PASS PERCENTAGES SELECT QUERY report is illustrated in FIGURE 31 and described below. After the AUSS V #1 WEEKLY PASS PERCENTAGES: SELECT QUERY report is closed, the process cycles to the exit button actuated test 470.
- a test 492 (FIGURE 15C) is made to determine if the REJECTIONS PAST 60 DAYS button 444 has been actuated. If the REJECTIONS PAST 60 DAYS button has been actuated, a REJECTIONS PAST 60 DAYS SELECT QUERY report is displayed. See block 494. An example of a REJECTIONS PAST 60 DAYS: SELECT QUERY report is illustrated in FIGURE 32 and described below.
- a test 496 is made to determine if the GLOBAL GRAPHS PASS % 1st INSP. 60 DAYS button 446 has been actuated. If the GLOBAL GRAPHS PASS % 1st INSP. 60 DAYS button has been actuated, a GLOBAL STATISTICS 2 report is displayed. See block 498. An example of a GLOBAL STATISTICS 2 report is illustrated in FIGURE 16 and described below.
- the test 500 is made to determine if the GLOBAL GRAPHS DEFECTS ALL INSP. 60 DAYS button 448 has been actuated. If the GLOBAL GRAPHS DEFECTS ALL INSP. 60 DAYS button has been actuated, a GLOBAL STATISTICS report is displayed. See block 502. An example of a GLOBAL STATISTICS report is illustrated in FIGURE 17 and is described below. When the GLOBAL STATISTICS report is closed, the process cycles to the exit button actuated test 470.
- a test 504 is made to determine if AUSS V GRAPHS LOAD CHARTS BY DAY button 450 has been actuated. If the AUSS V GRAPHS LOAD CHARTS BY DAY button has been actuated, an AUSS V WEEKLY LOAD CHART report is displayed. See block 506. An example of an AUSS V WEEKLY LOAD report is illustrated in FIGURE 18 and described below.
- a test 508 is made to determine if the FIRST AUSS V GRAPHS LOAD CHART BY MONTH button 452 has been actuated. If the FIRST AUSS V GRAPHS LOAD CHART BY MONTH button has been actuated, an AUSS V MONTHLY LOAD CHART report is displayed. See block 510. An example of an AUSS V MONTHLY LOAD CHART report is illustrated in FIGURE 19 and described below. When the AUSS V MONTHLY LOAD CHART report display is closed, the process cycles to the exit button actuated test 470.
- a test 512 is made to determine if the ALL AUSS V GRAPHS LOAD CHART BY MONTH button 454 has been actuated. If the ALL AUSS V GRAPHS LOAD CHART BY MONTH button has been actuated, an AUSS V MONTHLY LOAD CHART 2 report is displayed. See block 514. An example of an AUSS V MONTHLY LOAD CHART 2 report is illustrated in FIGURE 20 and described below. When the AUSS V MONTHLY LOAD CHART 2 report display is closed, the process cycles to the exit button actuated test 470.
- a test 516 is made to determine if the IMAGE TOOL button 456 has been actuated. If the IMAGE TOOL button 456 has been actuated, the IMAGE TOOL program is launched. See block 518. When the IMAGE TOOL program is closed, the process cycles to the exit button actuated test 470.
- a test 520 (FIGURE 15D) is made to determine if the PRINT PASS BAKE % LAST 60 DAYS button 458 has been actuated. If the PRINT PASS BAKE % LAST 60 DAYS button has been actuated, a BAKE PASS PERCENTAGES report is printed. See block 522. Thereafter, the process cycles to the exit button actuated test 470. If the PRINT PASS BAKE % LAST 60 DAYS button 458 has not been actuated, a test 524 is made to determine if the PRINT 10 PART TREND 1st INSP. button 460 has been actuated. If the PRINT 10 PART TREND 1st INSP. button has been actuated, a FIRST TIME TREND report is printed. See block 526. Thereafter, the process cycles to the exit button actuated test.
- a test 528 is made to determine if the PRINT 10 PART TREND ALL INSP. button 462 has been actuated. If the PRINT 10 PART TREND ALL INSP. button has been actuated, a REWORK TREND report is printed. See block 530. Thereafter, the process cycles to the exit button actuated test 470.
- a test 532 is made to determine if the PRINT AUSS V RUNS button 464 has been actuated. If the PRINT AUSS V RUNS button has been actuated, an AUSS V RUNS FOR DATE SPECIFIED report is printed. See block 534. Thereafter, the process cycles to the exit button actuated test 470. If the PRINT AUSS V RUNS button 464 has not been actuated, a test 536 is made to determine if the PRINT PASS % - 1st INSP. button 466 has been actuated. If the PRINT PASS %-1st INSP. button has been actuated, a Last 60 Days of AUSS V 1st Time Inspection Results Reference From Part Number Or Current Record is printed. See block 538. Thereafter, the process cycles to the exit button actuated test 470.
- a test 540 is made to determine if the PRINT PASS % ALL INSP. button 468 has been actuated. If the PRINT PASS % ALL INSP. button has been actuated, a Last 60 Days of AUSS V 1st Time Insp. Results Referenced From The Part Number On The Current Record Including Reinspections is printed. See block 542. Thereafter, or if the PRINT PASS % ALL INSP. button 468 has not been actuated, the process cycles to the exit button actuated test 470.
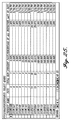
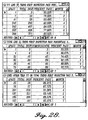
- FIGURE 16 is an example of a Global Statistics 2 report that is displayed when the GLOBAL GRAPHS PASS % 1st INSP. 60 DAYS button 446 of the MORE QUERIES and other window 432 is actuated. An exit button is located in the top-right corner of the GLOBAL STATISTICS 2 report.
- the GLOBAL STATISTICS 2 report contains two charts. The top chart is a bar graph that shows the 10 highest defect parts (by percentages of pass vs. total inspected) in the past 60 days. The bottom chart shows the 10 most common defect types that have been identified. Preferably, the graphed inspection pass percentages are derived from a sample of at least five composite part global records occurring in the past 60 days.
- FIGURE 17 is an example of a GLOBAL STATISTICS report that is displayed when the GLOBAL GRAPHS DEFECTS, ALL INSP. 60 DAYS button 448 in the MORE QUERIES and other window 432 (FIGURE 15A) is actuated. An exit button is positioned at the top-right corner of the global statistics form.
- the Global Statistics report includes two charts. The charts display a graphical view showing the 10 highest defective composite parts in the past 60 days and highest defect types (up to 10) that have been identified.
- FIGURE 18 is an example of an AUSS V WEEKLY LOAD CHART report that is displayed when the AUSS V GRAPHS LOAD CHART BY DAY button 440 in the MORE QUERIES and other window 432 is actuated.
- An exit button is positioned at the top right corner of the AUSS V weekly load chart report.
- This report includes two graphs showing the inspection results for two automated ultrasonic scanning systems identified as AUSS V System 1 and AUSS V System 2 for the past week. The graphs include two lines, the upper line showing the number of parts inspected and the lower line showing the number of parts that passed the inspection.
- the AUSS V weekly load chart report is based solely on the number of parts inspected and does not consider the size in part square feet or the speed of inspection.
- a report is displayed that shows the types of parts that were inspected on a given day.
- the AUSS V weekly load chart can be compared to the OEE record to determine if a system had been down on a particular day for maintenance or repairs.
- FIGURE 19 is an example of a AUSS V MONTHLY LOAD CHART report that is displayed when the 1st AUSS V GRAPHS LOAD CHART BY MONTH button 452 in the MORE QUERIES and other window 432 is actuated.
- An exit button is positioned at the top-right corner of the AUSS V MONTHLY LOAD CHART report.
- This report includes two graphs, one for the AUSS V system 1 and one for the AUSS V system 2 that show inspection loads of the past months for first time inspected parts.
- the graphs include two lines, the upper line shows the number of parts inspected, and the lower line shows the number of parts that passed the inspection. This report is based on the number of parts inspected and entered into the database per month.
- FIGURE 20 is an example of a AUSS V MONTHLY LOAD CHART 2 report that is displayed when the ALL AUSS V GRAPHS LOAD CHART BY MONTH button 454 in the MORE QUERIES and other window 432 is actuated.
- An exit button is positioned at the top-right corner of the AUSS V MONTHLY LOAD CHART 2 report.
- This report also includes two graphs, one for the AUSS V system 1 and the other for the AUSS V system 2, that show the number of parts inspected per month for the past several months, including reinspections.
- the graphs include two lines: the upper line shows the number of parts inspected and the lower line shows the number of parts that passed the inspection.
- the AUSS V MONTHLY LOAD CHART 2 report is based on the number of parts inspected and entered into the database per month.
- the result indicates how many composite parts were re-inspected.
- the percentage of rework can be determined by dividing the result of this subtraction by the total indicated in the AUSS V MONTHLY LOAD CHART 2 report.
- the composite parts are not weighted according to size or inspection time.
- Queries are complex filters that are designed to extract data from a table stored in a software database. Query filters quickly extract information that could be prone to human error or next to impossible to manually extract. Queries are powerful and their outputs can be used to draw graphs or exported to other spreadsheets for further evaluation.
- the QTS uses queries to draw graphs, print reports, and calculate percentage yield for composite parts. Since techniques for creating queries are well known to those familiar with software databases, such techniques are not described here. Rather, only the results of queries are described.
- buttons are used for data analysis and queries of the records stored in the QTS database related to the displayed QA DATA RECORD.
- the PART TREND 1st INSP. button 276 causes a PART TREND 2: SELECT QUERY report to be displayed. An example of such a report is shown in FIGURE 21.
- the PART TREND 2: SELECT QUERY report is a table that includes a number of columns--for example, Product Name, Dash #, TKR #, Date (Inspection), Pass (yes/no), AUSS V NCR #, etc.
- the TKR # directly referenced to the current QA DATA RECORD and all dash numbers related to the part number are displayed.
- the button identified by the binocular icon may be used to search for the QA DATA RECORD with the desired part number.
- Actuation of the PASS % 1st INSP. ⁇ 60 DAYS. button 278 of the QA DATA RECORD window 188 causes the last 60 days of first time inspection results relating to the part number of the current QA DATA RECORD to be accessed and a PERCENT: SELECT QUERY report to be displayed.
- An example search report is illustrated in FIGURE 22.
- Actuation of the PASS % TOTAL ⁇ 60 DAYS. button functions in a similar manner, the difference being that reinspection results as well as first time inspection results are accessed to create the PERCENT SELECT: QUERY report that is displayed.
- a date search criteria window for AUSS V inspections (not shown) that requests a range of dates to search the QA DATA RECORDS for the first time pass of the AUSS V inspection opens, e.g., "DateFrom ; DateTo .” Based on the inputted dates, the query will return all part numbers within the search dates and indicate the inspection results.
- FIGURE 23 An example of the report produced as a result of such a query is illustrated in FIGURE 23.
- a window (not shown) opens.
- an image file name in appropriate form is entered, the image is displayed.
- the preferred image file name form is TIFF. Obviously the image must be stored on the database 18 (FIGURE 1) in order to be retrieved.
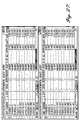
- the first query creates a report titled GLOBAL PERCENT ALL 1ST INSP: SELECT QUERY, an example of which is shown in FIGURE 26.
- This query samples the inspection data for all composite parts stored in the database and returns a tabular report that shows pass percentages of all first time inspections sorted by ascending part numbers.
- the second and third queries are substantially the same as the first query except that the second query is for the entered month and the third query is for all inspections. Examples of the reports resulting from these queries are illustrated in FIGURE 27. Examples of the reports resulting from the fourth, fifth, and sixth queries are displayed in FIGURE 28. These reports show first time inspections by month and line number (Production Model) of finished assemblies. Interim inspections of subcomponents for the final assembly are not considered.
- FIGURE 29 illustrates the reports resulting from the seventh and eighth queries. These reports show the results of first inspections and all inspections by the month. The seventh query report equals the sum of the fourth, fifth, and sixth queries report.
- AUSS V LOAD CHART BY DAY button 440 of the MORE QUERIES and other window 432 (FIGURE 15A) is actuated, a query of AUSS V system 1 and 2 inspection loads for a past week occurs and a load chart (not shown) is displayed. This query is based on the number of parts inspected and does not take into the consideration the size of the parts in square feet or inspection speed.
- the AUSS V RUN button 282 in the QA DATA RECORD window 188 may be used to launch a query to determine what types of parts were run for a given day. The report resulting from this query may be compared to the OBE record to determine if a system had been down on that day for maintenance and repairs.
- a query is launched and a report of the type shown in FIGURE 32 is displayed.
- the report shows part rejections that occurred in the past 60 days.
- the report includes information such as date, NCR #, TKR #, INSP. #, LOG #, PART #, # of Defects and other information, all in tabular form.
- Reports are directly tied to the query buttons described above and the QTS enables the results of the queries to be displayed in a readable format as graphs and tables.
- the report information is referenced from the QA DATA RECORD window or REPAIR RECORD window.
- the references in these windows help save time and eliminate operator input error. Reports may be tailored to fit a need if all of the necessary information is available via the QA DATA RECORD and REPAIR RECORD windows.
- the easiest way to search for information is to select the button identified with the binocular icon in the QA DATA RECORD window.
- actuating the binocular button will call a search engine that prompts for a search string and a direction to search, i.e., either up or down.
- the search string may include a TKR #, NCR #, bake #, image #, and part number. Because a user will most often begin at the last record entered, most searches will be directed upwards.
- FIGURE 33 is an exemplary embodiment of a scan image that has been edited to include data associated with the composite part. As described above, the location of defects are explicitly identified on the edited scan image of the composite part, and the date, type, and alphanumeric identifier for each deficiency are inserted so as to be clearly visible.
- the invention is implemented by using commercially available software modules to accomplish the various major functions of the invention.
- suitable software modules produced by the Microsoft Corporation, Redmond, Washington, are as follows: SOFTWARE MODULE VERSION USE Microsoft Access 97 Ver. 8.0.3512 QTS database engine Microsoft Paint Ver. 4.00.950 Standard images (BMP) Microsoft Photo Editor Ver. 96101200 Camera images of core (JPG) Microsoft Graph Ver. 8.0 Trend graphs Microsoft Word Ver. 8.0 Help document viewer
- the invention can be used with scan images of the components for a composite part.
- the invention can also be used with scan images of composite parts in situ, as opposed to during manufacture, if desired.
Landscapes
- Physics & Mathematics (AREA)
- Analytical Chemistry (AREA)
- General Health & Medical Sciences (AREA)
- Health & Medical Sciences (AREA)
- Life Sciences & Earth Sciences (AREA)
- Chemical & Material Sciences (AREA)
- Pathology (AREA)
- Biochemistry (AREA)
- Immunology (AREA)
- General Physics & Mathematics (AREA)
- Acoustics & Sound (AREA)
- Signal Processing (AREA)
- Engineering & Computer Science (AREA)
- Management, Administration, Business Operations System, And Electronic Commerce (AREA)
- General Factory Administration (AREA)
Applications Claiming Priority (4)
| Application Number | Priority Date | Filing Date | Title |
|---|---|---|---|
| US9489098P | 1998-07-31 | 1998-07-31 | |
| US94890P | 1998-07-31 | ||
| US361666 | 1999-07-27 | ||
| US09/361,666 US6549820B1 (en) | 1998-07-31 | 1999-07-27 | Method and system for providing feedback from a non-destructive inspection of a composite part |
Publications (3)
| Publication Number | Publication Date |
|---|---|
| EP0977055A2 true EP0977055A2 (de) | 2000-02-02 |
| EP0977055A3 EP0977055A3 (de) | 2004-03-03 |
| EP0977055B1 EP0977055B1 (de) | 2008-09-24 |
Family
ID=26789310
Family Applications (1)
| Application Number | Title | Priority Date | Filing Date |
|---|---|---|---|
| EP99202500A Expired - Lifetime EP0977055B1 (de) | 1998-07-31 | 1999-07-29 | Verfahren zur Lieferung einer Rückinformation von einer zerstörungsfreien Prüfung eines Verbundteils |
Country Status (4)
| Country | Link |
|---|---|
| US (1) | US6549820B1 (de) |
| EP (1) | EP0977055B1 (de) |
| CA (1) | CA2279439A1 (de) |
| DE (1) | DE69939613D1 (de) |
Cited By (3)
| Publication number | Priority date | Publication date | Assignee | Title |
|---|---|---|---|---|
| WO2002031489A1 (en) * | 2000-10-10 | 2002-04-18 | General Electric Company | Automated ultrasonic inspection planning |
| EP1304606B1 (de) * | 2001-09-07 | 2006-06-07 | General Electric Company | Systemen und Verfahren zur Koordinierung von Quälitätssicherungsereignissen |
| WO2008057385A1 (en) * | 2006-11-02 | 2008-05-15 | The Boeing Company | Remote nondestructive inspection systems and methods |
Families Citing this family (20)
| Publication number | Priority date | Publication date | Assignee | Title |
|---|---|---|---|---|
| JP4261683B2 (ja) * | 1999-06-10 | 2009-04-30 | 東芝テック株式会社 | 情報処理システムと情報処理方法 |
| CN1433534A (zh) * | 2000-01-29 | 2003-07-30 | Abb研究有限公司 | 求出生产设备效率、故障事件和故障事件原因的系统和方法 |
| JP2002002915A (ja) * | 2000-06-21 | 2002-01-09 | Ebara Corp | 流体機械に含まれる部品の管理方法、該部品の発注方法及び該部品の管理システム |
| US7069263B1 (en) * | 2002-02-19 | 2006-06-27 | Oracle International Corporation | Automatic trend analysis data capture |
| JP4155496B2 (ja) * | 2002-04-25 | 2008-09-24 | 大日本スクリーン製造株式会社 | 分類支援装置、分類装置およびプログラム |
| US11680867B2 (en) | 2004-06-14 | 2023-06-20 | Wanda Papadimitriou | Stress engineering assessment of risers and riser strings |
| US11710489B2 (en) | 2004-06-14 | 2023-07-25 | Wanda Papadimitriou | Autonomous material evaluation system and method |
| US20060081135A1 (en) * | 2004-08-16 | 2006-04-20 | Britton Douglas F | Industrial overline imaging system and method |
| US20070078618A1 (en) * | 2005-09-30 | 2007-04-05 | Honeywell International, Inc. | Method and system for enabling automated data analysis of multiple commensurate nondestructive test measurements |
| JP2007148749A (ja) * | 2005-11-28 | 2007-06-14 | Fujifilm Corp | 仕様修正装置および仕様修正プログラム |
| US9123189B2 (en) * | 2007-02-12 | 2015-09-01 | The Boeing Company | System and method for point-of-use instruction |
| US20080281455A1 (en) * | 2007-05-11 | 2008-11-13 | Kenneth Swegman | Materials, Operations and Tooling Interface and Methods for Managing a Remote Production Facility |
| US7912568B2 (en) * | 2007-11-27 | 2011-03-22 | International Business Machines Corporation | Tuning order configurator performance by dynamic integration of manufacturing and field feedback |
| US8521480B2 (en) * | 2009-03-12 | 2013-08-27 | Etegent Technologies, Ltd. | Managing non-destructive evaluation data |
| US8108168B2 (en) | 2009-03-12 | 2012-01-31 | Etegent Technologies, Ltd. | Managing non-destructive evaluation data |
| US9864366B2 (en) | 2013-03-15 | 2018-01-09 | Etegent Technologies Ltd. | Manufacture modeling and monitoring |
| US11543811B2 (en) | 2013-03-15 | 2023-01-03 | Etegent Technologies Ltd. | Manufacture modeling and monitoring |
| US20160132893A1 (en) * | 2014-11-12 | 2016-05-12 | Donald Lee Bisges | System and method for returned goods management |
| US10636064B2 (en) * | 2015-12-31 | 2020-04-28 | VeriPhase, Inc. | Method for monetization of the data processing of ultrasonic scan data files |
| CN114238042A (zh) * | 2021-12-21 | 2022-03-25 | 建信金融科技有限责任公司 | 一种运维数据的展示方法及装置 |
Family Cites Families (25)
| Publication number | Priority date | Publication date | Assignee | Title |
|---|---|---|---|---|
| US4141347A (en) | 1976-09-21 | 1979-02-27 | Sri International | Real-time ultrasonic B-scan imaging and Doppler profile display system and method |
| GB2141607A (en) | 1983-06-15 | 1984-12-19 | Philips Electronic Associated | Video display system with index pages |
| US4872130A (en) | 1985-05-17 | 1989-10-03 | Pagano Dominick A | Automated in-line pipe inspection system |
| US4803639A (en) * | 1986-02-25 | 1989-02-07 | General Electric Company | X-ray inspection system |
| US4827423A (en) * | 1987-01-20 | 1989-05-02 | R. J. Reynolds Tobacco Company | Computer integrated manufacturing system |
| JP2719152B2 (ja) | 1988-07-30 | 1998-02-25 | 日立建機株式会社 | 超音波探傷装置 |
| US5146556A (en) | 1988-10-11 | 1992-09-08 | Next Computer, Inc. | System and method for managing graphic images |
| US5027110A (en) | 1988-12-05 | 1991-06-25 | At&T Bell Laboratories | Arrangement for simultaneously displaying on one or more display terminals a series of images |
| US5088045A (en) * | 1990-01-02 | 1992-02-11 | Honda Giken Kogyo Kabushiki Kaisha | Production management system |
| KR910017313A (ko) * | 1990-03-19 | 1991-11-05 | 미다 가쓰시게 | 통합품질관리방법 및 시스템 |
| JP2588050B2 (ja) | 1990-06-29 | 1997-03-05 | 日立建機株式会社 | 超音波映像検査装置 |
| IL125217A (en) | 1990-12-04 | 1999-10-28 | Orbot Instr Ltd | Apparatus and method for microscopic inspection of articles |
| US5475613A (en) | 1991-04-19 | 1995-12-12 | Kawasaki Jukogyo Kabushiki Kaisha | Ultrasonic defect testing method and apparatus |
| US5235272A (en) | 1991-06-17 | 1993-08-10 | Photon Dynamics, Inc. | Method and apparatus for automatically inspecting and repairing an active matrix LCD panel |
| US5383021A (en) | 1993-04-19 | 1995-01-17 | Mectron Engineering Company | Optical part inspection system |
| US5608814A (en) | 1993-08-26 | 1997-03-04 | General Electric Company | Method of dynamic thresholding for flaw detection in ultrasonic C-scan images |
| US5640199A (en) | 1993-10-06 | 1997-06-17 | Cognex Corporation | Automated optical inspection apparatus |
| US5469353A (en) | 1993-11-26 | 1995-11-21 | Access Radiology Corp. | Radiological image interpretation apparatus and method |
| US5511005A (en) * | 1994-02-16 | 1996-04-23 | Ade Corporation | Wafer handling and processing system |
| US5734742A (en) | 1994-09-19 | 1998-03-31 | Nissan Motor Co., Ltd. | Inspection system and process |
| US5541846A (en) * | 1994-10-24 | 1996-07-30 | Secrest; Edgar A. | Self-improving work instruction system |
| JP3325737B2 (ja) | 1995-03-09 | 2002-09-17 | 本田技研工業株式会社 | 品質管理データ処理装置 |
| US5761064A (en) * | 1995-10-06 | 1998-06-02 | Advanced Micro Devices, Inc. | Defect management system for productivity and yield improvement |
| US6259960B1 (en) * | 1996-11-01 | 2001-07-10 | Joel Ltd. | Part-inspecting system |
| TW331650B (en) * | 1997-05-26 | 1998-05-11 | Taiwan Semiconductor Mfg Co Ltd | Integrated defect yield management system for semiconductor manufacturing |
-
1999
- 1999-07-27 US US09/361,666 patent/US6549820B1/en not_active Expired - Lifetime
- 1999-07-29 EP EP99202500A patent/EP0977055B1/de not_active Expired - Lifetime
- 1999-07-29 DE DE69939613T patent/DE69939613D1/de not_active Expired - Lifetime
- 1999-07-30 CA CA002279439A patent/CA2279439A1/en not_active Abandoned
Cited By (6)
| Publication number | Priority date | Publication date | Assignee | Title |
|---|---|---|---|---|
| WO2002031489A1 (en) * | 2000-10-10 | 2002-04-18 | General Electric Company | Automated ultrasonic inspection planning |
| EP1304606B1 (de) * | 2001-09-07 | 2006-06-07 | General Electric Company | Systemen und Verfahren zur Koordinierung von Quälitätssicherungsereignissen |
| WO2008057385A1 (en) * | 2006-11-02 | 2008-05-15 | The Boeing Company | Remote nondestructive inspection systems and methods |
| GB2456698A (en) * | 2006-11-02 | 2009-07-29 | Boeing Co | Remote nondestructive inspection systems and methods |
| GB2456698B (en) * | 2006-11-02 | 2011-12-07 | Boeing Co | Remote nondestructive inspection systems and methods |
| US8255170B2 (en) | 2006-11-02 | 2012-08-28 | The Boeing Company | Remote nondestructive inspection systems and methods |
Also Published As
| Publication number | Publication date |
|---|---|
| EP0977055A3 (de) | 2004-03-03 |
| CA2279439A1 (en) | 2000-01-31 |
| DE69939613D1 (de) | 2008-11-06 |
| EP0977055B1 (de) | 2008-09-24 |
| US6549820B1 (en) | 2003-04-15 |
Similar Documents
| Publication | Publication Date | Title |
|---|---|---|
| US6549820B1 (en) | Method and system for providing feedback from a non-destructive inspection of a composite part | |
| US5586252A (en) | System for failure mode and effects analysis | |
| US6018716A (en) | Apparatus and method for analysis of continuous process lines | |
| US5800181A (en) | Computer system and method for process safety management | |
| CN112330303A (zh) | 智能化项目评估协同管理系统 | |
| EP1501029A2 (de) | System zum Verwalten und Inspizieren von Anlagen und Verfahren dazu | |
| JP3982451B2 (ja) | レビュー支援装置、方法及びプログラム | |
| DE10351332A1 (de) | Wareneingangs-, Inspektions- und Berichtsystem | |
| US5765038A (en) | Integration of groupware with the integrated quality control methodology via facilitated work sessions | |
| US20050108232A1 (en) | Electronic submittal method and system | |
| EP1657610A2 (de) | System und Verfahren zum Verwalten und Inspizieren von Anlagen | |
| US20020016797A1 (en) | Network based interviewing and processing system | |
| US20060031092A1 (en) | Automated IP tracking system and method | |
| JP2003050905A (ja) | ワークフロー管理装置およびワークフローシステム、ワークフロー管理プログラムならびにそれを記録したコンピュータ読み取り可能な記録媒体 | |
| JP2002021327A (ja) | 施工検査システム、施工検査情報表示装置、および建築物の施工検査方法 | |
| JP2003015720A (ja) | 工程管理装置 | |
| US7103615B2 (en) | Process evaluation distributed system | |
| Cottrell | Document management: one paving stone in the path to HER | |
| US20240232802A9 (en) | Structured analysis relating to deadline driven project management | |
| Almaazmi | LSS Application To Improve MEC Process In Local Maintenance Firm: A Case Study. | |
| CN119359257A (zh) | 一种多角色文档评审系统及方法 | |
| CN119153051A (zh) | 巡检系统、巡检设备与巡检方法 | |
| GB2358722A (en) | Automated follow through on user goals | |
| CN120580087A (zh) | 基于互联网的动物饲养巡检方法、装置及计算机设备 | |
| AU1820300A (en) | Method and system for returned-material control |
Legal Events
| Date | Code | Title | Description |
|---|---|---|---|
| PUAI | Public reference made under article 153(3) epc to a published international application that has entered the european phase |
Free format text: ORIGINAL CODE: 0009012 |
|
| AK | Designated contracting states |
Kind code of ref document: A2 Designated state(s): AT BE CH CY DE DK ES FI FR GB GR IE IT LI LU MC NL PT SE |
|
| AX | Request for extension of the european patent |
Free format text: AL;LT;LV;MK;RO;SI |
|
| RIC1 | Information provided on ipc code assigned before grant |
Ipc: 7G 05B 19/418 B Ipc: 7G 06F 19/00 B Ipc: 7G 06F 17/60 B Ipc: 7G 01N 29/22 B Ipc: 7G 01N 29/06 B Ipc: 7G 01S 17/89 A |
|
| PUAL | Search report despatched |
Free format text: ORIGINAL CODE: 0009013 |
|
| AK | Designated contracting states |
Kind code of ref document: A3 Designated state(s): AT BE CH CY DE DK ES FI FR GB GR IE IT LI LU MC NL PT SE |
|
| AX | Request for extension of the european patent |
Extension state: AL LT LV MK RO SI |
|
| 17P | Request for examination filed |
Effective date: 20040819 |
|
| AKX | Designation fees paid |
Designated state(s): DE FR GB |
|
| 17Q | First examination report despatched |
Effective date: 20050518 |
|
| GRAP | Despatch of communication of intention to grant a patent |
Free format text: ORIGINAL CODE: EPIDOSNIGR1 |
|
| RIC1 | Information provided on ipc code assigned before grant |
Ipc: G05B 19/418 20060101ALI20080408BHEP Ipc: G06F 19/00 20060101ALI20080408BHEP Ipc: G01N 29/22 20060101ALI20080408BHEP Ipc: G01N 29/06 20060101AFI20080408BHEP |
|
| RTI1 | Title (correction) |
Free format text: METHOD FOR PROVIDING FEEDBACK FROM A NON-DESTRUCTIVE INSPECTION OF A COMPOSITE PART |
|
| GRAS | Grant fee paid |
Free format text: ORIGINAL CODE: EPIDOSNIGR3 |
|
| GRAA | (expected) grant |
Free format text: ORIGINAL CODE: 0009210 |
|
| AK | Designated contracting states |
Kind code of ref document: B1 Designated state(s): DE FR GB |
|
| REG | Reference to a national code |
Ref country code: GB Ref legal event code: FG4D |
|
| REF | Corresponds to: |
Ref document number: 69939613 Country of ref document: DE Date of ref document: 20081106 Kind code of ref document: P |
|
| PLBE | No opposition filed within time limit |
Free format text: ORIGINAL CODE: 0009261 |
|
| STAA | Information on the status of an ep patent application or granted ep patent |
Free format text: STATUS: NO OPPOSITION FILED WITHIN TIME LIMIT |
|
| 26N | No opposition filed |
Effective date: 20090625 |
|
| REG | Reference to a national code |
Ref country code: FR Ref legal event code: PLFP Year of fee payment: 18 |
|
| REG | Reference to a national code |
Ref country code: FR Ref legal event code: PLFP Year of fee payment: 19 |
|
| REG | Reference to a national code |
Ref country code: FR Ref legal event code: PLFP Year of fee payment: 20 |
|
| PGFP | Annual fee paid to national office [announced via postgrant information from national office to epo] |
Ref country code: DE Payment date: 20180727 Year of fee payment: 20 Ref country code: FR Payment date: 20180726 Year of fee payment: 20 |
|
| PGFP | Annual fee paid to national office [announced via postgrant information from national office to epo] |
Ref country code: GB Payment date: 20180727 Year of fee payment: 20 |
|
| REG | Reference to a national code |
Ref country code: DE Ref legal event code: R071 Ref document number: 69939613 Country of ref document: DE |
|
| REG | Reference to a national code |
Ref country code: GB Ref legal event code: PE20 Expiry date: 20190728 |
|
| PG25 | Lapsed in a contracting state [announced via postgrant information from national office to epo] |
Ref country code: GB Free format text: LAPSE BECAUSE OF EXPIRATION OF PROTECTION Effective date: 20190728 |