EP1005833B1 - Verfahren und Gerät zur automatischen Kompensierung von Zeit-Verstärkung und/oder Seitenintensität-Verstärkung bei der B-Mode Ultraschallbildgebung - Google Patents
Verfahren und Gerät zur automatischen Kompensierung von Zeit-Verstärkung und/oder Seitenintensität-Verstärkung bei der B-Mode Ultraschallbildgebung Download PDFInfo
- Publication number
- EP1005833B1 EP1005833B1 EP99309576A EP99309576A EP1005833B1 EP 1005833 B1 EP1005833 B1 EP 1005833B1 EP 99309576 A EP99309576 A EP 99309576A EP 99309576 A EP99309576 A EP 99309576A EP 1005833 B1 EP1005833 B1 EP 1005833B1
- Authority
- EP
- European Patent Office
- Prior art keywords
- kernels
- mean
- pixel intensity
- gain
- recited
- Prior art date
- Legal status (The legal status is an assumption and is not a legal conclusion. Google has not performed a legal analysis and makes no representation as to the accuracy of the status listed.)
- Expired - Lifetime
Links
- 238000000034 method Methods 0.000 title claims description 17
- 238000012285 ultrasound imaging Methods 0.000 title claims description 9
- 239000013598 vector Substances 0.000 claims description 16
- 238000012545 processing Methods 0.000 claims description 10
- 238000002604 ultrasonography Methods 0.000 claims description 9
- 238000003384 imaging method Methods 0.000 claims description 5
- 230000005540 biological transmission Effects 0.000 claims 1
- 230000006870 function Effects 0.000 description 17
- 238000013507 mapping Methods 0.000 description 9
- 210000001519 tissue Anatomy 0.000 description 7
- 238000006243 chemical reaction Methods 0.000 description 5
- 230000001419 dependent effect Effects 0.000 description 5
- 238000004364 calculation method Methods 0.000 description 3
- 230000003247 decreasing effect Effects 0.000 description 3
- 238000001514 detection method Methods 0.000 description 3
- 230000000747 cardiac effect Effects 0.000 description 2
- 238000013461 design Methods 0.000 description 2
- 238000010586 diagram Methods 0.000 description 2
- 230000000694 effects Effects 0.000 description 2
- 230000004044 response Effects 0.000 description 2
- 239000000523 sample Substances 0.000 description 2
- 239000007787 solid Substances 0.000 description 2
- 238000012935 Averaging Methods 0.000 description 1
- 230000004913 activation Effects 0.000 description 1
- 238000004458 analytical method Methods 0.000 description 1
- 230000017531 blood circulation Effects 0.000 description 1
- 230000006835 compression Effects 0.000 description 1
- 238000007906 compression Methods 0.000 description 1
- 238000002592 echocardiography Methods 0.000 description 1
- 238000001914 filtration Methods 0.000 description 1
- 210000005003 heart tissue Anatomy 0.000 description 1
- 238000010191 image analysis Methods 0.000 description 1
- 238000012986 modification Methods 0.000 description 1
- 230000004048 modification Effects 0.000 description 1
- 238000013139 quantization Methods 0.000 description 1
- 230000035945 sensitivity Effects 0.000 description 1
- 230000003595 spectral effect Effects 0.000 description 1
- 230000001360 synchronised effect Effects 0.000 description 1
- 238000012549 training Methods 0.000 description 1
- 238000012546 transfer Methods 0.000 description 1
- 230000009466 transformation Effects 0.000 description 1
Images


Classifications
-
- A—HUMAN NECESSITIES
- A61—MEDICAL OR VETERINARY SCIENCE; HYGIENE
- A61B—DIAGNOSIS; SURGERY; IDENTIFICATION
- A61B8/00—Diagnosis using ultrasonic, sonic or infrasonic waves
-
- G—PHYSICS
- G01—MEASURING; TESTING
- G01S—RADIO DIRECTION-FINDING; RADIO NAVIGATION; DETERMINING DISTANCE OR VELOCITY BY USE OF RADIO WAVES; LOCATING OR PRESENCE-DETECTING BY USE OF THE REFLECTION OR RERADIATION OF RADIO WAVES; ANALOGOUS ARRANGEMENTS USING OTHER WAVES
- G01S7/00—Details of systems according to groups G01S13/00, G01S15/00, G01S17/00
- G01S7/52—Details of systems according to groups G01S13/00, G01S15/00, G01S17/00 of systems according to group G01S15/00
- G01S7/52017—Details of systems according to groups G01S13/00, G01S15/00, G01S17/00 of systems according to group G01S15/00 particularly adapted to short-range imaging
- G01S7/52023—Details of receivers
- G01S7/52033—Gain control of receivers
Definitions
- This invention generally relates to B-mode ultrasound imaging of biological tissues.
- the invention relates to methods for fine tuning a B-mode ultrasound image by adjusting the gain setting as a function of the axial and/or lateral position.
- two-dimensional images of tissue are created in which the brightness of a pixel is based on the intensity of the echo return.
- gain adjustments provide overall image changes.
- the gain is typically adjusted after beamforming and before signal processing, i.e., prior to envelope detection.
- Gain adjustment in the axial direction known as “time gain compensation” (TGC)
- TGC time gain compensation
- LGC lateral gain compensation
- LGC can be used to adjust the gain setting as a function of lateral position.
- the TGC block at the output of the beamformer is basically a depth-dependent gain control designed to compensate the received signal to correct for the attenuation caused by tissues at increasing depths. It is often set based on a nominal tissue attenuation factor (e.g., 0.5 dB/cm-MHz) and beam diffraction losses as a function of depth.
- the objective is to produce uniform tissue image brightness from the near field to the far field.
- the tissue attenuation properties may deviate from the assumed constant factor (or an application-dependent internal TGC curve), and may vary significantly with depth, especially if macroscopic structures and reflectors are present. Further, if the far-field regions are very noisy, it is desirable to suppress their pixel intensities for best overall image presentation.
- TGC adjustment is usually provided via a column of "slide pots" (potentiometers) or rotary knobs on the front panel, for different depth zones.
- the externally adjusted TGC for different depth zones is usually graphically displayed as a TGC curve in the monitor display.
- the TGC graphic is generated, for example, by a graphic processor as an overlay to the image display.
- LGC For cardiac sector imaging, the cardiac tissues/borders that run parallel to the ultrasound beam often do not produce strong echoes. Therefore, in addition to TGC, LGC adjustment has also proven useful for boosting cardiac borders within selected image sectors, while leaving the chambers dark. LGC allows the user to control gain in the lateral plane by adjusting the gain setting as a function of lateral position. For example, gain is controlled in small user-selected sectors across the image. LGC can be implemented at the same point as TGC in the B-mode processing path. A graph of the LGC curve similar to the TGC curve is also often displayed on the video monitor.
- a system according to the preamble of claim 1 is known from US 5 477 858.
- state-of-the-art scanners provide the user with a host of selectable imaging parameters, including transmit frequency, acoustic output, external TGC and LGC controls, frame averaging level, dynamic range, edge-enhancing filters and video gray mapping, all of which can significantly affect the sensitivity, uniformity and feature enhancements of an image
- the sonographer usually does not have the time (or training) to fully optimize all the available controls.
- the present invention is a method for automating the external TGC and/or LGC adjustments based on the B-mode image data.
- the automatic gain adjustments are aimed at equalizing the mean signal intensities-along the axial (for TGC) and/or lateral (for LGC) direction of the image, and suppressing any lateral band (for TGC) and/or sector (for LGC) that contains mostly noise.
- This automatic gain adjustment feature will reduce TGC or LGC adjustment time.
- the automatic TGC/LGC adjustment method is implemented in software on a digital scanner.
- the TGC/LGC functions are implemented between the beamformer and B-mode processor.
- the TGC/LGC functions can be implemented in the analog front-end before the beamformer or after B-mode detection.
- the acoustic or R - ⁇ data (before scan conversion) is stored in cine memory.
- the automatic TGC/LGC algorithm of the present invention can support all such standard architectural variations.
- the automatic TGC/LGC adjustment method uses a noise model of the entire B-mode processing chain from the beamformer through the B-mode processor to the back-end video processor.
- the noise model utilizes the fact that the primary noise source in a digital scanner lies in the front-end electronics (pre-amplifier), which can be modeled as white Gaussian noise whose RMS amplitude can be calibrated accurately (for normal operating temperature).
- the noise model can be used to predict the exact noise statistics (mean and probability distribution) in the B-mode image for any combination of internal (preset) TGC/LGC curve and front-panel gain settings.
- an image frame of display pixel intensity values is divided into a regular grid of kernels by the host computer.
- the host computer retrieves the current settings of all pertinent gain-related parameters for each kernel.
- a noise model is used to predict the mean noise level in each kernel.
- the host computer calculates the mean (or total) pixel intensity and compares that to the predicted mean (or total) noise.
- mean means average.
- Signal is deemed present in a kernel if its mean display pixel intensity is significantly above the predicted noise level. Otherwise the kernel is considered to contain only noise. For each row (sector), the kernels which contain signal are counted.
- the host computer determines the mean display pixel intensity, i.e., "row (sector) mean", of all kernels that contain signal (i.e. excluding kernels that do not contain signal). Based on a given optimal mean gray-scale level for the B-mode image display, the host computer then determines the gain adjustment for each row (sector) which will shift the gray-scale level (based on the current gray map settings) corresponding to the row (sector) mean to the optimal gray-scale level.
- the required gain adjustment can be computed in decibels using the noise model, which should take into account the current dynamic range and gray map settings.
- the gain adjustment is then applied to the raw acoustic data (RF or baseband) for each row (sector) to equalize the row (sector) means across the entire image.
- the row (sector) gain can be automatically reduced to suppress the noise.
- either or both of the TGC and the LGC can be automated.
- FIG. 1 An ultrasound imaging system in accordance with one preferred embodiment of the invention is generally depicted in FIG. 1.
- the main data path begins with the analog RF inputs to the beamformer board 4 from the transducer 2.
- the beamformer board 4 comprises a beamformer, a demodulator and filters.
- the beamformer's signal inputs are the low-level analog RF signals from the transducer elements.
- the beamformer is responsible for analog-to-digital conversion and for transmit and receive beamforming.
- the demodulator receives the acquired data samples and outputs two summed digital baseband I and Q receive beams. These acoustic data samples are derived from the reflected ultrasound from respective focal zones of the transmitted beams.
- the I and Q acoustic data from the demodulator is sent to respective FIR filters which are programmed with filter coefficients to pass a band of frequencies preferably centered at the fundamental frequency f 0 of the transmit waveform or a (sub)harmonic frequency thereof.
- vectors of filtered I and Q acoustic data are input to a TGC/LGC block 6, which provides time gain and/or lateral gain compensation.
- Time gain compensation fine tunes the image in the axial direction by increasing or decreasing gain as a function of depth (time) for all received vectors.
- Lateral gain compensation fine tunes the image in the lateral direction by increasing or decreasing gain as a function of lateral position (beam or vector position). In the former case, gain is controlled in small rows of the image. In the latter case, gain is controlled in small sectors of the image.
- Each I and Q vector input to TGC/LGC block 6 corresponds to a respective receive beam.
- block 6 applies depth-dependent digital gains to an acoustic data vector.
- block 6 applies angle-dependent digital gains to respective vectors of acoustic data.
- successive vectors are input to TGC/LGC block 6 for gain compensation.
- a respective gain can be automatically applied to each point along a vector, the gain being a function of depth (i.e., range R ) and vector angle (i.e., transmit beam angle ⁇ ).
- the acoustic data output from the TGC/LGC block is sent to the B-mode processor 8.
- the B-mode processor 8 converts the I and Q acoustic data from TGC/LGC block 6 into a log-compressed version of the signal envelope.
- the B-mode function images the time-varying amplitude of the envelope of the signal as a gray scale.
- the envelope of a baseband signal is the magnitude of the vector which I and Q represent.
- the I,Q phase angle is not used in the B-mode display.
- the magnitude (i.e., intensity) of the signal is the square root of the sum of the squares of the orthogonal components, i.e. , ( I 2 + Q 2 ) 1/2 .
- the B-mode intensity data is output to a scan converter 10 comprising a B-mode acoustic line memory followed by an X-Y display memory (not shown).
- the acoustic line memory accepts the processed vectors of B-mode intensity data and interpolates where necessary.
- the B-mode acoustic line memory also performs the coordinate transformation of the B-mode intensity data from polar coordinate ( R- ⁇ ) sector format or Cartesian coordinate linear format to appropriately scaled Cartesian coordinate display pixel intensity data, which is stored in the X-Y display memory.
- the scan-converted frames are passed to a video processor 12, which maps the pixel intensity data to a gray-scale mapping for video display.
- a conventional ultrasound imaging system typically employs a variety of gray maps, which are simple transfer functions of the raw intensity data to display gray-scale levels.
- the gray-scale image frames are then sent to the display monitor 14 for display.
- the B-mode images displayed by monitor 14 are produced from an image frame of data in which each datum indicates the intensity or brightness of a respective pixel in the display.
- An image frame may, e.g., comprise a 256 ⁇ 256 data array in which each display pixel intensity datum is an 8-bit binary number that indicates pixel brightness.
- Each pixel has an intensity value which is a function of the backscatter cross section of a respective sample volume in response to interrogating ultrasonic pulses and the gray map employed.
- the displayed image represents the tissue and/or blood flow in a plane through the body being imaged.
- Successive frames of display pixel intensity data are stored in a cine memory 20 on a first-in, first-out basis.
- the cine memory stores the pixel intensity data which has already been combined with the TGC and all other graphic data.
- the cine memory also stores the pixel intensity data which is already converted in the first portion of the video processor into video frame rate, but before gray mapping. Storage can be continuous or as a result of an external trigger event.
- the cine memory 20 is like a circular image buffer that runs in the background, capturing image data that is displayed in real time to the user. When the user freezes the system (by operation of an appropriate device on the operator interface 18), the user has the capability to view image data previously captured in cine memory.
- System control is centered in a host computer 16, which accepts operator inputs through the operator interface 18 (e.g., a control panel) and in turn controls the various subsystems.
- the host computer 16 performs system level control functions.
- a system control bus (not shown) provides the interface from the host computer to the subsystems.
- a scan controller (not shown) provides real-time (acoustic vector rate) control inputs to the various subsystems.
- the scan controller is programmed by the host computer with the vector sequences and synchronization options for acoustic frame acquisitions. Thus, the scan controller controls the beam distribution and the beam density.
- the scan controller transmits the beam parameters defined by the host computer to the subsystems via a scan control bus (not shown).
- the conventional system has the capability to superimpose graphical symbols on any ultrasound image.
- the superimposition of graphics on the image frame is accomplished in the video processor 12, which receives the ultrasound image frame from the X-Y display memory in the scan converter 10 and the graphics data from a graphics display memory (not shown).
- the graphics data is processed and input into the graphics display memory by a graphics processor 22 which is synchronized with the other subsystems by the host computer.
- the automated TGC/LGC adjustment method can be implemented in software by the host computer.
- One key component of the method is a noise model of the entire B-mode processing chain from the beamformer through the B-mode processor to the back-end video processor.
- the image noise model is used to predict the noise level (as a B-mode intensity or gray-scale level) at that position.
- the image noise model consists of several key components, the details of which depend on the specific subsystem design for a particular scanner. The noise/gain calculations involved in each component are standard practices in systems design, so only the main function of each component are described in the following.
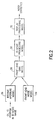
- a B-mode image noise model suitable for use in the preferred embodiment of the invention is generally depicted in FIG. 2.
- the front-end noise model (block 24) computes the Gaussian noise level generated by the front-end electronics (e.g., the pre-amplifier) in a single receive channel and any quantization noise associated with analog-to-digital conversion.
- the analog electronics noise is often referred to as thermal noise and can be calibrated accurately for a given temperature range.
- the thermal noise may or may not have a flat spectral power density.
- the number of receive channels contributing noise is dependent on the receive aperture size, which is computed by the receive aperture model (block 26) based on the known aperture control parameters (i.e., F number and shading) for the given probe and ( x, y ) position.
- the front-end gain model (block 28) computes the total noise from all independent receive channels, and incorporates the effects of all filtering gains in the beamformer, including any TGC/LGC.
- the B-mode processing model (block 30) adjusts the noise for the noise gains that occur in the B-mode detector and filters including scan conversion.
- Standard noise theory indicates that the detected envelope of Gaussian noise obeys the Rayleigh probability distribution, which is completely specified by its mean.
- the display processing model (block 32) accounts for the effects of logarithmic compression and gray mapping, and outputs the predicted noise distribution at the inputted ( x, y ) position in the image.
- the above-described noise model is run by the host computer.
- the host computer Prior to running the noise model, the host computer needs to read out all pertinent internal and external system settings, such as the current TGC curve, transmit focal zone positions, image depth, display dynamic range setting and gray mapping setting. The host computer then feeds these parameters into the various components of the image noise model.
- the host computer also performs the automatic TGC/LGC algorithm. It is assumed that an image of the region of interest is currently displayed on the video monitor.
- the automatic TGC/LGC can be activated via a single button (or soft-key).
- the main steps in the TGC/LGC algorithm in accordance with one preferred embodiment are outlined as follows.
- the image is frozen momentarily to allow one to several most recent image frames to be saved to cine memory, which can then be read out by the host computer for analysis. If more than one is used, a mean is taken to reduce statistical variations before image analysis.
- the size of the image (single or mean) is determined, and is then divided into a regular grid 34 of kernels 36 as shown in FIG. 3, where the number of rows and sectors (columns) of kernels in the grid should be at least as large as the number of the respective TGC and LGC knobs/slide pots on the front panel.
- the kernel dimensions are defined by equal range and vector angle spacings for a sector or curvilinear scan (as shown in FIG. 3), and they are rectangles or squares for a linear scan.
- the host computer retrieves the current settings of all pertinent gain-related parameters, such as internal TGC, receive aperture and B-mode processor gains, for each kernel within the grid. These can usually be read out from other system programs or computed from known system parameters. These parameter values are input to the noise model to predict the mean noise level in each kernel of the grid.
- gain-related parameters such as internal TGC, receive aperture and B-mode processor gains
- the host computer compares the mean (or total) pixel intensity to the predicted mean (or total) noise. Signal is present if the mean pixel intensity of a kernel is significantly (e.g., 10 dB) above the predicted mean noise level for that same kernel. Otherwise the kernel is considered to contain noise only.
- the kernels which contain signal are counted. If this number is less than a certain threshold (e.g., 10% of the total number of kernels in a row), then that row is classified as "mostly noise.”
- a certain threshold e.g. 10% of the total number of kernels in a row
- the mean pixel intensity of all kernels that contain signal i.e. excluding kernels that do not contain signal is computed. This gives the "row mean", which can be converted to a gray-scale level by the host computer referring to the current gray mapping settings.
- the host computer Based on a given optimal mean gray-scale level for the B-mode image display (e.g., for an 8-bit video gray scale, the optimal mean gray-scale level may be 200), the host computer then determines the gain adjustment for each row which will shift the row mean gray-scale level to the optimal gray-scale level.
- the gain adjustment required can be computed using the noise model, which should take into account the current dynamic range and gray map settings. In fact, it should be exactly equivalent to adjusting the external TGC knobs, which may affect the front-end and/or B-mode processor gains depending on the system architecture.
- the gain adjustments for each row are applied in block 6 (see FIG. 1) to equalize the row means across the entire image.
- the row gain can be automatically turned down to suppress the noise (by shifting down its mean gray-scale level by a fixed amount or shifting it down towards zero gray-scale level).
- the procedure is exactly parallel to that for automatic TGC described above.
- the kernels which contain signal are counted. If this number is less than a certain threshold (e.g., 10% of the total number of kernels in a sector or column), then that sector (column) is classified as "mostly noise.”
- a certain threshold e.g. 10% of the total number of kernels in a sector or column
- the mean pixel intensity of all kernels that contain signal i.e., excluding kernels that do not contain signal
- This gives the "sector (column) mean” which can be converted to a gray-scale level by the host computer referring to the current gray mapping settings.
- the host computer determines the gain adjustment for each sector (column) which will shift the sector (column) mean gray-scale level to the optimal gray-scale level. Again the required gain adjustment is computed using the noise model, taking into account the current dynamic range and gray map settings. Again, this should be exactly equivalent to adjusting the external LGC knobs.
- the gain adjustments for each sector (column) are applied in block 6 (see FIG. 1) to equalize the sector (column) means across the entire image. Again, for those sectors (columns) which have been classified as "mostly noise," the sector (column) gain can be automatically turned down to suppress the noise.
- the graphics processor 22 supplies graphic data to the video processor 12 for display on the monitor 14.
- This graphic data is designed to indicate the magnitudes of the automatic gain adjustments and the corresponding relative positions in the image.
- the graphic data take the form of TGC and LGC curves.
- the TGC curve and LGC curve graphics in the display monitor are updated automatically by the graphics processor.
- a different line-type can be used to display the automatic TGC and LGC curves so they can be distinguished from the curves corresponding to the TGC and LGC slide pot positions. For example, if automatic TGC is activated, a solid curve can be used to display the active TGC curve and a dashed line for the manually set TGC curve. If automatic TGC is turned off, the dashed curve reverts back to a solid curve to indicate that the slide-pot TGC curve is now active again.
- automatic TGC and LGC are both applied by the host computer to control gain in the lateral and axial planes.
- the host may apply only one or the other type of gain compensation.
- the automated TGC/LGC functions of the invention are not limited to being implemented between the beamformer and B-mode processor, but instead can be implemented in the analog front-end before the beamformer or after B-mode detection.
- the invention is not limited to processing of display intensity data.
- the automatic TGC/LGC algorithm can be applied to the raw acoustic data instead of the display intensity data.
- acoustic data refers to the received signal at any point between the transducer and the scan converter;
- pixel intensity data refers to the scan-converted signals prior to gray mapping; and
- gray-scale level data refers to the gray-mapped pixel intensity data output to the display device.
- kernel having signal means a kernel having a mean pixel intensity which is greater than the predicted mean noise level for that same kernel by a predetermined quantity. It will also be appreciated that calculation of the total pixel intensity value within a kernel is the equivalent of calculation of the mean pixel intensity, as recited in the claims.
Landscapes
- Health & Medical Sciences (AREA)
- Life Sciences & Earth Sciences (AREA)
- Engineering & Computer Science (AREA)
- Physics & Mathematics (AREA)
- Surgery (AREA)
- Animal Behavior & Ethology (AREA)
- Radiology & Medical Imaging (AREA)
- Nuclear Medicine, Radiotherapy & Molecular Imaging (AREA)
- Biomedical Technology (AREA)
- Heart & Thoracic Surgery (AREA)
- Medical Informatics (AREA)
- Molecular Biology (AREA)
- Biophysics (AREA)
- Pathology (AREA)
- General Health & Medical Sciences (AREA)
- Public Health (AREA)
- Veterinary Medicine (AREA)
- Computer Networks & Wireless Communication (AREA)
- General Physics & Mathematics (AREA)
- Radar, Positioning & Navigation (AREA)
- Remote Sensing (AREA)
- Ultra Sonic Daignosis Equipment (AREA)
- Image Processing (AREA)
- Image Analysis (AREA)
Claims (20)
- System zur Abbildung von biologischen Geweben, aufweisend:ein Ultraschallwandlerarray (2) mit mehreren Wandlerelementen;einen Sendestrahlformer (4) zur Impulssteuerung des Wandlerarrays, um Ultraschallstrahlen in ersten und zweiten Scans zu senden;einen Empfangsstrahlformer (4) zum Ausbilden von Empfangsstrahlen akustischer Daten, die aus Echosignalen gewonnen werden, die durch das Wandlerarray anschließend an die Aussendungen detektiert werden ;eine Signalverarbeitungskette (6, 8, 10) zum Umwandeln der akustischen Daten in den ersten beziehungsweise zweiten Scans entsprechende erste und zweite Bildframe von Pixelintensitätsdaten, wobei die Signalverarbeitungskette eine Verstärkungskompensationskomponente (6) aufweist, um die Verstärkung der akustischen Daten als eine Funktion von Verstärkungseinstellungen anzupassen;einen Computer (16), der dafür programmiert ist, die Verstärkungseinstellungen als eine Funktion des ersten Bildframes von Bildintensitätsdaten und der aktuellen Einstellungen aller zugehörigen verstärkungsbezogenen Systemparameter gemäß einem Rauschmodell zu ermitteln, und die Verstärkungseinstellungen an die Verstärkungskompensationskomponente rechtzeitig zu liefern, um die Verstärkung der von dem zweiten Scan erfassten akustischen Daten anzupassen;einen Videoprozessor (12) zum Umwandeln des Bildframes von Pixelintensitätsdaten in einen Bildframe mit Grauskalenstufedaten; undeine Anzeigevorrichtung (14) zum Anzeigen eines dem Bildframe aus Grauskalenstufendaten repräsentierenden Bildes; unddadurch gekennzeichnet, dass:der Computer dafür programmiert ist, die nachstehenden Schritte auszuführen:(a) Unterteilen des ersten Bildframes von Pixelintensitätsdaten in ein reguläres Gitter von Kernels (36), die mehrere Sätze ausgerichteter Kernels ausbilden;(b) Abrufen der aktuellen Einstellungen aller zugehörigen verstärkungsbezogenen Parameter für jeden Kernel;(c) Vorhersagen des mittleren Rauschpegels in jedem Kernel unter Verwendung des Rauschmodells;(d) Berechnen der mittleren Pixelintensität für jeden Kernel;(e) Vergleichen des vorhergesagten mittleren Rauschpegels mit der berechneten mittleren Pixelintensität für jeden Kernel;(f) für jeden Kernelsatz, Zählen der Kernels mit einer um eine vorbestimmte Größe größeren mittleren Pixelintensität als der vorhergesagte mittlere Rauschpegel, um einen Zählwert von Kernels mit Signal zu erzeugen,(g) für jeden Kernelsatz, dessen Zählwert von Kernels gleich oder größer als ein kritischer Schwellenwert ist, Berechnen einer mittleren Pixelintensität aller Kernels mit Signal, um einen Kernelsatzmittelwert zu erzeugen;(h) auf der Basis eines optimalen mittleren Grauskalenwertes, Ermitteln der Verstärkungseinstellung für jeden Kernelsatz, welche den Grauskalenwert entsprechend dem jeweiligen Kernelsatzmittelwert zu dem optimalen Grauskalenwert verschiebt; und(i) Senden der Verstärkungseinstellungen an die Verstärkungskompensationskomponente.
- System nach Anspruch 1, wobei der Computer ferner dafür programmiert ist, die entsprechende Abwärtsverstärkungseinstellung zu ermitteln, welche das Rauschen für jeden Kernelsatz unterdrückt, dessen Zählwert von Kernels mit Signal kleiner als ein kritischer Schwellenwert ist.
- System nach Anspruch 1, wobei die Unterteilung des ersten Bildframes von Pixelintensitätsdaten in ein regelmäßiges Gitter von Kernels, die mehrere Sätze ausgerichteter Kernels ausbilden, den Schritt der Unterteilung des ersten Bildframes mit Bildintensitätsdaten in ein reguläres Gitter von mehrere Reihen ausbildenden Kernels umfasst.
- System nach Anspruch 3, wobei der Schritt (f) für jede eine vorbestimmte Bedingung erfüllende Reihe das Ermitteln einer mittleren Pixelintensität aller Kernels mit Signal umfasst, um einen Zeilenmittelwert zu erzeugen; und der Schritt (g) das Ermitteln der Verstärkungseinstellung für jede Reihe umfasst, welche den der jeweiligen Reihe entsprechenden Grauskalenwert auf den optimalen Grauskalenwert verschiebt.
- System nach Anspruch 3, wobei der Computer ferner dafür programmiert ist, die entsprechende Abwärtsverstärkungseinstellung zu ermitteln, welche das Rauschen für jede Reihe unterdrückt, deren Zählwert von Kernels mit Signal kleiner als ein kritischer Schwellenwert ist.
- System nach Anspruch 1, wobei die Unterteilung des ersten Bildframes von Pixelintensitätsdaten in ein regelmäßiges Gitter von Kernels, die mehrere Sätze ausgerichteter Kernels ausbilden, den Schritt der Unterteilung des ersten Bildframes mit Bildintensitätsdaten in ein reguläres Gitter von mehrere Sektoren ausbildenden Kernels umfasst.
- System nach Anspruch 6, wobei der Schritt (f) für jeden eine vorbestimmte Bedingung erfüllenden Sektor das Ermitteln einer mittleren Pixelintensität aller Kernels mit Signal umfasst, um einen Zeilenmittelwert zu erzeugen; und der Schritt (g) das Ermitteln der Verstärkungseinstellung für jeden Sektor umfasst, welche den dem jeweiligen Sektor entsprechenden Grauskalenwert auf den optimalen Grauskalenwert verschiebt.
- System nach Anspruch 6, wobei der Computer ferner dafür programmiert ist, die entsprechende Abwärtsverstärkungseinstellung zu ermitteln, welche das Rauschen für jeden Sektor unterdrückt, dessen Zählwert von Kernels mit Signal kleiner als ein kritischer Schwellenwert ist.
- System nach Anspruch 1, wobei die Unterteilung des ersten Bildframes von Pixelintensitätsdaten in ein regelmäßiges Gitter von Kernels, die mehrere Sätze ausgerichteter Kernels ausbilden, den Schritt der Unterteilung des ersten Bildframes mit Bildintensitätsdaten in ein reguläres Gitter von Kernels mit mehreren Spalten umfasst.
- System nach Anspruch 9, wobei der Schritt (f) für jede eine vorbestimmte Bedingung erfüllenden Spalte das Ermitteln einer mittleren Pixelintensität aller Kernels mit Signal umfasst, um einen Spaltenmittelwert zu erzeugen; und der Schritt (g) das Ermitteln der Verstärkungseinstellung für jede Spalte umfasst, welche den der jeweiligen Spalte entsprechenden Grauskalenwert auf den optimalen Grauskalenwert verschiebt.
- System nach Anspruch 1, wobei der Computer ferner dafür programmiert ist, die entsprechende Abwärtsverstärkungseinstellung zu ermitteln, welche das Rauschen für jede Spalte unterdrückt, deren Zählwert von Kernels mit Signal kleiner als ein kritischer Schwellenwert ist.
- Verfahren zum automatischen Einstellen der Verstärkung in einem Ultraschall-Bildgebungssystem, mit den Schritten:(a) Unterteilen eines Bildframes von Pixelintensitätsdaten in ein reguläres Gitter von Kernels, die mehrere Sätze ausgerichteter Kernels ausbilden;(b) Abrufen der aktuellen Einstellungen in dem Ultraschall-Bildgebungssystem aller zugehörigen verstärkungsbezogenen Parameter für jeden Kernel;(c) Vorhersagen des mittleren Rauschpegels in jedem Kernel unter Verwendung eines Rauschmodells;(d) Berechnen einer Funktion der Pixelintensität für jeden Kernel;(e) Vergleichen des vorhergesagten mittleren Rauschpegels mit der berechneten Pixelintensitätsfunktion für jeden Kernel;(f) für jeden Kernelsatz, Zählen der Kernels mit einer um eine vorbestimmte Größe größeren Pixelintensitätsfunktion als ein vorhergesagter mittlerer Rauschpegel, um einen Zählwert von Kernels mit Signal zu erzeugen,(g) für jeden Kernelsatz, dessen Zählwert von Kernels mit einem Signal gleich oder größer als ein kritischer Schwellenwert ist, Berechnen einer mittleren Pixelintensität aller Kernels mit Signal, um einen Kernelsatzmittelwert zu erzeugen;(h) auf der Basis eines optimalen mittleren Grauskalenwertes, Ermitteln der Verstärkungseinstellung für jeden Kernelsatz, welche den Grauskalenwert entsprechend dem jeweiligen Kernelsatzmittelwert zu dem optimalen Grauskalenwert verschiebt; und(i) Anpassen der Verstärkung gemäß den Verstärkungseinstellungen während des nachfolgenden Betriebs des Ultraschall-Bildgebungssystems.
- Verfahren nach Anspruch 12, wobei die Funktion eine mittlere Pixelintensität ist.
- Verfahren nach Anspruch 12, wobei die Funktion eine Gesamtpixelintensität ist.
- Verfahren nach Anspruch 12, wobei jeder Kernelsatz eine entsprechende Reihe in dem Gitter bildet.
- Verfahren nach Anspruch 12, wobei jeder Kernelsatz einen entsprechenden Sektor in dem Gitter bildet.
- Verfahren nach Anspruch 12, wobei jeder Kernelsatz eine entsprechende Spalte in dem Gitter bildet.
- Verfahren nach Anspruch 12, wobei die Verstärkungseinstellungen entlang jedem Vektor akustischer Daten variiert werden.
- Verfahren nach Anspruch 12, wobei die Verstärkungseinstellungen quer zu Vektoren akustischer Daten variiert werden.
- Verfahren nach Anspruch 12, ferner mit dem Schritt der Ermittlung einer entsprechenden Abwärtsverstärkungseinstellung, welche das Rauschen für jeden Kernelsatz unterdrückt, dessen Zählwert von Kernels mit Signal kleiner als ein kritischer Schwellenwert ist.
Applications Claiming Priority (2)
| Application Number | Priority Date | Filing Date | Title |
|---|---|---|---|
| US203440 | 1980-11-03 | ||
| US09/203,440 US6102859A (en) | 1998-12-01 | 1998-12-01 | Method and apparatus for automatic time and/or lateral gain compensation in B-mode ultrasound imaging |
Publications (2)
| Publication Number | Publication Date |
|---|---|
| EP1005833A1 EP1005833A1 (de) | 2000-06-07 |
| EP1005833B1 true EP1005833B1 (de) | 2007-05-09 |
Family
ID=22754033
Family Applications (1)
| Application Number | Title | Priority Date | Filing Date |
|---|---|---|---|
| EP99309576A Expired - Lifetime EP1005833B1 (de) | 1998-12-01 | 1999-11-30 | Verfahren und Gerät zur automatischen Kompensierung von Zeit-Verstärkung und/oder Seitenintensität-Verstärkung bei der B-Mode Ultraschallbildgebung |
Country Status (4)
| Country | Link |
|---|---|
| US (1) | US6102859A (de) |
| EP (1) | EP1005833B1 (de) |
| JP (1) | JP4405017B2 (de) |
| DE (1) | DE69936036T2 (de) |
Families Citing this family (44)
| Publication number | Priority date | Publication date | Assignee | Title |
|---|---|---|---|---|
| US6113544A (en) * | 1998-12-07 | 2000-09-05 | Mo; Larry Y. L. | Method and apparatus for automatic transmit waveform optimization in B-mode ultrasound imaging |
| US6423003B1 (en) * | 1999-10-29 | 2002-07-23 | Acuson Corporation | Ultrasonic imaging system and method with SNR adaptive processing |
| JP3300313B2 (ja) * | 1999-11-01 | 2002-07-08 | 松下電器産業株式会社 | 超音波診断装置 |
| US6398733B1 (en) * | 2000-04-24 | 2002-06-04 | Acuson Corporation | Medical ultrasonic imaging system with adaptive multi-dimensional back-end mapping |
| US6579238B1 (en) * | 2000-04-24 | 2003-06-17 | Acuson Corporation | Medical ultrasonic imaging system with adaptive multi-dimensional back-end mapping |
| US6866631B2 (en) * | 2001-05-31 | 2005-03-15 | Zonare Medical Systems, Inc. | System for phase inversion ultrasonic imaging |
| US6743174B2 (en) | 2002-04-01 | 2004-06-01 | Koninklijke Philips Electronics N.V. | Ultrasonic diagnostic imaging system with automatically controlled contrast and brightness |
| US6666824B2 (en) * | 2002-04-01 | 2003-12-23 | Koninklijke Philips Electronics N.V. | System and method of dynamic automatic sensing of available dynamic range |
| US6942618B2 (en) * | 2003-06-19 | 2005-09-13 | Siemens Medical Solutions U.S.A., Inc. | Change detection for optimized medical imaging |
| US8900149B2 (en) | 2004-04-02 | 2014-12-02 | Teratech Corporation | Wall motion analyzer |
| US7306561B2 (en) * | 2004-09-02 | 2007-12-11 | Scimed Life Systems, Inc. | Systems and methods for automatic time-gain compensation in an ultrasound imaging system |
| US7627386B2 (en) * | 2004-10-07 | 2009-12-01 | Zonaire Medical Systems, Inc. | Ultrasound imaging system parameter optimization via fuzzy logic |
| JP4614739B2 (ja) * | 2004-11-16 | 2011-01-19 | パナソニック株式会社 | 超音波診断装置 |
| JP2008538720A (ja) | 2005-04-25 | 2008-11-06 | コーニンクレッカ フィリップス エレクトロニクス エヌ ヴィ | 超音波画像を処理するための対象付加利得ツール |
| US7645236B2 (en) * | 2005-06-28 | 2010-01-12 | Siemens Medical Solutions Usa, Inc. | Ultrasound imaging system having motion adaptive gain |
| US8784318B1 (en) | 2005-07-22 | 2014-07-22 | Zonare Medical Systems, Inc. | Aberration correction using channel data in ultrasound imaging system |
| US8002705B1 (en) | 2005-07-22 | 2011-08-23 | Zonaire Medical Systems, Inc. | Continuous transmit focusing method and apparatus for ultrasound imaging system |
| KR100748858B1 (ko) * | 2005-11-24 | 2007-08-13 | 주식회사 메디슨 | 영상의 화질을 개선시키는 영상 처리 시스템 및 방법 |
| KR100875413B1 (ko) * | 2005-12-06 | 2008-12-23 | 주식회사 메디슨 | 컬러 플로우 영상의 이득을 조절하는 영상 처리 시스템 및방법 |
| KR100908252B1 (ko) | 2006-03-10 | 2009-07-20 | 주식회사 메디슨 | 영상 처리 시스템 및 방법 |
| EP2048511B1 (de) * | 2006-03-31 | 2014-02-26 | Hitachi Aloka Medical, Ltd. | Verfahren und Vorrichtung zur 3D Ultraschallbildgebung mit automatischer Tiefenkorrektur |
| US20080146922A1 (en) * | 2006-10-24 | 2008-06-19 | Zonare Medical Systems, Inc. | Control of user interfaces and displays for portable ultrasound unit and docking station |
| KR100936456B1 (ko) | 2006-12-07 | 2010-01-13 | 주식회사 메디슨 | 초음파 시스템 |
| US10456111B2 (en) | 2006-12-07 | 2019-10-29 | Samsung Medison Co., Ltd. | Ultrasound system and signal processing unit configured for time gain and lateral gain compensation |
| CN101219063B (zh) * | 2007-01-12 | 2011-03-23 | 深圳迈瑞生物医疗电子股份有限公司 | 基于二维分析的b图像均衡方法和系统结构 |
| US9060669B1 (en) | 2007-12-20 | 2015-06-23 | Zonare Medical Systems, Inc. | System and method for providing variable ultrasound array processing in a post-storage mode |
| US9451929B2 (en) | 2008-04-17 | 2016-09-27 | Boston Scientific Scimed, Inc. | Degassing intravascular ultrasound imaging systems with sealed catheters filled with an acoustically-favorable medium and methods of making and using |
| JP5248961B2 (ja) * | 2008-09-18 | 2013-07-31 | パナソニック株式会社 | 超音波診断装置 |
| US8235900B2 (en) * | 2009-03-23 | 2012-08-07 | Imsonic Medical, Inc. | Method and apparatus for an automatic ultrasound imaging system |
| US8545412B2 (en) * | 2009-05-29 | 2013-10-01 | Boston Scientific Scimed, Inc. | Systems and methods for making and using image-guided intravascular and endocardial therapy systems |
| US20110054317A1 (en) * | 2009-08-31 | 2011-03-03 | Feng Lin | Tracking and optimizing gain and contrast in real-time for ultrasound imaging |
| US8998812B2 (en) | 2010-09-13 | 2015-04-07 | General Electric Company | Ultrasound method and probe for electromagnetic noise cancellation |
| JP5984244B2 (ja) * | 2012-01-16 | 2016-09-06 | 東芝メディカルシステムズ株式会社 | 超音波診断装置、超音波診断装置制御プログラム、および医用画像表示方法 |
| US10342516B2 (en) * | 2014-09-24 | 2019-07-09 | General Electric Company | Adaptive ultrasound image optimization through automatic gain control adjustment |
| US12298445B2 (en) | 2014-10-28 | 2025-05-13 | Supersonic Imagine | Method and system for adjusting image gain |
| WO2016067073A1 (en) | 2014-10-28 | 2016-05-06 | Super Sonic Imagine | Method and system for adjusting image gain |
| KR101652725B1 (ko) * | 2015-04-09 | 2016-08-31 | 서강대학교산학협력단 | 초음파 영상 화질 개선 방법 및 이를 이용한 초음파 영상 장치 |
| KR101652723B1 (ko) * | 2015-04-10 | 2016-08-31 | 서강대학교산학협력단 | 초음파 영상 화질 개선 방법 및 이를 이용한 초음파 영상 장치 |
| CN110327076B (zh) * | 2019-07-05 | 2022-08-16 | 深圳开立生物医疗科技股份有限公司 | 一种血流增益调节方法、装置、设备及可读存储介质 |
| AU2020325307A1 (en) | 2019-08-08 | 2022-03-03 | Accutome Inc. | Sector variable time gain compensation |
| US11308609B2 (en) | 2019-12-04 | 2022-04-19 | GE Precision Healthcare LLC | System and methods for sequential scan parameter selection |
| US12564384B2 (en) | 2019-12-04 | 2026-03-03 | GE Precision Healthcare LLC | System and methods for joint scan parameter selection |
| CN113647983B (zh) * | 2021-09-08 | 2024-07-02 | 南京云石医疗科技有限公司 | 一种超声彩色血流成像控制方法 |
| JP2023160577A (ja) * | 2022-04-22 | 2023-11-02 | 富士フイルムヘルスケア株式会社 | 超音波撮像装置、および、信号処理方法 |
Family Cites Families (4)
| Publication number | Priority date | Publication date | Assignee | Title |
|---|---|---|---|---|
| US5477858A (en) * | 1986-07-30 | 1995-12-26 | Siemens Medical Systems, Inc. | Ultrasound blood flow/tissue imaging system |
| EP0883860B1 (de) * | 1996-02-29 | 2006-08-23 | Acuson Corporation | System, verfahren und wandler zum ausrichten mehrerer ultraschallbilder |
| EP0867147B1 (de) * | 1997-02-04 | 2004-10-27 | Lunar Corporation | Dünnfilm akustische Wandleranordnung |
| US5865750A (en) * | 1997-05-07 | 1999-02-02 | General Electric Company | Method and apparatus for enhancing segmentation in three-dimensional ultrasound imaging |
-
1998
- 1998-12-01 US US09/203,440 patent/US6102859A/en not_active Expired - Lifetime
-
1999
- 1999-11-30 DE DE69936036T patent/DE69936036T2/de not_active Expired - Lifetime
- 1999-11-30 JP JP33899699A patent/JP4405017B2/ja not_active Expired - Fee Related
- 1999-11-30 EP EP99309576A patent/EP1005833B1/de not_active Expired - Lifetime
Also Published As
| Publication number | Publication date |
|---|---|
| US6102859A (en) | 2000-08-15 |
| DE69936036D1 (de) | 2007-06-21 |
| DE69936036T2 (de) | 2008-01-10 |
| EP1005833A1 (de) | 2000-06-07 |
| JP4405017B2 (ja) | 2010-01-27 |
| JP2000197637A (ja) | 2000-07-18 |
Similar Documents
| Publication | Publication Date | Title |
|---|---|---|
| US6102859A (en) | Method and apparatus for automatic time and/or lateral gain compensation in B-mode ultrasound imaging | |
| US6113544A (en) | Method and apparatus for automatic transmit waveform optimization in B-mode ultrasound imaging | |
| EP1176910B1 (de) | Verfahren und gerät zur automatischen verfolgung von blutgefässen bei ultraschallbilddarstellung | |
| EP1016880B1 (de) | Automatische Regelung des Geschwindigkeitsgrads und Pulsfolgefrequenz für Doppler- Ultraschall- Spektrogramme | |
| EP2007285B1 (de) | Ultraschallabbildungsverfahren und -vorrichtung mit automatischer tiefenkorrektur | |
| US6030344A (en) | Methods and apparatus for ultrasound image quantification | |
| US6733454B1 (en) | Automatic optimization methods and systems for doppler ultrasound imaging | |
| US6077226A (en) | Method and apparatus for positioning region of interest in image | |
| US6241677B1 (en) | Method and apparatus for ultrasound image quantification | |
| US6743174B2 (en) | Ultrasonic diagnostic imaging system with automatically controlled contrast and brightness | |
| US6346079B1 (en) | Method and apparatus for adaptive frame-rate adjustment in ultrasound imaging system | |
| US8047992B2 (en) | Brightness adjustment method and system for 3D ultrasound | |
| US6017309A (en) | Ultrasound color flow display optimization by adjusting color maps | |
| US6142943A (en) | Doppler ultrasound automatic spectrum optimization | |
| KR100748858B1 (ko) | 영상의 화질을 개선시키는 영상 처리 시스템 및 방법 | |
| US11911222B2 (en) | Model-based control of a dynamic range of an ultrasound image | |
| US8951199B2 (en) | Ultrasonic diagnostic apparatus that performs gain control based on offset patterns of pixel brightness | |
| US6423004B1 (en) | Real-time ultrasound spatial compounding using multiple angles of view | |
| US20030187354A1 (en) | System and method of dynamic automatic sensing of available dynamic range | |
| US7604594B2 (en) | Method and system of controlling ultrasound systems |
Legal Events
| Date | Code | Title | Description |
|---|---|---|---|
| PUAI | Public reference made under article 153(3) epc to a published international application that has entered the european phase |
Free format text: ORIGINAL CODE: 0009012 |
|
| AK | Designated contracting states |
Kind code of ref document: A1 Designated state(s): DE NL |
|
| AX | Request for extension of the european patent |
Free format text: AL;LT;LV;MK;RO;SI |
|
| 17P | Request for examination filed |
Effective date: 20001207 |
|
| AKX | Designation fees paid |
Free format text: DE NL |
|
| 17Q | First examination report despatched |
Effective date: 20030926 |
|
| GRAP | Despatch of communication of intention to grant a patent |
Free format text: ORIGINAL CODE: EPIDOSNIGR1 |
|
| GRAS | Grant fee paid |
Free format text: ORIGINAL CODE: EPIDOSNIGR3 |
|
| GRAA | (expected) grant |
Free format text: ORIGINAL CODE: 0009210 |
|
| AK | Designated contracting states |
Kind code of ref document: B1 Designated state(s): DE NL |
|
| REF | Corresponds to: |
Ref document number: 69936036 Country of ref document: DE Date of ref document: 20070621 Kind code of ref document: P |
|
| PGFP | Annual fee paid to national office [announced via postgrant information from national office to epo] |
Ref country code: NL Payment date: 20071124 Year of fee payment: 9 |
|
| PLBE | No opposition filed within time limit |
Free format text: ORIGINAL CODE: 0009261 |
|
| STAA | Information on the status of an ep patent application or granted ep patent |
Free format text: STATUS: NO OPPOSITION FILED WITHIN TIME LIMIT |
|
| 26N | No opposition filed |
Effective date: 20080212 |
|
| PG25 | Lapsed in a contracting state [announced via postgrant information from national office to epo] |
Ref country code: NL Free format text: LAPSE BECAUSE OF NON-PAYMENT OF DUE FEES Effective date: 20090601 |
|
| NLV4 | Nl: lapsed or anulled due to non-payment of the annual fee |
Effective date: 20090601 |
|
| PGFP | Annual fee paid to national office [announced via postgrant information from national office to epo] |
Ref country code: DE Payment date: 20101126 Year of fee payment: 12 |
|
| REG | Reference to a national code |
Ref country code: DE Ref legal event code: R119 Ref document number: 69936036 Country of ref document: DE Effective date: 20130601 |
|
| PG25 | Lapsed in a contracting state [announced via postgrant information from national office to epo] |
Ref country code: DE Free format text: LAPSE BECAUSE OF NON-PAYMENT OF DUE FEES Effective date: 20130601 |