EP1008952A2 - Système et méthode d'identification de l'origine géographique d'un produit frais - Google Patents
Système et méthode d'identification de l'origine géographique d'un produit frais Download PDFInfo
- Publication number
- EP1008952A2 EP1008952A2 EP99309933A EP99309933A EP1008952A2 EP 1008952 A2 EP1008952 A2 EP 1008952A2 EP 99309933 A EP99309933 A EP 99309933A EP 99309933 A EP99309933 A EP 99309933A EP 1008952 A2 EP1008952 A2 EP 1008952A2
- Authority
- EP
- European Patent Office
- Prior art keywords
- commodity
- origin
- data set
- samples
- sample
- Prior art date
- Legal status (The legal status is an assumption and is not a legal conclusion. Google has not performed a legal analysis and makes no representation as to the accuracy of the status listed.)
- Withdrawn
Links
Images



Classifications
-
- G—PHYSICS
- G06—COMPUTING OR CALCULATING; COUNTING
- G06N—COMPUTING ARRANGEMENTS BASED ON SPECIFIC COMPUTATIONAL MODELS
- G06N3/00—Computing arrangements based on biological models
- G06N3/02—Neural networks
- G06N3/04—Architecture, e.g. interconnection topology
- G06N3/045—Combinations of networks
-
- G—PHYSICS
- G06—COMPUTING OR CALCULATING; COUNTING
- G06N—COMPUTING ARRANGEMENTS BASED ON SPECIFIC COMPUTATIONAL MODELS
- G06N3/00—Computing arrangements based on biological models
- G06N3/02—Neural networks
- G06N3/04—Architecture, e.g. interconnection topology
- G06N3/0499—Feedforward networks
-
- G—PHYSICS
- G06—COMPUTING OR CALCULATING; COUNTING
- G06N—COMPUTING ARRANGEMENTS BASED ON SPECIFIC COMPUTATIONAL MODELS
- G06N3/00—Computing arrangements based on biological models
- G06N3/02—Neural networks
- G06N3/08—Learning methods
- G06N3/09—Supervised learning
-
- G—PHYSICS
- G06—COMPUTING OR CALCULATING; COUNTING
- G06V—IMAGE OR VIDEO RECOGNITION OR UNDERSTANDING
- G06V20/00—Scenes; Scene-specific elements
- G06V20/60—Type of objects
- G06V20/68—Food, e.g. fruit or vegetables
Definitions
- the present invention relates to systems and methods for analyzing a fresh commodity, and, more particularly, to such systems and methods for identifying the geographic origin thereof.
- Fresh produce is often labeled with its geographical origin when that origin is believed to confer a beneficial attribute.
- Such indicators include "Vidalia onions,” “Idaho potatoes,” and “Florida citrus.”
- Federal and state laws have been enacted to ban mislabeling of fresh produce, and cases of alleged misrepresentation have been investigated by the U.S. Department of Agriculture, state governments, and grower groups.
- One detection method involves the analysis of vitamins or other organic molecules. Such compounds are, however, subject to variability owing to degradation over time and to storage conditions.
- Another way that has been used is to test for the concentration of certain elements in a product, which can be affected by such things as the soil in which the product is grown.
- the soil-plant system is highly specific for different elements, plant species, and environmental conditions.
- a trace element present in the commodity must have existed in the rooting zone of the plant, generally in highly soluble form.
- a trace element must also pass through at least one cellular membrane in its movement from soil to plant.
- the selectivity of these processes of mineral accumulation within the commodity varies with different trace elements, with different plants, and the unique environment in which the commodity is grown.
- An example of geographic origin variability is the higher barium levels typically found in Brazilian than in Florida oranges, which can thus be used as an indicator of adulteration.
- ICP-AES inductively coupled plasma - atomic emission spectrometry
- the present invention can provide a system and method for detecting a geographical origin of a fresh commodity.
- the method comprises a series of steps, including generating a plurality of neural network models.
- Each model has as a training set a data set from a plurality of samples of a commodity of known origins.
- Each sample has been analyzed for a plurality of elemental concentrations.
- Each neural network model is presented for classification a test data set from a plurality of samples of a commodity of unknown origins. As with the training set, the samples have been analyzed for the same plurality of elemental concentrations.
- a bootstrap aggregating strategy is employed to combine the results of the classifications for each sample in the test data set made by each neural network model. Finally, a determination is made from the bootstrap aggregating strategy as to a final classification of each sample in the test data set. This final classification is indicative of the geographical origin of the commodity.
- the system of the present invention includes means for performing the above-recited steps, comprising software means for generating the neural network models and a software routine for performing the bootstrap aggregating strategy.
- FIG. 1 is a flow chart of a preferred embodiment of the method of the present invention.
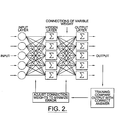
- FIG. 2 (prior art) is a schematic diagram of the back propagation of neural networks.
- FIG. 3 is a schematic diagram of potato tuber parts and sections used for trace element analysis.
- FIG. 4 is a 2D plot of principal components.
- FIG. 5 is a frequency chart of canonical discriminant analysis data.
- FIG. 6 is a 2D projection of canonical discriminant analysis data.
- FIG. 7 plots a subset of the data of FIG. 6.
- FIG. 8 plots canonical variables generated by half of the data of FIG. 6.
- FIG. 9 plots the remaining data of FIG. 8 with respect to the canonical variables generated.
- FIGS. 1-9 A description of the preferred embodiments of the present invention will now be presented with reference to FIGS. 1-9.
- An inductively coupled argon plasma atomic emission spectrometer (ICPAES) was equipped and set up as follows: Leeman 1000, power 1.9 kW, coolant 13 LPM, nebulizer 46 psi, aux. flow 0.20, pump rate 0.9 mL/min, scan integration time 0.25 sec, integrations 2, uptake time 29 sec, Mnl peaking wavelength, acid flexible tubing 0.030 ID mm, wavelengths and background corrections given in Anderson (1996).
- the temperature controller/digester used was a digestion system 40, 1016 Digester, and Autostep 1012 Controller (Tecator, Sweden), fitted with an aluminum adapter plate 3-mm thick with 40 17-mm holes on top overlaid on the heater block.
- the source of chemicals and reference materials was as follows: concentrated, nitric acid trace metal analysis grade (J. T. Baker, St. Louis, MO); elemental stock standards solutions (J. T. Baker, St. Louis, MO); reference materials, NIST 1575 Pine Needles, NIST Oyster Tissue 1566a, NIST Rice Flour 1568a, NIST 1577b Bovine Liver, NIST 8433 Corn Bran (National Institute of Standards and Technology, Gaithersburg, MD), NRC, TORT-2 Lobster Hepatopancreas (National Research Council Canada, Institute National Measurements Standards).
- samples were gathered by the Idaho Potato Commission (IPC) or one of their delegates directly from farms or producer's storage units. Samples were shipped within days of collection with the chain-of-custody documentation to the University of Idaho Analytical Sciences Laboratory. Samples were stored under controlled access at 4 C until analysis, typically within two weeks.
- IPC Idaho Potato Commission
- Potatoes were collected from all major fresh market geographic locations in North America (US and Canada), based primarily on the number of acres in fresh potato production.
- Idaho potatoes are grown primarily in the Snake River Plain, representing about 400,000 acres in current potato production. Within this region, sub-regions were identified and three hundred forty-two samples were collected from the following Idaho locations: Upper Valley, Magic Valley, and Treasure Valley.
- Non-Idaho potatoes include samples taken from the following geographic locations: Colorado, Washington, Maine, Michigan, and Canada (Prince Edward Island and New Brunswick). Two hundred sixty-six non-Idaho samples were collected.
- samples were allowed to react for ca. 4-8 hours in a hood at ambient temperature. Then the samples were digested using a heating block (or programmable digester may be used). The samples were heated to 180 C for 3-4 hours. Digestion is confirmed complete when no nitrous oxide gases are evolved (i.e., orange gas production). Samples are diluted with type 1 water (18 Mohm cm) and mixed thoroughly using a vortexer. Analysis is by inductively coupled plasma atomic emission spectrometer (ICPAES).
- ICPAES inductively coupled plasma atomic emission spectrometer
- Percent moisture for each individual sample was determined in duplicate.
- the percent moisture method used was a modification of AOAC Method 984.25 (Association of Official Analytical Chemists, 1990). Mineral and trace element concentrations were standardized to a dry weight, based on the moisture content.
- Each analytical batch contained a minimum of 25% quality control samples, including check standards, duplicates, spikes, and standard reference materials (SRM). Percent recovery and percent standard deviation for SRM are given in Table 1. During the course of the study over 360 SRM samples were analyzed; SRM were dominantly plant matrices where available. In all cases the SRM represented analyte concentration ranges typically found in plant tissues. The percent recovery ranged from 86 to 136%. The percent standard deviation ranged from 2 to 39%. Typical percent standard deviation (%SD) was ⁇ 10%, although analytes close to method detection limits (MDL) had higher %SD. Spike recoveries and check standards were typically within ⁇ 10% of their true value.
- SRM standard reference materials
- Fresh commodities may be stored for long periods (1-9 months); during storage fresh produce may lose moisture.
- fresh produce may lose moisture.
- the authors proposed that even at 4 C (3 months) desiccation of the walnuts occurred (Lavedrine et al., 1997).
- the percentage water may vary 10-20% from the time of harvest to the time of use (1-9 months later). Percent moisture content will affect the relative concentration of trace elements (e.g., weight/weight). Therefore, the percentage moisture must be equalized such that it does not dominate or mask the variations of the elemental concentrations, which are due to geographic growing conditions of fresh commodities versus effects of dehydration during storage.
- the potato tuber was not dried prior to sub-sampling due to the difficulty in sub-sampling a portion that had a consistent pulp/skin ratio (see below). Desiccation by freeze-drying would be an alternative method. Here the percent moisture was determined (in duplicate) for each individual tuber. The percent moisture was then used to determine the elemental concentrations on a dry weight basis for each individual tuber. In this way, the loss or variation of water would not mask the variations that are due to geographic growing conditions. The procedure developed here was tested with samples over 4 months and found that when the percent moisture was compensated for, the elemental concentrations were consistent regardless of storage time. This method therefore is robust in its applicability independent of storage time.
- sample component parts for the potato commodity were analyzed: skin only, pulp only, and whole tuber.
- a preliminary data analysis using 70 samples was used to screen the viability of each sample component part.
- practical aspects such as the reliability and consistency that could be achieved at the bench-level during sample preparation for the chemical analysis were evaluated.
- the most optimal sample component type was determined to be whole tuber.
- an important caveat of this sample type was the importance of the ratio of skin to pulp. It was determined that the skin to pulp ratio (by weight) should be consistent between all samples.
- a protocol was developed that provided a method to sub-sample from the tuber that could consistently represent the same pulp/skin ratio (see Figure 3).
- Elemental distribution within a single commodity component may vary within the commodity itself.
- a single commodity component e.g., pulp only
- some chemicals within a potato tuber are not evenly distributed in a given potato component (i.e., the pulp) from the stem end to the distal end (AI-Saikhan et al., 1995).
- AI-Saikhan et al., 1995 we developed a protocol that isolated a consistent potato tuber section. The center section was determined to be the least affected by any variations that might exist between the stem end and the distal end. See Figure 3 for a graphical representation of the sampling technique developed.
- the drying of a plant tissue is a balancing act between too low a temperature over a prolonged period, which will encourage and promote biological activity, and too high a temperature over a short period, which may result in the loss of volatile analytes.
- n 3 of drying times versus temperatures. After 5 days the percentage moisture at 105 C changed by less than 0.2% on average. Lower temperatures ( ⁇ 85 C) required longer drying times (>7-8 days), which risked biological growth, and temperatures >105 C were determined to increase the risk of other volatile analytes losses.
- the above-described procedure therefore was determined to be optimal for fresh commodities by minimizing any volatilization and producing a consistent dried weight while avoiding biological growth.
- the Idaho Snake River Plain is a unique area composed of rich volcanic soil in an arid to semi-arid (irrigated) environment.
- the soils in this region are Xerolls, which are unique as compared to other potato producing geographic regions.
- the soil and environmental growing conditions provide unique mineral and trace element tuber uptake and the necessary chemical profile difference to differentiate between potatoes grown in Idaho versus outside Idaho.
- the data were analyzed in an effort to classify potato samples as having originated from Idaho or from outside Idaho based on the trace element profile of each sample.
- Basic statistical analyses and several pattern recognition methods were applied to the data. Neural network methods were applied utilizing software from the Ward Systems Group (NeuroShell, Release 4.6). Basic statistical analyses and pattern recognition techniques (not including neural network) were performed utilizing the SAS System for Windows analysis package (Release 6.11, SAS Institute Inc.). Neural network analysis included varianits of feed forward back propagation architectures and included combining classifiers in a "bagging" strategy.
- Basic statistical analyses and pattern recognition techniques included the following: descriptive statistics, Students t test, assessment of normality of data distribution, principal component analysis, canonical discriminant analysis, discriminate function analysis, nonparametric K nearest-neighbor analysis.
- the data set was standardized to account for differing variable scales by subtracting from each entry its associated variable mean and then dividing by the variable standard deviation.
- the standardized data corresponding to each variable thus have a mean equal to zero and a standard deviation equal to one.
- Descriptive statistics (the mean, standard deviation, minimum and maximum values) for each element in each group were determined.
- the TTEST procedure was used to compute a t statistic for testing the hypothesis that the means of the elemental concentration of the two groups of potatoes are equal.
- the UNIVARIATE procedure was used to test for normality using the Shapiro-Wilk statistic and data distribution plots. Small values of W lead to the rejection of the null hypothesis.
- Principal component analysis generates principal components that are linear combinations of the original variables.
- the first principal component (PC) describes the maximum possible variation that can be projected onto one dimension, the second PC captures the second most, and so on.
- the principal components are orthogonal in the original space of variables and the number of principal components can equal the number of original variables. Analyzing the data with respect to principal components can thus sometimes effectively reduce the number of variables, especially if a large percentage of the total variation is described by a few principal components.
- One- or two-dimensional plots of data with respect to selected principal components can sometimes provide visual insight into the data, offering a visual description of group differences or clustering, and outliers.
- PCA has been applied to geographical classification applications of various foods, including processed orange juice (Nikdel et al., 1988), wine (Day et al., 1995; Latorre, et al., 1994), honey (Sanz et al., 1995), and cocoa (Hernandez and Rutledge, 1994a,b). PCA was applied to our data using the PRINCCOMP procedure.
- Canonical discriminate analysis generates canonical variables, which are linear combinations of the original variables, that describe the variation between pre-specified classes in a manner analogous to the way in which PCA summarizes the total variation of the data.
- CDA can be used to effectively reduce the number of variables and is particularly useful for producing one- or two-dimensional visualizations of the data since the "views" optimize the between-class differences.
- the default number of canonical variables generated is the minimum of the number of classes minus one, and the number of original variables.
- Different views of our data were obtained by defining the number of classes to be two (Idaho vs. non-Idaho) as well as multiple classes defined by different states.
- CDA has been applied to data for the purpose of geographical classification of wine (Latorre et al., 1994).
- the SAS procedure used for our analysis was the CANDISC procedure.
- CDA was first applied to the data using two defined classes, Idaho and non-Idaho.
- Figure 5 shows a frequency chart of the data using the first canonical variable. Classes were also defined by state (and one class for Canadian (CAN) samples). The data are plotted using the first two canonical variables in Figure 6.
- CO and ID tend to overlap significantly and WI and ME display significant overlap.
- Figure 7 is a "cleaner" view without the CO and ME samples.
- Figure 8 half the data (without CO or ME) were used to generate the canonical variables and then plotted, and, in Figure 9, the remaining data (lower-case letters) are plotted with respect to the canonical variables generated by the data in Figure 8.
- Figure 9 thus conveys a visual sense of the consistency and the predictive properties of the data. We emphasize that any overlap depicted in one- or two-dimensional plots is not indicative of any intractable classification task.
- the predictive pattern recognition methods discussed below utilize all 14 available dimensions, and excellent predictive results are demonstrated.
- the DISCRIM procedure was used for both parametric and non-parametric discriminant function analyses.
- the parametric procedure determines a discriminant function of classification criterion by a measure of generalized squared distance (Rao, 1973). This procedure assumes a multivariate normal distribution. Selection of variables to be included is discussed below.
- V values to the parametric discriminant function increased the number of misclassified samples and was therefore removed from the analyses. Elimination of either Cr or Ni values reduced the number of misclassified samples and therefore these variables were included in the model.
- the final model included 14 elements (Ba, Ca, Cd, Cr, Cu, Fe, K, Mg, Mn, Ni, P, S, Sr, and Zn).
- the error rates of the quadratic discriminant function calculated using 14 element concentrations of 342 known Idaho potato samples and 266 known non-Idaho potato samples were 3.5% and 5.6%, respectively, resulting in 330 Idaho (97%) and 251 non-Idaho (95%) correctly classified samples in cross-validation testing (Table 4).
- the data set was randomly divided into two halves of 304 samples.
- Cross-validation testing using only 304 samples as the calibration or training set had error rates of 4.1 and 4.7% for known Idaho potatoes and 4.5 and 9.3% for non-Idaho potatoes (Table 4).
- error rates were 4.7% for the Idaho potatoes and 3.8 to 6.0% for non-Idaho potatoes (Table 4).
- the non-parametric K nearest-neighbor analyses using all 18 variables and all 608 samples gave low error rates for Idaho potatoes (1.2%) but had higher error rates for non-Idaho potatoes (8.4%).
- Feed-forward back propagation neural network methods were also applied to the data in an effort to classify the samples by geographic origin as Idaho or non-Idaho samples.
- an early sopping strategy was employed to enhance the ability of the networks to generalize well (perform well on new data).
- the data were divided into two disjoint subsets: a training set and a test set.
- Networks were trained using half of the data (training set). During the training process the remaining half of the data (test set) was periodically presented to the networks for classification. The final values of the network parameters were those corresponding to optimum test set performance.
- Further generalization enhancements are possible by employing a bootstrap aggregating ("bagging") strategy (Frieman). Here multiple networks are trained using randomly selected (sampling with replacement) training sets corresponding to half the data. Final classification is then determined by voting. This has the effect of reducing the high variance inherent to neural networks, resulting in improved generalization.
Landscapes
- Engineering & Computer Science (AREA)
- Theoretical Computer Science (AREA)
- Physics & Mathematics (AREA)
- General Health & Medical Sciences (AREA)
- Computing Systems (AREA)
- Biomedical Technology (AREA)
- Biophysics (AREA)
- Computational Linguistics (AREA)
- Data Mining & Analysis (AREA)
- Evolutionary Computation (AREA)
- Life Sciences & Earth Sciences (AREA)
- Molecular Biology (AREA)
- Artificial Intelligence (AREA)
- General Engineering & Computer Science (AREA)
- General Physics & Mathematics (AREA)
- Mathematical Physics (AREA)
- Software Systems (AREA)
- Health & Medical Sciences (AREA)
- Other Investigation Or Analysis Of Materials By Electrical Means (AREA)
- Management, Administration, Business Operations System, And Electronic Commerce (AREA)
Applications Claiming Priority (2)
| Application Number | Priority Date | Filing Date | Title |
|---|---|---|---|
| US210358 | 1998-12-11 | ||
| US09/210,358 US6324531B1 (en) | 1997-12-12 | 1998-12-11 | System and method for identifying the geographic origin of a fresh commodity |
Publications (2)
| Publication Number | Publication Date |
|---|---|
| EP1008952A2 true EP1008952A2 (fr) | 2000-06-14 |
| EP1008952A3 EP1008952A3 (fr) | 2003-11-12 |
Family
ID=22782599
Family Applications (1)
| Application Number | Title | Priority Date | Filing Date |
|---|---|---|---|
| EP99309933A Withdrawn EP1008952A3 (fr) | 1998-12-11 | 1999-12-10 | Système et méthode d'identification de l'origine géographique d'un produit frais |
Country Status (2)
| Country | Link |
|---|---|
| US (1) | US6324531B1 (fr) |
| EP (1) | EP1008952A3 (fr) |
Cited By (7)
| Publication number | Priority date | Publication date | Assignee | Title |
|---|---|---|---|---|
| WO2001040795A3 (fr) * | 1999-12-02 | 2001-10-18 | Risoe Nat Lab | Procede permettant de determiner si un produit a ete organiquement produit |
| WO2014032121A1 (fr) * | 2012-09-03 | 2014-03-06 | Australian Egg Corporation Limited | Procédé et système permettant de classer un aliment |
| CN105181907A (zh) * | 2015-10-13 | 2015-12-23 | 中国地质大学(武汉) | 一种定量判别软玉产地的方法 |
| CN109635705A (zh) * | 2018-12-05 | 2019-04-16 | 上海交通大学 | 一种基于二维码和深度学习的商品识别方法及装置 |
| CN109858246A (zh) * | 2018-12-24 | 2019-06-07 | 福州大学 | 一种针对控制信号型硬件木马的分类方法 |
| CN110443119A (zh) * | 2019-06-25 | 2019-11-12 | 中车工业研究院有限公司 | 车厢内货物状态识别方法及装置 |
| CN113505661A (zh) * | 2021-06-22 | 2021-10-15 | 中国农业大学 | 产地鉴别的方法、装置、电子设备及存储介质 |
Families Citing this family (10)
| Publication number | Priority date | Publication date | Assignee | Title |
|---|---|---|---|---|
| US7130834B2 (en) * | 1997-12-12 | 2006-10-31 | Idaho Potato Commission | Identification system and method for determining the geographic origin of a fresh commodity |
| JP2001325516A (ja) * | 2000-05-16 | 2001-11-22 | Sony Corp | 情報提供装置および方法、情報処理装置および方法、並びにプログラム格納媒体 |
| US7107266B1 (en) * | 2000-11-09 | 2006-09-12 | Inxight Software, Inc. | Method and apparatus for auditing training supersets |
| AUPR631601A0 (en) * | 2001-07-11 | 2001-08-02 | Commonwealth Scientific And Industrial Research Organisation | Biotechnology array analysis |
| EP1430438A2 (fr) * | 2001-09-17 | 2004-06-23 | Her Majesty the Queen in Right of Canada, representend by the Department of Agriculture and Agri-Food Canada | Procede et appareil d'identification et de quantification des caracteristiques des graines et autres objets de petites dimensions |
| JP2005524124A (ja) * | 2001-10-17 | 2005-08-11 | コモンウェルス サイエンティフィック アンド インダストリアル リサーチ オーガニゼーション | システムの診断構成要素を識別するための方法および装置 |
| CA2390056A1 (fr) * | 2002-06-07 | 2003-12-07 | Du Pont Canada Inc. | Methode et systeme de gestion de l'information sur les produits agricoles dune chaine de production |
| US20050097021A1 (en) * | 2003-11-03 | 2005-05-05 | Martin Behr | Object analysis apparatus |
| US11138477B2 (en) * | 2019-08-15 | 2021-10-05 | Collibra Nv | Classification of data using aggregated information from multiple classification modules |
| US11625535B1 (en) * | 2019-12-05 | 2023-04-11 | American Express Travel Related Services Company, Inc. | Computer-based systems having data structures configured to execute SIC4/SIC8 machine learning embedded classification of entities and methods of use thereof |
Family Cites Families (8)
| Publication number | Priority date | Publication date | Assignee | Title |
|---|---|---|---|---|
| FR2517828B1 (fr) | 1981-12-04 | 1985-08-09 | Martin Gerard | Nouveau procede de detection et de differenciation qualitative et quantitative des molecules naturellement deuteriees, dispositif pour la mise en oeuvre de ce procede et application, notamment, a la detection de la chaptalisation des vins |
| US5373452A (en) * | 1988-09-02 | 1994-12-13 | Honeywell Inc. | Intangible sensor and method for making same |
| US5252490A (en) * | 1989-10-31 | 1993-10-12 | University Of Mississippi | Method of identifying country of origin of cannabis |
| US5659624A (en) * | 1995-09-01 | 1997-08-19 | Fazzari; Rodney J. | High speed mass flow food sorting appartus for optically inspecting and sorting bulk food products |
| US5761070A (en) * | 1995-11-02 | 1998-06-02 | Virginia Tech Intellectual Properties, Inc. | Automatic color and grain sorting of materials |
| WO1998034177A2 (fr) * | 1997-01-31 | 1998-08-06 | Siemens Aktiengesellschaft | Procede de combinaison de signaux de sortie de plusieurs estimateurs, en particulier d'au moins un reseau neuronal, en un signal de resultat calcule par un estimateur global |
| US6122042A (en) * | 1997-02-07 | 2000-09-19 | Wunderman; Irwin | Devices and methods for optically identifying characteristics of material objects |
| US5917927A (en) * | 1997-03-21 | 1999-06-29 | Satake Corporation | Grain inspection and analysis apparatus and method |
-
1998
- 1998-12-11 US US09/210,358 patent/US6324531B1/en not_active Expired - Fee Related
-
1999
- 1999-12-10 EP EP99309933A patent/EP1008952A3/fr not_active Withdrawn
Non-Patent Citations (21)
| Title |
|---|
| B. W. SMITH: "Using neural networks and statistical methods to determine the geographic origin of potatotes", ABSTRACTS OF PAPERS PRESENTED AT THE 1998 PITTSBURGH CONFERENCE (PITTCON'98): MARCH 1-5 1998; IN JOURNAL OF AUTOMATIC CHEMISTRY, vol. 20, no. 5, October 1998 (1998-10-01), pages 136, XP007918230, DOI: 10.1155/S1463924698000200 * |
| D. W. OPITZ, J. W. SHAVLIK: "Generating accurate and diverse members of a neural-network ensemble", PROCEEDINGS OF THE 1995 CONFERENCE ON ADVANCES IN NEURAL INFORMATION PROCESSING SYSTEMS: NOVEMBER 27-30, 1995; IN ADVANCES IN NEURAL INFORMATION PROCESSING SYSTEMS, vol. 8, 11 June 1996 (1996-06-11), pages 535 - 541, XP007903583, Retrieved from the Internet <URL:http://books.nips.cc/papers/files/nips08/0535.pdf> * |
| D. W. OPITZ, R. F. MACLIN: "An empirical evaluation of bagging and boosting for artificial neural networks", PROCEEDINGS OF THE 1997 INTERNATIONAL CONFERENCE ON NEURAL NETWORKS (ICNN'97): JUNE 9-12 1997, vol. 3, 9 June 1997 (1997-06-09), pages 1401 - 1405, XP010238663, DOI: 10.1109/ICNN.1997.613999 * |
| G. THIEL: "Atomemissionsspektrometrische und multivariat-statistische Untersuchungen zur Bestimmung der Herkunft von Weinen", 11 November 1998, FRIEDRICH-SCHILLER-UNIVERSITÄT, Jena, XP008105543 * |
| H. P. DETTMAR, G. S. BARBOUR, K. T. BLACKWELL, T. P. VOGL, D. L. ALKON, F. S. FRY JR, J. E. TOTAH, T. L. CHAMBERS: "Orange juice classification with a biologically based neural network", COMPUTERS & CHEMISTRY, vol. 20, no. 2, June 1996 (1996-06-01), pages 261 - 266, XP007903556, DOI: 10.1016/0097-8485(95)00015-1 * |
| J. ZUPAN, M. NOVIC, X. LI, J. GASTEIGER: "Classification of multicomponent analytical data of olive oils using different neural networks", ANALYTICA CHIMICA ACTA, vol. 292, no. 3, 11 July 1994 (1994-07-11), pages 219 - 234, XP007903558, DOI: 10.1016/0003-2670(94)00085-9 * |
| K. A. ANDERSON, B. A. MAGNUSON, M. L. TSCHIRGI, B. SMITH: "Determining the geographic origin of potatoes with trace metal analysis using statistical and neural network classifiers", JOURNAL OF AGRICULTURAL AND FOOD CHEMISTRY, vol. 47, no. 4, 20 March 1999 (1999-03-20), pages 1568 - 1575, XP002901663, DOI: 10.1021/jf980677u * |
| K. A. WOLNIK, F. L. FRICKE, S. G. CAPAR, G. L. BRAUDE, M. W. MEYER, R. D. SATZGER, E. BONNIN: "Elements in major raw agricultural crops in the United States, 1: Cadmium and lead in lettuce, peanuts, potatoes, soybeans, sweet corn, and wheat", JOURNAL OF AGRICULTURAL AND FOOD CHEMISTRY, vol. 31, no. 6, November 1983 (1983-11-01), pages 1240 - 1244, XP007903575, DOI: 10.1021/jf00120a024 * |
| K. A. WOLNIK, F. L. FRICKE, S. G. CAPAR, G. L. BRAUDE, M. W. MEYER, R. D. SATZGER, R. W. KUENNEN: "Elements in major raw agricultural crops in the United States, 2: Other elements in lettuce, peanuts, potatoes, soybeans, sweet corn, and wheat", JOURNAL OF AGRICULTURAL AND FOOD CHEMISTRY, vol. 31, no. 6, November 1983 (1983-11-01), pages 1244 - 1249, XP007903574, DOI: 10.1021/jf00120a025 * |
| L.-X. SUN, K. DANZER, G. THIEL: "Classification of wine samples by means of artificial neural networks and discrimination analytical methods", FRESENIUS' JOURNAL OF ANALYTICAL CHEMISTRY, vol. 359, no. 2, September 1997 (1997-09-01), pages 143 - 149, XP007903552, DOI: 10.1007/s002160050551 * |
| L-XIAN SUN ET AL.: "Classification of wine samples by means of artificial neural networks and discrimination analytical methods", FRESENIUS J ANAL CHEM, vol. 359, September 1997 (1997-09-01), pages 143 - 149, XP007903552, DOI: doi:10.1007/s002160050551 |
| NAGY ET AL.: "Adulteration of Fruit Juice Beverages", 1988, MARCEL DEKKER |
| NAGY ET AL.: "Methods to Detect Adulteration of Fruit Juice Beverages", 1995, AGSCIENCE, INC |
| NAGY ET AL.: "Methods to Detect Adulteration of Fruit Juice Beverages", vol. I, 1995, AGSCIENCE, INC |
| OPTIZ ET AL.: "Generating Accurate and Diverse Members of a Neural-Network Ensemble", ADVANCES IN NEURAL INFORMATION SYSTEMS, 1996, pages 535 - 541, XP007903583 |
| R. GOODACRE, D. HAMMONDB, D. B. KELL: "Quantitative analysis of the adulteration of orange juice with sucrose using pyrolysis mass spectrometry and chemometrics", PROCEEDINGS OF THE 12TH INTERNATIONAL SYMPOSIUM ON ANALYTICAL AND APPLIED PYROLYSIS (PYROLISIS'96): OCTOBER 14-18 1996; IN JOURNAL OF ANALYTICAL AND APPLIED PYROLYSIS, vol. 40-41, May 1997 (1997-05-01), pages 135 - 158, XP007903579, DOI: 10.1016/S0165-2370(96)00973-4 * |
| R. MACLIN, D. OPITZ: "An empirical evaluation of bagging and boosting", PROCEEDINGS OF THE 14TH NATIONAL CONFERENCE ON ARTIFICIAL INTELLIGENCE (AAAI'97): JULY 27-31 1997, 27 July 1997 (1997-07-27), pages 546 - 551, XP007918247, Retrieved from the Internet <URL:http://www.aaai.org/Papers/AAAI/1997/AAAI97-085.pdf> * |
| SUN ET AL.: "Classification of wine samples by means of artificial neural networks and discrimination analytical methods", FRESENIUS J ANAL CHEM, vol. 359, September 1997 (1997-09-01), pages 143 - 149, XP007903552, DOI: doi:10.1007/s002160050551 |
| T. G. DIETTERICH: "Machine-learning research: Four current directions", AI MAGAZINE, vol. 18, no. 4, 21 December 1997 (1997-12-21), pages 97 - 136, XP007911056, Retrieved from the Internet <URL:https://www.aaai.org/ojs/index.php/aimagazine/article/view/1324> * |
| WOLNIK ET AL.: "Elements in Major Raw Agricultural Crops in the United States 1. Cadmium and Lead in Lettuce, Peanuts, Potatoes, Soyabeans, Sweet Corn and Wheat", J AGRIC FOOD CHEM, vol. 31, 1983, pages 1240 - 1244, XP007903575, DOI: doi:10.1021/jf00120a024 |
| WOLNIK ET AL.: "Elements in Major Raw Agricultural Crops in the United States 2. Other Elements in Lettuce, Peanuts, Potatoes, Soyabeans, Sweet Corn and Wheat", J AGRIC FOOD CHEM, vol. 31, 1983, pages 1244 - 1249, XP007903574, DOI: doi:10.1021/jf00120a025 |
Cited By (11)
| Publication number | Priority date | Publication date | Assignee | Title |
|---|---|---|---|---|
| WO2001040795A3 (fr) * | 1999-12-02 | 2001-10-18 | Risoe Nat Lab | Procede permettant de determiner si un produit a ete organiquement produit |
| WO2014032121A1 (fr) * | 2012-09-03 | 2014-03-06 | Australian Egg Corporation Limited | Procédé et système permettant de classer un aliment |
| AU2013204502B2 (en) * | 2012-09-03 | 2016-01-07 | Source Science And Technology Pty Ltd | Method and system for classifying a foodstuff |
| CN105181907A (zh) * | 2015-10-13 | 2015-12-23 | 中国地质大学(武汉) | 一种定量判别软玉产地的方法 |
| WO2017063174A1 (fr) * | 2015-10-13 | 2017-04-20 | 中国地质大学(武汉) | Procédé de distinction quantitative des origines de la néphrite |
| CN109635705A (zh) * | 2018-12-05 | 2019-04-16 | 上海交通大学 | 一种基于二维码和深度学习的商品识别方法及装置 |
| CN109635705B (zh) * | 2018-12-05 | 2021-04-27 | 上海交通大学 | 一种基于二维码和深度学习的商品识别方法及装置 |
| CN109858246A (zh) * | 2018-12-24 | 2019-06-07 | 福州大学 | 一种针对控制信号型硬件木马的分类方法 |
| CN109858246B (zh) * | 2018-12-24 | 2022-06-14 | 福州大学 | 一种针对控制信号型硬件木马的分类方法 |
| CN110443119A (zh) * | 2019-06-25 | 2019-11-12 | 中车工业研究院有限公司 | 车厢内货物状态识别方法及装置 |
| CN113505661A (zh) * | 2021-06-22 | 2021-10-15 | 中国农业大学 | 产地鉴别的方法、装置、电子设备及存储介质 |
Also Published As
| Publication number | Publication date |
|---|---|
| EP1008952A3 (fr) | 2003-11-12 |
| US6324531B1 (en) | 2001-11-27 |
Similar Documents
| Publication | Publication Date | Title |
|---|---|---|
| US6324531B1 (en) | System and method for identifying the geographic origin of a fresh commodity | |
| Kang et al. | Advances in machine learning and hyperspectral imaging in the food supply chain | |
| Çetin et al. | Using hyperspectral imaging technology and machine learning algorithms for assessing internal quality parameters of apple fruits | |
| Xia et al. | Recent advances in emerging techniques for non-destructive detection of seed viability: A review | |
| Anderson et al. | Determining the geographic origin of potatoes with trace metal analysis using statistical and neural network classifiers | |
| Sabzi et al. | Estimation of nitrogen content in cucumber plant (Cucumis sativus L.) leaves using hyperspectral imaging data with neural network and partial least squares regressions | |
| Fan et al. | Detection of blueberry internal bruising over time using NIR hyperspectral reflectance imaging with optimum wavelengths | |
| Yang et al. | Classification of blueberry fruit and leaves based on spectral signatures | |
| Galvan et al. | E-sensing and nanoscale-sensing devices associated with data processing algorithms applied to food quality control: a systematic review | |
| Liu et al. | Colorimetric sensor array combined with chemometric methods for the assessment of aroma produced during the drying of tencha | |
| US7130834B2 (en) | Identification system and method for determining the geographic origin of a fresh commodity | |
| Lima et al. | A machine learning proposal method to detect milk tainted with cheese whey | |
| Velásquez et al. | Enhancing anthracnose detection in mango at early stages using hyperspectral imaging and machine learning | |
| Sudarjat et al. | Rapid and non-destructive detection of insect infestations on intact mango by means of near infrared spectroscopy | |
| Nargesi et al. | Detection of chlorine in potassium chloride and potassium sulfate using chemical imaging and artificial neural network | |
| Noutfia et al. | What can artificial intelligence approaches bring to an improved and efficient harvesting and postharvest handling of date fruit (Phoenix dactylifera L.)? A review | |
| Yan et al. | Citrus huanglongbing detection: A hyperspectral data-driven model integrating feature band selection with machine learning algorithms | |
| Li et al. | Combined gramian angular difference field image coding and improved mobile vision transformer for determination of apple soluble solids content by Vis-NIR spectroscopy | |
| Singh et al. | A comprehensive review of the dairy pasteurization process using machine learning models | |
| Dilillo et al. | Enhancing lettuce classification: Optimizing spectral wavelength selection via CCARS and PLS-DA | |
| Onwimol et al. | Non-destructive assessment of hemp seed vigor using machine learning and deep learning models with hyperspectral imaging | |
| Basak et al. | Prediction of physicochemical properties of strawberry fruits using convolutional neural network-regression models | |
| Luyssaert et al. | Evaluation of forest nutrition based on large-scale foliar surveys: are nutrition profiles the way of the future? | |
| Abinaya et al. | Artificial intelligence (AI) in food processing | |
| Wu et al. | Construction of a prediction model for tomato leaf peroxidase activity using micro-hyperspectral imaging technology and a convolutional neural network |
Legal Events
| Date | Code | Title | Description |
|---|---|---|---|
| PUAI | Public reference made under article 153(3) epc to a published international application that has entered the european phase |
Free format text: ORIGINAL CODE: 0009012 |
|
| AK | Designated contracting states |
Kind code of ref document: A2 Designated state(s): AT BE CH CY DE DK ES FI FR GB GR IE IT LI LU MC NL PT SE |
|
| AX | Request for extension of the european patent |
Free format text: AL;LT;LV;MK;RO;SI |
|
| RAP1 | Party data changed (applicant data changed or rights of an application transferred) |
Owner name: FLORIDA DEPARTMENT OF CITRUS AND IDAHO POTATO COM Owner name: FLORIDA DEPARTMENT OF CITRUS |
|
| PUAL | Search report despatched |
Free format text: ORIGINAL CODE: 0009013 |
|
| AK | Designated contracting states |
Kind code of ref document: A3 Designated state(s): AT BE CH CY DE DK ES FI FR GB GR IE IT LI LU MC NL PT SE |
|
| AX | Request for extension of the european patent |
Extension state: AL LT LV MK RO SI |
|
| RIC1 | Information provided on ipc code assigned before grant |
Ipc: 7G 01N 33/02 B Ipc: 7G 06N 3/04 A |
|
| 17P | Request for examination filed |
Effective date: 20040512 |
|
| RAP1 | Party data changed (applicant data changed or rights of an application transferred) |
Owner name: FLORIDA DEPARTMENT OF CITRUS AND IDAHO POTATO COMM Owner name: IDAHO POTATO COMMISSION |
|
| AKX | Designation fees paid |
Designated state(s): DE ES FR GB IT NL |
|
| RAP1 | Party data changed (applicant data changed or rights of an application transferred) |
Owner name: IDAHO POTATO COMMISSION |
|
| 17Q | First examination report despatched |
Effective date: 20071214 |
|
| RIC1 | Information provided on ipc code assigned before grant |
Ipc: G01N 33/02 20060101ALI20110914BHEP Ipc: G06N 3/04 20060101AFI20110914BHEP |
|
| STAA | Information on the status of an ep patent application or granted ep patent |
Free format text: STATUS: THE APPLICATION IS DEEMED TO BE WITHDRAWN |
|
| 18D | Application deemed to be withdrawn |
Effective date: 20111105 |