EP1016880A2 - Procédé d'ajustement automatique d'échelle de velocité et fréquence de répétition d'impulsions pour spectrogrammes dans une sonde d'ultrasons à effet Doppler - Google Patents
Procédé d'ajustement automatique d'échelle de velocité et fréquence de répétition d'impulsions pour spectrogrammes dans une sonde d'ultrasons à effet Doppler Download PDFInfo
- Publication number
- EP1016880A2 EP1016880A2 EP99310493A EP99310493A EP1016880A2 EP 1016880 A2 EP1016880 A2 EP 1016880A2 EP 99310493 A EP99310493 A EP 99310493A EP 99310493 A EP99310493 A EP 99310493A EP 1016880 A2 EP1016880 A2 EP 1016880A2
- Authority
- EP
- European Patent Office
- Prior art keywords
- signals
- memory
- rows
- doppler
- value
- Prior art date
- Legal status (The legal status is an assumption and is not a legal conclusion. Google has not performed a legal analysis and makes no representation as to the accuracy of the status listed.)
- Granted
Links
Images


Classifications
-
- G—PHYSICS
- G01—MEASURING; TESTING
- G01S—RADIO DIRECTION-FINDING; RADIO NAVIGATION; DETERMINING DISTANCE OR VELOCITY BY USE OF RADIO WAVES; LOCATING OR PRESENCE-DETECTING BY USE OF THE REFLECTION OR RERADIATION OF RADIO WAVES; ANALOGOUS ARRANGEMENTS USING OTHER WAVES
- G01S15/00—Systems using the reflection or reradiation of acoustic waves, e.g. sonar systems
- G01S15/88—Sonar systems specially adapted for specific applications
- G01S15/89—Sonar systems specially adapted for specific applications for mapping or imaging
- G01S15/8906—Short-range imaging systems; Acoustic microscope systems using pulse-echo techniques
- G01S15/8979—Combined Doppler and pulse-echo imaging systems
-
- A—HUMAN NECESSITIES
- A61—MEDICAL OR VETERINARY SCIENCE; HYGIENE
- A61B—DIAGNOSIS; SURGERY; IDENTIFICATION
- A61B8/00—Diagnosis using ultrasonic, sonic or infrasonic waves
- A61B8/48—Diagnostic techniques
- A61B8/488—Diagnostic techniques involving Doppler signals
-
- G—PHYSICS
- G01—MEASURING; TESTING
- G01S—RADIO DIRECTION-FINDING; RADIO NAVIGATION; DETERMINING DISTANCE OR VELOCITY BY USE OF RADIO WAVES; LOCATING OR PRESENCE-DETECTING BY USE OF THE REFLECTION OR RERADIATION OF RADIO WAVES; ANALOGOUS ARRANGEMENTS USING OTHER WAVES
- G01S7/00—Details of systems according to groups G01S13/00, G01S15/00, G01S17/00
- G01S7/52—Details of systems according to groups G01S13/00, G01S15/00, G01S17/00 of systems according to group G01S15/00
- G01S7/52017—Details of systems according to groups G01S13/00, G01S15/00, G01S17/00 of systems according to group G01S15/00 particularly adapted to short-range imaging
- G01S7/52023—Details of receivers
- G01S7/52025—Details of receivers for pulse systems
- G01S7/52026—Extracting wanted echo signals
-
- A—HUMAN NECESSITIES
- A61—MEDICAL OR VETERINARY SCIENCE; HYGIENE
- A61B—DIAGNOSIS; SURGERY; IDENTIFICATION
- A61B8/00—Diagnosis using ultrasonic, sonic or infrasonic waves
- A61B8/06—Measuring blood flow
-
- G—PHYSICS
- G01—MEASURING; TESTING
- G01S—RADIO DIRECTION-FINDING; RADIO NAVIGATION; DETERMINING DISTANCE OR VELOCITY BY USE OF RADIO WAVES; LOCATING OR PRESENCE-DETECTING BY USE OF THE REFLECTION OR RERADIATION OF RADIO WAVES; ANALOGOUS ARRANGEMENTS USING OTHER WAVES
- G01S15/00—Systems using the reflection or reradiation of acoustic waves, e.g. sonar systems
- G01S15/02—Systems using the reflection or reradiation of acoustic waves, e.g. sonar systems using reflection of acoustic waves
- G01S15/50—Systems of measurement, based on relative movement of the target
- G01S15/58—Velocity or trajectory determination systems; Sense-of-movement determination systems
- G01S15/582—Velocity or trajectory determination systems; Sense-of-movement determination systems using transmission of interrupted pulse-modulated waves and based upon the Doppler effect resulting from movement of targets
- G01S15/584—Velocity or trajectory determination systems; Sense-of-movement determination systems using transmission of interrupted pulse-modulated waves and based upon the Doppler effect resulting from movement of targets with measures taken for suppressing velocity ambiguities, i.e. anti-aliasing
-
- G—PHYSICS
- G01—MEASURING; TESTING
- G01S—RADIO DIRECTION-FINDING; RADIO NAVIGATION; DETERMINING DISTANCE OR VELOCITY BY USE OF RADIO WAVES; LOCATING OR PRESENCE-DETECTING BY USE OF THE REFLECTION OR RERADIATION OF RADIO WAVES; ANALOGOUS ARRANGEMENTS USING OTHER WAVES
- G01S7/00—Details of systems according to groups G01S13/00, G01S15/00, G01S17/00
- G01S7/52—Details of systems according to groups G01S13/00, G01S15/00, G01S17/00 of systems according to group G01S15/00
- G01S7/52017—Details of systems according to groups G01S13/00, G01S15/00, G01S17/00 of systems according to group G01S15/00 particularly adapted to short-range imaging
- G01S7/52053—Display arrangements
- G01S7/52057—Cathode ray tube displays
- G01S7/5206—Two-dimensional coordinated display of distance and direction; B-scan display
- G01S7/52066—Time-position or time-motion displays
Definitions
- This invention relates to ultrasonic diagnostic systems which measure the velocity of fluid flow using spectral Doppler techniques.
- the invention relates to automatic adjustment of velocity scale and pulse repetition frequency for such systems.
- Ultrasonic scanners for detecting blood flow based on the Doppler effect are well known. Such systems operate by actuating an ultrasonic transducer array to transmit ultrasonic waves into the object and receiving ultrasonic echoes backscattered from the object. In the measurement of blood flow characteristics, returning ultrasonic waves are compared to a frequency reference to determine the frequency shift imparted to the returning waves by flowing scatterers, such as blood cells. This frequency shift translates into the velocity of the blood flow.
- the pulsed or continuous wave (CW) Doppler waveform is computed and displayed by a video processor in real-time as a gray-scale spectrogram of velocity versus time with the gray-scale intensity (or color) modulated by the spectral power.
- the data for each spectral line comprises a multiplicity of frequency data bins for different frequency intervals, the spectral power data in each bin for a respective spectral line being displayed in a respective pixel of a respective column of pixels on the display monitor.
- Each spectral line represents an instantaneous measurement of blood flow.
- Each vertical line in the spectral display corresponds to a Doppler frequency spectrum at a given time instant.
- Positive Doppler frequencies correspond to flow towards the transducer, and negative frequencies correspond to flow away from transducer.
- the Doppler shift limits are +/-PRF/2, where PRF is the pulse repetition frequency, or the sampling frequency of the Doppler signal.
- PRF is the pulse repetition frequency, or the sampling frequency of the Doppler signal.
- the velocity distribution within the pulsed Doppler sample volume in a vessel can be positive or negative depending on the flow direction with respect to the transducer. If the Doppler spectrogram display is inverted because the flow is all negative, the user can press an invert key to invert the Doppler spectral lines, such that -PRF/2 maps to the top of the spectrogram display.
- Aliasing occurs when the pulse repetition frequency (PRF) is below the Nyquist rate of the random Doppler signal, and for example results in the positive frequency spectrum being wrapped around to the negative frequency axis.
- PRF pulse repetition frequency
- f shift can effectively unwrap the spectrum.
- baseline shifts are usually effected by the operator via a toggle switch on the front panel. Often this will require the user to toggle the baseline shift key a few times depending on the f shift step size.
- the spectrum bandwidth is larger than PRF, however, it can not be unwrapped simply by adjusting the polarity or baseline position of the velocity scale. In that case, the user must increase the PRF thereby extending the limits of the velocity scale via a front-panel control switch.
- the spectrum bandwidth is much smaller than the current PRF setting, the user will usually reduce the PRF to expand the height of the spectrogram in the display area.
- Typical clinical Doppler exams can be time-consuming since they involve adjustment of a variety of control keys and switches for sample volume size, flow direction cursor angle, velocity limits (PRF), baseline shift and invert, auto max/mean velocity trace etc. As a result, there is a need for automating some of these basic Doppler adjustments in order to improve both the speed and reliability of the Doppler exam.
- PRF velocity limits
- the preferred embodiment of the invention is useful in an ultrasound system comprising a Doppler image display unit for displaying a Doppler image with an adjustable polarity and an adjustable position along the frequency axis.
- the embodiment improves the appearance of the Doppler image by transmitting ultrasound waves at a predetermined pulse repetition frequency, preferably by an ultrasound transmitter unit.
- Doppler signals are generated in response to the ultrasound waves backscattered from a subject under study, preferably by an ultrasound receiver unit.
- Memory signals having memory values are stored.
- the memory signals include first signals having first values representing the magnitudes of at least some of the component frequencies of the Doppler signals generated over a predetermined time period in response to the backscattered ultrasound waves due to fluid flow in a first direction and second signals having second values representing the magnitudes of at least some of the component frequencies of the Doppler signals generated over the predetermined time period in response to the backscattered ultrasound waves due to fluid flow in a second direction opposite the first direction.
- the storing preferably is accomplished in a digital memory.
- a third signal having a third value related to a noise signal level present in the system is generated.
- the memory values are analyzed based at least in part on the third value, preferably by a logic unit.
- One or more of the polarity, position and pulse repetition frequency (PRF) may be adjusted in response to the analyzing whereby the Doppler image generated by the Doppler image display unit is changed.
- PRF pulse repetition frequency
- the polarity and position of a Doppler image are automatically adjusted and the PRF is automatically adjusted, thereby aiding the reading and interpretation of the Doppler image. For example, if the spectrum is aliased, it will be automatically unwrapped via baseline shift and/or an increase in PRF. If the spectrum is inverted, it can be automatically inverted back for an upright display. If the spectrum bandwidth is too small relative the current PRF or velocity limits, the PRF is automatically reduced for optimal display.
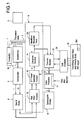
- FIG. 1 is a schematic block diagram showing the signal processing chain for a preferred spectral Doppler mode of an ultrasound imaging system made in accordance with the invention.
- I and Q denote the in-phase and quadrature components of the demodulated signal, respectively.
- FIG. 1A is a schematic block diagram of a portion 12 of the system shown in Fig. 1.
- FIG. 2 is a graph showing a typical Doppler image created on a display unit.
- FIG. 4 is a flow diagram of a preferred form of algorithm in accordance with the invention.
- FIG. 5 is an illustration of data arrangements in a memory according to a preferred embodiment of the invention.
- FIG. 6A - 6D are illustrations of arbitrary data arrangements in the memory illustrating the identification of portions of the data by the algorithm of FIG.4.
- FIG. 7 is a graph showing a Doppler image resulting from aliasing.
- FIG. 8 is an illustration of the data arrangement in the memory resulting in the image of FIG. 7.
- FIG. 9 is a graph showing the Doppler image resulting from operation of the algorithm of FIG. 4 on the data of FIG. 8.
- a transmitter unit 1 energizes an ultrasound transducer array 2 to transmit ultrasound bursts which are fired repeatedly at a pulse repetition frequency (PRF) so that ultrasound waves are backscattered from a predetermined portion or volume of a patient or subject under study.
- PRF pulse repetition frequency
- An exemplary transmitter unit is shown in U.S. Patent No. 5,349,524 (Daft et al.)
- the transmitter unit includes a control 1A for adjusting the PRF which is typically in the kilohertz range.
- the array 2 may be continuously energised.
- the return RF signals are detected by the transducer elements and then formed into a receive beam by a receive beamformer 4.
- the summed RF signal from each firing is demodulated by a demodulator 6 into its in-phase and quadrature ( I/Q ) components.
- the I/Q components are integrated (summed) over a specific time interval and then sampled by block 8.
- the summing interval and transmit burst length together define the length of the sample volume as specified by the user.
- the "sum and dump" operation effectively yields the Doppler signal corresponding to the ultrasound signal backscattered from the sample volume in the patient.
- the Doppler signal is transmitted to a midprocessor 9 which includes a logic unit, such as a digital signal processor (DSP) not shown.
- a logic unit such as a digital signal processor (DSP) not shown.
- DSP digital signal processor
- a microprocessor, microsequencer or microcontroller may be employed.
- Hardwired logic units also can be utilized to perform the operations described in connection with the DSP.
- the Doppler signal is assessed by the DSP through a digital wall filter function 10 which rejects any clutter in the signal corresponding to stationary or very slow moving tissue.
- the filtered signals are used by the DSP to perform an FFT power spectrum function or algorithm 12 which typically takes Fast Fourier Transforms (FFT's) over a moving time window of 64 to 128 samples.
- Function 12 generates frequency signals having values representing the magnitudes of at least some of the Doppler component frequencies represented by the output of wall filter function 10.
- Each FFT power spectrum is compressed by the DSP in a compressor function 14 and the resulting signals are stored in a time line memory (TLM) 22.
- TLM time line memory
- the signals from memory 22 are mapped by a video processor 16 to a gray scale map for display on monitor 18 as a single spectral line at a particular time point in the Doppler velocity (frequency) versus time spectrogram.
- the data for the spectral line is stored in a time line memory 22.
- the gray scale map is stored in a memory 17 within the video processor 16.
- Fig. 2 shows a typical Doppler image on display 18.
- a host logic unit 24 such as a computer, microprocessor, microsequencer, microcontroller or hard wired circuits for conducting logic operations, communicates with the DSP in midprocessor 9, video processor 16 and time line memory 22.
- a user communicates with computer 24 via front panel control keys, including a key (not shown) for inverting the image on display 18 and shifting the frequency baseline of display 18.
- Fig 1A shows the key computations involved in FFT power spectrum function 12 which generates the individual spectral lines with the selected polarity and frequency baseline in the spectogram display 18. Central to this is the FFT operation 30 which transforms windowed I/Q data segments to the frequency domain.
- the frequency domain signals are shifted and/or inverted in operation 32. This operation results in an inversion or vertical shifting of the Doppler image on display 18.
- Operation 34 takes the absolute magnitude squared of the signals produced by operation 32 to generate power spectrum signals.
- the power spectrum signals are averaged, and/or interpolated to fill up the TLM.
- the magnitude of the resulting power spectra signals are compressed via a logarithmic function 14 (Fig. 1) for the video display 18 which typically has 6-8 bits of gray map resolution.
- the maximum/mean frequency waveform of the compressed spectrum can be traced out over time and superposed (not shown) on spectrogram display 18.
- x is typically a 12 to 16-bit integer.
- the preferred embodiment of the present invention calculates a noise threshold which is a function of the mean noise level m of the signals resulting from the FFT power spectrum function (shown as X in Fig. 1) which can be estimated using a system noise model.
- the noise threshold can be determined empirically by measuring noise at various system gain settings and preparing a table of values of noise versus gain.
- the table can be implemented as a look up table in host computer 24 which includes one or more logic units. When the gain changes by operator manipulation of control keys 26, the value of the noise threshold changes in accordance with the look up table.
- the look up table can be implemented in hardware.
- the Doppler sample volume has already been positioned at the site of interest within the patient or subject under study S (Fig. 1), and that a clear spectral waveform has appeared on the display 18, except that the spectral waveform may be asymmetric about the baseline, inverted, aliased or has a frequency span much smaller than the current velocity scale.
- the auto velocity scale PRF adjustment can be activated via a single button 26A.
- the spectral data in memory 22 can be periodically sampled to see if velocity scale and PRF adjustments are needed.
- Computer 24 then preferably executes the algorithm shown in FIG. 4 on the data arrangement shown in section B of FIG. 5.
- step S10 the most recent image segment of N spectral lines that cover at least one complete cardiac cycle (i.e., time period CC shown in Fig. 2, e.g., 1.5 sec.), is retrieved from the memory 22.
- N is a function of the time-line sweep speed which is user-adjustable via a front-panel 26 control key.
- the spectrum intensity ranges from 0 to 255.
- the preferred method for estimating the spectral noise floor or threshold assumes that the system noise originates primarily from the pre-amp in each receive channel in the beamformer 4 of a digital scanner.
- the pre-amp Johnson noise can be specified as a root-mean-square (RMS) voltage per Hz 1 ⁇ 2 at room temperature 6.
- RMS root-mean-square
- knowing the equivalent noise bandwidth of all the filters in the Doppler signal path enables an absolute RMS noise level to be computed as a function of system gain knob (user adjustable) on front panel 26. Any quantization noise due to analog-to-digital conversion also can be added in an appropriate manner.
- the total system noise can be computed by summing over all active receive channels (including array apodization effects) for a given sample volume position. Dividing this total noise level by the number of FFT points yields the mean spectral noise power m of the exponential distribution (Eqn. 1).
- Eqn. 1 the mean spectral noise power m of the exponential distribution
- a coordinate system needs to be specified.
- One exemplary coordinate system is to re-arrange the positive and negative frequency portions of the spectral data from memory 22 as shown in Figure 5.
- the proposed coordinate system is convenient in that any aliased forward or reverse flow spectrum in the image is unfolded automatically for analysis.
- the wall signal rejection regions bounded by the negative (-f cut ) and positive (f cut ) cutoff points of wall filter function 10 are excluded.
- the rows from the top to bottom are numbered 0 to n.
- the columns are numbered 0-N.
- Fig. 5 represents memory locations addressable in o-n rows and 0-N columns.
- the memory locations store groups of signals Dl and D2 responsive to fluid flow in subject S in a first direction and signals D3 responsive to fluid flow in subject S in a second direction opposite the first direction.
- Section A of Fig. 5 shows the arrangement of spectral data in memory 22 as will be displayed on the video monitor.
- Section B of Fig. 5 shows the arrangement of data in a memory of computer 24 after the coordinate system is specified.
- the zero frequency/velocity baseline in the spectral image may be shifted up or down, but in the example of Section A, the baseline is positioned at the middle of the frequency axis (i.e. no baseline shift), so that in Section B, row n /2 separates signals resulting from fluid flow in subject S in opposite directions. Fluid flow in a positive direction results in signals in rows n /2 to n ; fluid flow in a negative direction results in signals in rows 0 to n /2.
- aliasing can cause signals indicating negative fluid flow even though they resulted from positive fluid flow and vice versa.
- the first test is to check if the data contains pure noise only, or the signal is so weak that it will not be possible to perform a reliable edge detection. Since the theoretical noise distribution has been computed in Step S12, many simple threshold tests are possible. For example, of the Nxn samples in the data, if the maximum signal value does not exceed the upper noise threshold by a minimum amount, and/or the mean data value over all the memory locations does not exceed the theoretical mean noise value by a minimum amount, then the data is considered to be "too noisy,” and nothing needs to be done, and the program is exited in step S18.
- Step S20 checks if all rows in the data contain signal (as opposed to noise). If so, the data bandwidth is equal to or larger than the current PRF, and the PRF should be increased. Some simple threshold tests can be used. For example, if fewer than approximately 5 rows have mean values less than the theoretical mean noise value, then the signal data is considered to have spanned the entire frequency axis. If this test proves positive, the PRF can be increased by a factor (e.g. two times) that may depend on the difference between the row with the highest mean intensity and that with the lowest mean intensity. If the difference is small, chances are higher that the spectrogram is wrapped around multiple times, in which case PRF should be increased in step S22 by a larger factor. The PRF is increased by having computer 24 send a signal to control 1A of transmitter 1 (Fig. 1).
- the algorithm waits for a new spectral data segment (one second or more) to be generated in the TLM 22, and then repeats the above steps starting from Step S10. If the number of times PRF has been increased reaches some maximum limit (e.g. two times), or the PRF has already reached its maximum limit, but the data is still in "all signal" state, then the algorithm is exited.
- some maximum limit e.g. two times
- step S24 the data value statistics are analyzed row by row, and a search is conducted for rows which show significant deviations from the predicted noise value statistics.
- the most comprehensive test is to compare a data value histogram for each row (or set of adjacent rows) against the theoretical noise distribution, based on standard histogram tests. The histogram plots data value versus number of occurrences for each row shown in section B of Fig. 5.
- some key statistical parameters that characterize the data value histogram for each row can be used to determine whether a row contains one or more signal values or only noise values. For example, if the mean value of a row exceeds the theoretical mean, the row contains one or more signal values. For another example, if the number of sample values which have exceeded the upper noise threshold value are greater than a minimum number, e.g. , 3, the row contains one or more signal values.
- Step S24 also identifies the widest group of adjacent rows of noise in the memory locations.
- a filter can be applied to the row statistic(s) over successive rows.
- a simple example is a smoothing filter which takes a moving average over, say, 5 rows.
- the filter in general does not have to be linear.
- a median filter can be used to smooth the row statistic(s) while preserving edges.
- FIGS 6A-6D show arbitrary groups of signal data SD1-SD5 in the memory locations illustrated in section B of Fig. 5.
- the locations outside groups SD1-SD5 are noise or zero signal value.
- the data groups form boundaries B1-B10. As depicted in Figures 6A-6D, four cases are possible.
- Step S28 finds the two edges of the memory signal data which will enable determination of optimal PRF and baseline position.
- An edge is defined as the outermost row in the signal data (as opposed to noise data) which exceeds a noise threshold value.
- the row numbers are indicated by Edge 1 and Edge2 in each of the four cases in Figures 6A-6D.
- the search for Edge 1 and Edge2 is carried out in a sequential manner starting from row 0 down to row n. However, it is advantageous (but not required) to first identify the widest noise region in which the number of successive rows with mean signal values below the noise threshold is greatest. Using the case of Fig. 6B as an example, the widest noise region is that between Edge1 and Edge2. The widest noise region was determined in step S24.
- a search is conducted in both directions (increasing and decreasing row numbers) for the first rows which exceed the noise threshold criterion. This avoids searching through the signal regions which may contain rows that happen (due to its statistical nature) to have low mean values.
- the noise threshold criterion may be based on the first row whose mean signal value has exceeded the theoretical mean noise value (plus some offset), or the first row with more than a small number of data samples (e.g. 5) exceeding the upper noise threshold value calculated from Step S12, or the first row in which the total intensity above the noise threshold ( TI ) as calculated from step S24 is greater than an empirically-determined signal threshold, for example, 5 db for the dynamic range setting in use.
- the search locates a portion of boundaries B1-B10. To make this process more robust under poor signal-to-noise conditions, the edge detection criterion can require a few (e.g., 3-5) successive rows to have exceeded the noise threshold value.
- Step S30 analyzes this case which can occur if a small sample volume in subject S is placed near the center of a large vein, for example.
- Case (D) is an ambiguous case: even though it is surrounded by clear noise regions R2 and R3, the signal data may have aliased to its present position.
- the PRF is increased to either a larger or the maximum possible PRF in step S32. Then steps starting from Step S10 are repeated. (As an option, steps S16, S18 and S20 can be skipped).
- edges 1 and 2 of the data after the PRF increase remain the same in terms of absolute velocity units, then it is not aliased. If the edges have moved to other velocity positions, or if some of the locations of some of the signals at or near boundaries B9 and B10 have moved, the data must have been aliased before the PRF increase. In fact, it could still be aliased at maximum PRF, and a warning message should be displayed or a user of the system should otherwise be informed or signaled.
- the widths of the positive (forward flow) and negative (reverse flow) frequency portions of the data are determined in step S34. If the negative frequency width is larger than the positive frequency width, the signal data is considered to be inverted (i.e. the taller of the forward and reverse flow spectra is pointing downwards in the original data (Section A of Figure 5)). An auto invert flag is set to the "invert" state.
- the width can be determined by counting rows or subtracting row numbers identified by the edges identified by step S28.
- Figs. 6B and 6C are examples of inverted groups of data signals. Fig 6A is an example of noninverted data signals.
- the total row count for all memory locations corresponding to signals (as opposed to noise) is computed. This is converted into total velocity range or frequency bandwidth of the data based on the current velocity/frequency scale of display 18.
- the optimal PRF is given by this data frequency bandwidth divided by a scale factor (e.g. 75%), which specifies the desired fraction of the total number of pixel rows of display 18 to be covered by the flow spectra (i.e., it is desirable to allow some margin between the upper edge of the spectrogram and the upper limit of the velocity scale). If the optimal PRF is not an available PRF setting, the new PRF can be set at the smallest PRF above the optimal PRF.
- a scale factor e.g. 75%)
- step S36 If the current PRF equals the new PRF, there is no need to reduce the PRF, and the algorithm proceeds to step S36.
- the algorithm reduces the PRF to the new PRF, and updates the total spectrogram row number count on the positive and negative frequency axes of display 18 according to the PRF change factor.
- the final step S38 in this algorithm is to effect the invert operation and the optimal baseline shift. If the auto invert flag (from Step S34) is negative (no need to invert), the optimal baseline position (from the bottom as shown in Fig. 2) corresponds to the row count of the negative frequency portion of the data plus some non-zero margin (e.g. 5 rows) to ensure that the spectrogram image of display 18 will not be touching the bottom of the display. Since the velocity scale typically consists of a number of tick marks, the baseline position can also be rounded up to match the nearest tick mark.
- the invert operation 32 (Fig. 1A) of function 12 (Fig. 1) is activated.
- the optimal baseline position is based on the row count of the positive portion of the signal spectrogram plus a small margin.
- Fig. 7 shows a typical Doppler image distorted by aliasing in which a group of images I1 appear in the negative flow portion of the display (below baseline BL which is set at zero frequency or velocity). Images I1 inaccurately indicate fluid flow in the negative direction. Images I2 also indicate fluid flow in the negative direction.
- Fig. 8 shows the signals in the memory locations of Section B of Fig. 5 which would result in the display shown in Fig. 7.
- Signal group G1 corresponds to image I1 and appears in the memory locations indicating negative flow (rows o- n /2).
- Signal group G2 corresponds to image I2.
- the algorithm counts the rows in group G2 and shifts baseline BL by a corresponding amount as shown in Fig. 9.
- images I1 and I2 are properly joined with the other signals indicating fluid flow in the positive direction.
- processing blocks 12, 14 and 20 can be combined into a single processor.
Landscapes
- Engineering & Computer Science (AREA)
- Physics & Mathematics (AREA)
- Radar, Positioning & Navigation (AREA)
- Remote Sensing (AREA)
- Health & Medical Sciences (AREA)
- Life Sciences & Earth Sciences (AREA)
- Acoustics & Sound (AREA)
- Computer Networks & Wireless Communication (AREA)
- General Physics & Mathematics (AREA)
- Radiology & Medical Imaging (AREA)
- Molecular Biology (AREA)
- Pathology (AREA)
- Biophysics (AREA)
- Biomedical Technology (AREA)
- Heart & Thoracic Surgery (AREA)
- Medical Informatics (AREA)
- Nuclear Medicine, Radiotherapy & Molecular Imaging (AREA)
- Surgery (AREA)
- Animal Behavior & Ethology (AREA)
- General Health & Medical Sciences (AREA)
- Public Health (AREA)
- Veterinary Medicine (AREA)
- Ultra Sonic Daignosis Equipment (AREA)
- Measurement Of Velocity Or Position Using Acoustic Or Ultrasonic Waves (AREA)
Applications Claiming Priority (2)
| Application Number | Priority Date | Filing Date | Title |
|---|---|---|---|
| US22463398A | 1998-12-31 | 1998-12-31 | |
| US224633 | 1998-12-31 |
Publications (3)
| Publication Number | Publication Date |
|---|---|
| EP1016880A2 true EP1016880A2 (fr) | 2000-07-05 |
| EP1016880A3 EP1016880A3 (fr) | 2003-10-15 |
| EP1016880B1 EP1016880B1 (fr) | 2007-10-10 |
Family
ID=22841504
Family Applications (1)
| Application Number | Title | Priority Date | Filing Date |
|---|---|---|---|
| EP99310493A Expired - Lifetime EP1016880B1 (fr) | 1998-12-31 | 1999-12-23 | Procédé d'ajustement automatique d'échelle de velocité et fréquence de répétition d'impulsions pour spectrogrammes dans une sonde d'ultrasons à effet Doppler |
Country Status (4)
| Country | Link |
|---|---|
| US (1) | US6577967B2 (fr) |
| EP (1) | EP1016880B1 (fr) |
| JP (1) | JP4740436B2 (fr) |
| DE (1) | DE69937284T2 (fr) |
Cited By (8)
| Publication number | Priority date | Publication date | Assignee | Title |
|---|---|---|---|---|
| WO2003019227A1 (fr) * | 2001-08-28 | 2003-03-06 | Koninklijke Philips Electronics N.V. | Optimisation automatique de parametres d'affichage doppler |
| EP1798573A2 (fr) | 2005-12-16 | 2007-06-20 | Medison Co., Ltd. | Système de diagnostic à ultrasons et méthode de représentation du spectre Doppler de multiples volumes d'échantillonnage |
| WO2008034182A1 (fr) * | 2006-09-20 | 2008-03-27 | Apollo Medical Imaging Technology Pty Ltd | Procédé et système de traitement automatisé d'image - perfusion en un seul clic |
| EP1970011A1 (fr) * | 2007-03-16 | 2008-09-17 | Medison Co., Ltd. | Système de diagnostic à ultrasons et procédé d'affichage d'une image de spectre Doppler |
| CN101884551A (zh) * | 2009-05-15 | 2010-11-17 | 深圳迈瑞生物医疗电子股份有限公司 | 提高超声多普勒成像自动调整性能的方法及其超声系统 |
| CN106572815A (zh) * | 2014-09-19 | 2017-04-19 | 松下知识产权经营株式会社 | 生物信息检测装置以及床 |
| CN108852406A (zh) * | 2017-05-10 | 2018-11-23 | 深圳市理邦精密仪器股份有限公司 | 多普勒超声成像的prf优化方法及装置 |
| CN109998596A (zh) * | 2019-04-08 | 2019-07-12 | 深圳市贝斯曼精密仪器有限公司 | 一种具有血流流向检测功能的超声探测装置 |
Families Citing this family (44)
| Publication number | Priority date | Publication date | Assignee | Title |
|---|---|---|---|---|
| US6398765B1 (en) * | 1999-03-01 | 2002-06-04 | Pro Duct Health, Inc. | Apparatus, methods and kits for simultaneous delivery of a substance to multiple breast milk ducts |
| US6663566B2 (en) * | 2002-02-19 | 2003-12-16 | Ge Medical Systems Global Technology Company, Llc | Method and apparatus for automatic control of spectral doppler imaging |
| JP2006520619A (ja) * | 2003-02-13 | 2006-09-14 | コーニンクレッカ フィリップス エレクトロニクス エヌ ヴィ | 超音波カラーフロードプラ情報から合成されるフロースペクトログラム |
| US6733454B1 (en) | 2003-02-26 | 2004-05-11 | Siemens Medical Solutions Usa, Inc. | Automatic optimization methods and systems for doppler ultrasound imaging |
| US7578792B2 (en) * | 2003-07-21 | 2009-08-25 | Siemens Medical Solutions Usa, Inc. | Automatic optimization in spectral Doppler ultrasound imaging |
| US20050090747A1 (en) * | 2003-10-06 | 2005-04-28 | Clark David W. | Automatic alias avoidance for doppler audio |
| US7288068B2 (en) * | 2003-12-15 | 2007-10-30 | Siemens Medical Solutions Usa, Inc. | Automatic optimization for ultrasound medical imaging |
| CN100453049C (zh) * | 2004-09-06 | 2009-01-21 | 株式会社东芝 | 超声波诊断装置和超声波信号分析方法 |
| US7627386B2 (en) | 2004-10-07 | 2009-12-01 | Zonaire Medical Systems, Inc. | Ultrasound imaging system parameter optimization via fuzzy logic |
| KR20060124824A (ko) * | 2005-05-26 | 2006-12-06 | 주식회사 메디슨 | 초음파 스펙트럼 영상을 처리하는 방법 및 초음파 진단시스템 |
| US8784318B1 (en) | 2005-07-22 | 2014-07-22 | Zonare Medical Systems, Inc. | Aberration correction using channel data in ultrasound imaging system |
| US8002705B1 (en) | 2005-07-22 | 2011-08-23 | Zonaire Medical Systems, Inc. | Continuous transmit focusing method and apparatus for ultrasound imaging system |
| US7682311B2 (en) * | 2005-09-22 | 2010-03-23 | Siemens Medical Solutions Usa, Inc. | Phase unwrapped velocity display for ultrasound medical imaging |
| KR100842234B1 (ko) * | 2005-10-21 | 2008-06-30 | 주식회사 메디슨 | 도플러 스펙트럼의 베이스라인 및 스케일을 조절하는 영상처리 시스템 및 방법 |
| US8036856B2 (en) | 2005-12-01 | 2011-10-11 | General Electric Company | Method and apparatus for automatically adjusting spectral doppler gain |
| KR100884248B1 (ko) | 2006-08-24 | 2009-02-17 | 주식회사 메디슨 | 초음파 영상을 형성하는 초음파 시스템 및 방법 |
| JP4987295B2 (ja) * | 2005-12-26 | 2012-07-25 | 株式会社東芝 | 超音波診断装置 |
| CN101138507B (zh) * | 2006-09-05 | 2010-05-12 | 深圳迈瑞生物医疗电子股份有限公司 | 多普勒血流声音信号的处理方法及装置 |
| US20080146922A1 (en) * | 2006-10-24 | 2008-06-19 | Zonare Medical Systems, Inc. | Control of user interfaces and displays for portable ultrasound unit and docking station |
| JP5342104B2 (ja) * | 2006-10-30 | 2013-11-13 | 株式会社東芝 | 超音波診断装置及び画像処理プログラム |
| US20080242994A1 (en) * | 2007-03-29 | 2008-10-02 | Aloka Co., Ltd. | Methods and apparatus for ultrasound imaging |
| US20080269610A1 (en) * | 2007-04-25 | 2008-10-30 | General Electric Company | Method and apparatus for automatic optimization of scanning parameters for ultrasound imaging |
| JP5578756B2 (ja) * | 2007-05-02 | 2014-08-27 | 株式会社東芝 | 超音波ドプラ診断装置 |
| US20080312534A1 (en) * | 2007-06-07 | 2008-12-18 | Kyriacos Pitsillides | System and method for power management in a telemetric monitoring system |
| US8142361B2 (en) | 2007-08-28 | 2012-03-27 | Shenzhen Mindray Bio-Medical Electronics Co., Ltd. | Method and apparatus for automatic optimization of doppler imaging parameters |
| JP5025400B2 (ja) * | 2007-09-28 | 2012-09-12 | 株式会社東芝 | 超音波診断装置、及び超音波画像処理装置 |
| US9060669B1 (en) | 2007-12-20 | 2015-06-23 | Zonare Medical Systems, Inc. | System and method for providing variable ultrasound array processing in a post-storage mode |
| KR101468417B1 (ko) * | 2007-12-26 | 2014-12-03 | 삼성메디슨 주식회사 | 스펙트럴 도플러를 형성하는 초음파 시스템 및 방법 |
| KR100951586B1 (ko) | 2008-10-16 | 2010-04-09 | 주식회사 메디슨 | 도플러 스펙트럼 영상을 처리하는 방법 |
| CN102247170B (zh) * | 2010-09-29 | 2014-01-29 | 深圳市蓝韵实业有限公司 | 一种多普勒成像自动优化方法 |
| JP5570955B2 (ja) * | 2010-11-29 | 2014-08-13 | 株式会社東芝 | 超音波診断装置 |
| KR20120067535A (ko) * | 2010-12-16 | 2012-06-26 | 삼성메디슨 주식회사 | 미드 포인트 알고리즘에 기초하여 hprf 도플러 영상을 제공하는 초음파 시스템 및 방법 |
| US20130018268A1 (en) * | 2011-07-12 | 2013-01-17 | Nivasonix, Llc | Scanning Speed Detection for Freehand High Frequency Ultrasound Transducers |
| US9594061B2 (en) * | 2014-02-11 | 2017-03-14 | Orbital Atk, Inc. | Methods and apparatus for detecting defects in an object of interest |
| CA2964186A1 (fr) * | 2014-10-28 | 2016-05-06 | Super Sonic Imagine | Procede et systeme d'ajustement de gain d'image |
| US12298445B2 (en) * | 2014-10-28 | 2025-05-13 | Supersonic Imagine | Method and system for adjusting image gain |
| US9700285B2 (en) * | 2015-06-30 | 2017-07-11 | Siemens Medical Solutions US, Inc. | Spectral doppler imaging with interruption avoidance |
| US11071519B2 (en) * | 2015-11-13 | 2021-07-27 | Orthoforge, Inc. | Medical devices, systems and methods for monitoring and stimulating osteogenesis |
| US11602328B2 (en) * | 2015-12-30 | 2023-03-14 | B-K Medical Aps | Ultrasound flow imaging |
| WO2018006259A1 (fr) * | 2016-07-05 | 2018-01-11 | 悦享趋势科技(北京)有限责任公司 | Procédé et dispositif de détection de tissu physiologique et détecteur |
| WO2021099320A1 (fr) | 2019-11-21 | 2021-05-27 | Koninklijke Philips N.V. | Réduction d'artefact de réverbération dans des images ultrasonores et dispositifs, systèmes et procédés associés |
| CN115990034B (zh) * | 2021-10-19 | 2024-09-10 | 复旦大学 | 一种随机空间采样的超快超声血流成像方法及系统 |
| CN116327247B (zh) * | 2021-12-23 | 2025-12-23 | 北京联影智能影像技术研究院 | 血流运动特征量的显示调节方法、装置及超声系统 |
| US12279912B2 (en) * | 2022-12-06 | 2025-04-22 | Siemens Medical Solutions Usa, Inc. | Spectral doppler envelope tracing without alias in medical ultrasound |
Family Cites Families (23)
| Publication number | Priority date | Publication date | Assignee | Title |
|---|---|---|---|---|
| US4476874A (en) * | 1982-06-01 | 1984-10-16 | Sri International | Ultrasonic imaging with volume flow measuring method and apparatus |
| NL8402588A (nl) * | 1984-08-24 | 1986-03-17 | Stichting Speurwerk Baggertech | Inrichting voor het bepalen van de stroomsnelheid in een stromend medium, onder gebruikmaking van het akoestische doppler-effect. |
| US5313947A (en) * | 1985-02-08 | 1994-05-24 | University Patents, Inc. | CW and pulsed doppler diagnostic system |
| JP3086693B2 (ja) * | 1989-07-06 | 2000-09-11 | 株式会社東芝 | 超音波診断装置 |
| US5633809A (en) * | 1989-12-22 | 1997-05-27 | American Sigma, Inc. | Multi-function flow monitoring apparatus with area velocity sensor capability |
| US5777892A (en) * | 1992-03-30 | 1998-07-07 | Isco, Inc. | Doppler shift velocity measuring system with correction factors |
| US5349524A (en) * | 1993-01-08 | 1994-09-20 | General Electric Company | Color flow imaging system utilizing a time domain adaptive wall filter |
| US5501224A (en) * | 1994-02-28 | 1996-03-26 | Kabushiki Kaisha Toshiba | Ultrasonic diagnostic apparatus |
| JP2721643B2 (ja) * | 1994-03-07 | 1998-03-04 | アロカ株式会社 | 超音波ドプラ診断装置 |
| JPH0810257A (ja) * | 1994-07-01 | 1996-01-16 | Shimadzu Corp | 超音波診断装置 |
| US5501223A (en) * | 1994-11-23 | 1996-03-26 | General Electric Company | Dynamic firing sequence for ultrasound imaging apparatus |
| US6177923B1 (en) * | 1994-12-30 | 2001-01-23 | Acuson Corporation | Imaging modality showing energy and velocity |
| US5676148A (en) * | 1995-03-31 | 1997-10-14 | Siemens Medical Systems Inc. | Method and system for doppler ultrasound audio dealiasing |
| JP3698173B2 (ja) * | 1995-05-24 | 2005-09-21 | 東芝医用システムエンジニアリング株式会社 | 超音波診断装置 |
| US5564424A (en) * | 1995-06-30 | 1996-10-15 | Siemens Medical Systems, Inc. | Method and apparatus for pulsed doppler ultrasound beam-forming |
| WO1997034530A1 (fr) * | 1996-03-18 | 1997-09-25 | Furuno Electric Company, Limited | Appareil de diagnostic a ultrasons |
| US5654509A (en) * | 1996-05-08 | 1997-08-05 | Hewlett-Packard Company | Control system that distinguishes between imaging and nonimaging environments in an ultrasound system |
| US6023977A (en) * | 1997-08-01 | 2000-02-15 | Acuson Corporation | Ultrasonic imaging aberration correction system and method |
| US6176143B1 (en) * | 1997-12-01 | 2001-01-23 | General Electric Company | Method and apparatus for estimation and display of spectral broadening error margin for doppler time-velocity waveforms |
| US5891040A (en) * | 1998-02-18 | 1999-04-06 | Hewlett-Packard Company | Method for maintaining a constant velocity to color map in an ultrasound flow imaging system |
| US6146331A (en) * | 1998-09-30 | 2000-11-14 | Siemens Medical Systems, Inc. | Method for improved clutter suppression for ultrasonic color doppler imaging |
| US6126601A (en) * | 1998-10-29 | 2000-10-03 | Gilling; Christopher J. | Method and apparatus for ultrasound imaging in multiple modes using programmable signal processor |
| US6142943A (en) * | 1998-12-30 | 2000-11-07 | General Electric Company | Doppler ultrasound automatic spectrum optimization |
-
1999
- 1999-11-30 JP JP33953799A patent/JP4740436B2/ja not_active Expired - Lifetime
- 1999-12-23 DE DE69937284T patent/DE69937284T2/de not_active Expired - Lifetime
- 1999-12-23 EP EP99310493A patent/EP1016880B1/fr not_active Expired - Lifetime
-
2001
- 2001-11-26 US US09/994,212 patent/US6577967B2/en not_active Expired - Lifetime
Cited By (14)
| Publication number | Priority date | Publication date | Assignee | Title |
|---|---|---|---|---|
| WO2003019227A1 (fr) * | 2001-08-28 | 2003-03-06 | Koninklijke Philips Electronics N.V. | Optimisation automatique de parametres d'affichage doppler |
| US8353835B2 (en) | 2005-12-16 | 2013-01-15 | Medison Co., Ltd. | Ultrasound diagnostic system and method for displaying doppler spectrum images of multiple sample volumes |
| EP1798573A2 (fr) | 2005-12-16 | 2007-06-20 | Medison Co., Ltd. | Système de diagnostic à ultrasons et méthode de représentation du spectre Doppler de multiples volumes d'échantillonnage |
| EP1798573A3 (fr) * | 2005-12-16 | 2009-09-09 | Medison Co., Ltd. | Système de diagnostic à ultrasons et méthode de représentation du spectre Doppler de multiples volumes d'échantillonnage |
| US7798964B2 (en) | 2005-12-16 | 2010-09-21 | Medison Co., Ltd. | Ultrasound diagnostic system and method for displaying doppler spectrum images of multiple sample volumes |
| WO2008034182A1 (fr) * | 2006-09-20 | 2008-03-27 | Apollo Medical Imaging Technology Pty Ltd | Procédé et système de traitement automatisé d'image - perfusion en un seul clic |
| EP1970011A1 (fr) * | 2007-03-16 | 2008-09-17 | Medison Co., Ltd. | Système de diagnostic à ultrasons et procédé d'affichage d'une image de spectre Doppler |
| CN101884551A (zh) * | 2009-05-15 | 2010-11-17 | 深圳迈瑞生物医疗电子股份有限公司 | 提高超声多普勒成像自动调整性能的方法及其超声系统 |
| CN101884551B (zh) * | 2009-05-15 | 2014-10-15 | 深圳迈瑞生物医疗电子股份有限公司 | 提高超声多普勒成像自动调整性能的方法及其超声系统 |
| CN106572815A (zh) * | 2014-09-19 | 2017-04-19 | 松下知识产权经营株式会社 | 生物信息检测装置以及床 |
| CN108852406A (zh) * | 2017-05-10 | 2018-11-23 | 深圳市理邦精密仪器股份有限公司 | 多普勒超声成像的prf优化方法及装置 |
| CN108852406B (zh) * | 2017-05-10 | 2021-08-10 | 深圳市理邦精密仪器股份有限公司 | 多普勒超声成像的prf优化方法及装置 |
| CN109998596A (zh) * | 2019-04-08 | 2019-07-12 | 深圳市贝斯曼精密仪器有限公司 | 一种具有血流流向检测功能的超声探测装置 |
| CN109998596B (zh) * | 2019-04-08 | 2023-10-03 | 深圳市贝斯曼精密仪器有限公司 | 一种具有血流流向检测功能的超声探测装置 |
Also Published As
| Publication number | Publication date |
|---|---|
| EP1016880A3 (fr) | 2003-10-15 |
| DE69937284T2 (de) | 2008-07-03 |
| EP1016880B1 (fr) | 2007-10-10 |
| JP2000197634A (ja) | 2000-07-18 |
| US20020116141A1 (en) | 2002-08-22 |
| DE69937284D1 (de) | 2007-11-22 |
| US6577967B2 (en) | 2003-06-10 |
| JP4740436B2 (ja) | 2011-08-03 |
Similar Documents
| Publication | Publication Date | Title |
|---|---|---|
| EP1016880B1 (fr) | Procédé d'ajustement automatique d'échelle de velocité et fréquence de répétition d'impulsions pour spectrogrammes dans une sonde d'ultrasons à effet Doppler | |
| EP1176910B1 (fr) | Procede et appareil de suivi automatique de vaisseau sanguin en imagerie ultrasonore | |
| US6296612B1 (en) | Method and apparatus for adaptive wall filtering in spectral Doppler ultrasound imaging | |
| EP1005834B1 (fr) | Méthode et appareil pour l'estimation automatique de l'angle Doppler en imagerie à ultrasons | |
| EP1005833B1 (fr) | Méthode et appareil pour la compensation automatique gain/temps et/ou gain/intensité latérale en imagerie à ultrason en mode B | |
| US6126605A (en) | Ultrasound color flow display optimization by adjusting dynamic range | |
| US6017309A (en) | Ultrasound color flow display optimization by adjusting color maps | |
| EP1152364B1 (fr) | Méthode et dispositif pour la configuration automatique d'une porte d'échantillonage dans un système d'imagerie par ultrasons à effet Doppler impulsionnel | |
| US5935074A (en) | Method and apparatus for automatic tracing of Doppler time-velocity waveform envelope | |
| US6142943A (en) | Doppler ultrasound automatic spectrum optimization | |
| US6162176A (en) | Ultrasound color flow display optimization | |
| EP1008863B1 (fr) | Méthode et dispositif pour l'optimisation de l'onde d'émission dans l'échographie ultra-sonore du type b | |
| US20040102706A1 (en) | Automatic optimization of doppler display parameters | |
| NO831718L (no) | Fremgangsmaate og apparat ved blodstroem-hastighetsmaaling med ultralyd for dannelse av todimensjonal avbildning av blodets hastighet | |
| EP1060406B1 (fr) | Optimisation de l'affichage par code couleur ultrasons avec reglage de seuils au moyen d'echantillonnages | |
| EP1006369B1 (fr) | Procédé et dispositif d'imagerie ultrasonore avec filtrage adaptatif en comptant les valeurs nulles des échantillons acoustiques |
Legal Events
| Date | Code | Title | Description |
|---|---|---|---|
| PUAI | Public reference made under article 153(3) epc to a published international application that has entered the european phase |
Free format text: ORIGINAL CODE: 0009012 |
|
| AK | Designated contracting states |
Kind code of ref document: A2 Designated state(s): AT BE CH CY DE DK ES FI FR GB GR IE IT LI LU MC NL PT SE |
|
| AX | Request for extension of the european patent |
Free format text: AL;LT;LV;MK;RO;SI |
|
| PUAL | Search report despatched |
Free format text: ORIGINAL CODE: 0009013 |
|
| AK | Designated contracting states |
Kind code of ref document: A3 Designated state(s): AT BE CH CY DE DK ES FI FR GB GR IE IT LI LU MC NL PT SE |
|
| AX | Request for extension of the european patent |
Extension state: AL LT LV MK RO SI |
|
| 17P | Request for examination filed |
Effective date: 20040415 |
|
| AKX | Designation fees paid |
Designated state(s): DE NL |
|
| GRAP | Despatch of communication of intention to grant a patent |
Free format text: ORIGINAL CODE: EPIDOSNIGR1 |
|
| GRAS | Grant fee paid |
Free format text: ORIGINAL CODE: EPIDOSNIGR3 |
|
| GRAA | (expected) grant |
Free format text: ORIGINAL CODE: 0009210 |
|
| AK | Designated contracting states |
Kind code of ref document: B1 Designated state(s): DE NL |
|
| REF | Corresponds to: |
Ref document number: 69937284 Country of ref document: DE Date of ref document: 20071122 Kind code of ref document: P |
|
| PGFP | Annual fee paid to national office [announced via postgrant information from national office to epo] |
Ref country code: NL Payment date: 20071223 Year of fee payment: 9 |
|
| PLBE | No opposition filed within time limit |
Free format text: ORIGINAL CODE: 0009261 |
|
| STAA | Information on the status of an ep patent application or granted ep patent |
Free format text: STATUS: NO OPPOSITION FILED WITHIN TIME LIMIT |
|
| 26N | No opposition filed |
Effective date: 20080711 |
|
| NLV4 | Nl: lapsed or anulled due to non-payment of the annual fee |
Effective date: 20090701 |
|
| PG25 | Lapsed in a contracting state [announced via postgrant information from national office to epo] |
Ref country code: NL Free format text: LAPSE BECAUSE OF NON-PAYMENT OF DUE FEES Effective date: 20090701 |
|
| PGFP | Annual fee paid to national office [announced via postgrant information from national office to epo] |
Ref country code: DE Payment date: 20111229 Year of fee payment: 13 |
|
| REG | Reference to a national code |
Ref country code: DE Ref legal event code: R119 Ref document number: 69937284 Country of ref document: DE Effective date: 20130702 |
|
| PG25 | Lapsed in a contracting state [announced via postgrant information from national office to epo] |
Ref country code: DE Free format text: LAPSE BECAUSE OF NON-PAYMENT OF DUE FEES Effective date: 20130702 |