EP1087326A1 - Méthode de création des grappes - Google Patents
Méthode de création des grappes Download PDFInfo
- Publication number
- EP1087326A1 EP1087326A1 EP99810864A EP99810864A EP1087326A1 EP 1087326 A1 EP1087326 A1 EP 1087326A1 EP 99810864 A EP99810864 A EP 99810864A EP 99810864 A EP99810864 A EP 99810864A EP 1087326 A1 EP1087326 A1 EP 1087326A1
- Authority
- EP
- European Patent Office
- Prior art keywords
- cluster
- node
- data point
- nodes
- standard deviation
- Prior art date
- Legal status (The legal status is an assumption and is not a legal conclusion. Google has not performed a legal analysis and makes no representation as to the accuracy of the status listed.)
- Withdrawn
Links
Images
Classifications
-
- G—PHYSICS
- G06—COMPUTING OR CALCULATING; COUNTING
- G06F—ELECTRIC DIGITAL DATA PROCESSING
- G06F18/00—Pattern recognition
- G06F18/20—Analysing
- G06F18/23—Clustering techniques
Definitions
- the invention relates to a method for forming at least one cluster from one Plenty of data points in a given area, as well as a circuit arrangement to carry out this procedure and an application of the procedure.
- the resulting number and distribution of clusters in this area depends on the distribution of the data points.
- the object of the invention is to provide a method of the type mentioned at the beginning with which is particularly a simple modeling of an area with a large number of data points.
- the solution to the problem is defined by the features of claim 1.
- According to the Invention becomes at least from a multitude of data points in a given area one, but typically a plurality of clusters are formed, with each cluster a node is determined. After that, each data point is individually one Assigned to clusters. After assigning a data point to a cluster, the Knots of this cluster newly determined. This redefinition of the node is dependent the data point, the previous node and the nodes of other clusters.
- This method has the advantage that the number of clusters does not depend on the density of the Data points in the different areas of the data room depends. That leaves the Complexity of the model manageable for the entire area.
- a standard deviation is preferably also determined for each cluster, whereby after the assignment of a data point to a cluster the standard deviation of this Clusters depending on the data point, the previous node, the previous standard deviation and the node of other clusters is also redetermined.
- a data point is assigned to a cluster on the basis of a specific one Distance criterion. This is advantageously done between a data point and each Nodes each calculated a pseudo distance and the data point exactly that cluster assigned to whose node it has the smallest pseudo-distance. Because the data points individually and one after the other assigned to a cluster, include individual clusters with time more and more data points, with which the nodes and standard deviations of the individual clusters change less and less.
- the data points are two-dimensional, they are advantageously viewed as elements of a two-dimensional vector space.
- a data point or a node can be described in such a vector space by its coordinates.
- v x and v y can also be interpreted as standard deviations in the x and y directions of the corresponding two-dimensional Gaussian distribution with an expected value of zero.
- the data points are often weighted differently.
- data points with different weightings b g are therefore preferably used.
- the knot with the smallest Pseudo-distance is the first winner node and the node with the second smallest Pseudo-distance called the second winning node.
- assigning the data point to the winning cluster i.e. to the cluster with the first winner node, is between the introduced a topological connection between the first and the second winner node. This is how it is created over time a network of partially interconnected clusters. From the A particular node sees all those nodes to which such a connection is made exists, referred to as neighbors.
- a topological connection is preferably deleted if it becomes too old, i.e. if the Time has exceeded a given time limit since its introduction, whereby the time limit can be chosen arbitrarily. So every connection would eventually be deleted once.
- a data point has a topological connection between result in two nodes between which there is already such a connection this renewed, i.e. the old connection is to a certain extent deleted and at the same time introduced a new one.
- the time of introduction of the topological connection between These two nodes look at the time of the renewal and the connection only deleted if the time since the renewal exceeds the specified time limit (provided the connection is not renewed in the meantime).
- nodes can also be deleted.
- a node is advantageously deleted when it no longer has any neighbors, i.e. when there is no longer a topological connection to another node.
- ⁇ a is a predetermined attraction coefficient and ⁇ r is a repulsion coefficient that is calculated according to the formula where (n x , n y ) are the coordinates of a neighbor N of the node S and the "*" denotes the dot product of two vectors.
- P S is calculated using the formula
- further clusters are formed in the course of the process.
- Two error values are determined for this.
- a local error LF per cluster and on the other hand a common global error GF.
- the global error has only one value GF W , whereas each local error has a specific position LF P and a specific value LF W.
- a data point is assigned to that cluster to the node of which it has the smallest pseudo distance. If this is a so-called error point, i.e. if the pseudo distance between this data point and the node exceeds a predetermined maximum pseudo distance, the data point is assigned to this cluster, but at the same time the values LF W and GF W are determined by a certain one Amount D that is calculated according to elevated.
- the new position LF Pneu of the local error is calculated (IX)
- LF Pneu LF P ⁇ LF W + B ⁇ D LF W + D ,
- the value GF W of the global error is checked regularly, for example after a certain number of processed data points. If GF W is greater than a threshold value, a new node is introduced at the current position LF P of the local error LF whose value LF W is greatest.
- the standard deviation results from the pseudo-distances of all error points of this local error to the new node and the threshold value is calculated, for example, based on the assumption that the pseudo-distances of a cluster are Gaussian.
- the method according to the invention is carried out with an appropriately trained method Circuit arrangement.
- This includes at least means for entering the data points, i.e. Interfaces to other devices or devices through which the Data points can be read, as well as means of education, i.e. Calculation of Cluster.
- a specific area of application for this method is video surveillance of a given range.
- the circuit arrangement could, for example, in one Computer integrated, which is connected to a video camera. With the video camera several images of the surveillance area are taken at a certain time interval added. Then the pictures become information about the movement in the Monitoring area extracted and combined into so-called blobs by means of data reduction. These are weighted centers of motion, the weight of which is detected Movement amount corresponds.
- the blobs become with the circuit arrangement according to the method according to the invention, a plurality of clusters, i.e. Regions of the surveillance area, each with a different movement density. These clusters correspond to simple mathematical models of parts of the general complex surveillance area. They enable easier detection alarm situations, since not the overall situation, but only one cluster at a time or a few clusters can be examined simultaneously.
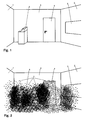
- FIG. 1 schematically shows a single image of the area to be monitored. It shows a publicly accessible foyer Bench that is delimited by a left side wall 1, a right side wall 2 and one Rear wall 3. There is a door 4 in the rear wall 3 and in the right side wall a window 5. In the direction of view to the left of the door 4, is directly on the rear wall 3 Bancomat 6 (a cash withdrawal machine).
- Bancomat 6 a cash withdrawal machine
- the video camera picks up at regular intervals, both during counter opening hours, if the surveillance area is open to the public, as well as during At night, when the bank is closed, further pictures of the surveillance area are opened.
- This information consists of a large number of individual movement points, which are first subjected to a data reduction by in each case a plurality of Movement points weighted according to given criteria for so-called blobs Centers of sub-areas with movement can be summarized. This process will hence called blobbing.
- the center of a blob corresponds to the focus of the Movement points of a partial area in which a coherent movement is detected has been.
- the weight corresponds to the geometric size of this section.
- a "map" of the surveillance area is obtained with a variety of weighted blobs, which are detected according to the Movements are distributed within the monitoring area. This will make the surveillance area divided into areas with different movement densities.
- FIG. 2 shows a map of the monitoring area from FIG. 1 with a large number of such Blobs 7, with only a few blobs 7 labeled for the sake of clarity. Out for the same reason, only the position of the blobs 7 was shown, but not their weighting is taken into account.
- a higher blob density can be clearly seen in front of ATM 6 and to the left of Door 4 and on the way from door 4 to ATM 6.
- Also in front of window 5 is a higher blob density compared to the environment. Be evoked the corresponding blobs, for example, by bank customers who come in to door 4 and typically go straight to ATM 6, sometimes some Waiting time between the door 4 and the ATM 6 must be accepted. The customers then spend a certain amount of time in front of the ATM 6 while who e.g. Withdraw money.
- the blob density in front of window 5 can be explained e.g. as a result of that some of the customers are still at the window while waiting or after withdrawing money 5 step and look out.
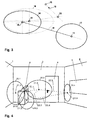
- FIG. 3 shows two already identified clusters 16 and 17, each represented by an ellipse, the semiaxes of which correspond to the variances of the cluster in the x and y directions, each with a node 10 or 11 and the local error 12 of region 16.
- (v x , v y ) are the coordinates of the standard deviation of the cluster 16, formed from the standard deviations v x in the x and v y in the y direction.
- the blob X 13 is allocated to the cluster 16, 17 to the node 10, 11 of which it has the smallest pseudo-distance d 10 or d 11 . In this case d 10 is smaller than d 11 , consequently the new blob X 13 is allocated to cluster 16 with node 10 as the first winning node.
- the blob has the second smallest pseudo distance d 11 from node 11, the second winning node, which is why a topological connection 19 is introduced between the two nodes 10 and 11.
- the node 10 and the variance v 2 of the cluster 16, the winning cluster are redetermined.
- ⁇ r calculated according to the formula where the "*" denotes the dot product of two vectors, P S10 is calculated according to and (n ix , n iy ) are the coordinates of the i-th neighbor of the node 10.
- this error blob is the first of this cluster, i.e. if there is no local error yet, a new local error is created at the location of the error blob, the value of the new one Local error corresponds to the value D.
- the value G W of the global error is checked. If it is larger than a given limit, a new node is introduced at the position of the local error with the greatest value.
- P denotes the probability that a pseudo distance is greater than that Maximum pseudo distance is and below E is the expected value of those pseudo distances understand which are larger than the maximum pseudo distance.
- a blob becomes one of two nodes, between which there is already a topological Connection exists, assigned, the existing topological connection is renewed, i.e. their "age", the time since their introduction, is reset to zero.
- FIG Clusters The arrangement corresponding to the detected blobs from FIG. 2 is shown in FIG Clusters and topological connections are shown.
- clusters are used to detect alarm situations by for each cluster a movement sum, i.e. the sum of the weightings of all blobs resulting from the one to be assessed Situation arose, is calculated.
- a movement sum i.e. the sum of the weightings of all blobs resulting from the one to be assessed Situation arose.
- Such a situation is exactly then recognized as an alarm situation when the movement sum of a single cluster, or that Product of the movement sums of two clusters larger than a corresponding barrier is.
- the individual barriers are calculated based on the situations that have already been assessed and adapted after each new image so that a predefined percentage of the corresponding Values below the barrier.
- the method according to the invention allows from a plurality of data points in a predetermined range Form clusters, their number regardless of the number and distribution of data points is and thus offers a possibility, the given, mostly complex area to describe using a few simple models.
Landscapes
- Engineering & Computer Science (AREA)
- Data Mining & Analysis (AREA)
- Theoretical Computer Science (AREA)
- Computer Vision & Pattern Recognition (AREA)
- Bioinformatics & Cheminformatics (AREA)
- Bioinformatics & Computational Biology (AREA)
- Artificial Intelligence (AREA)
- Evolutionary Biology (AREA)
- Evolutionary Computation (AREA)
- Physics & Mathematics (AREA)
- General Engineering & Computer Science (AREA)
- General Physics & Mathematics (AREA)
- Life Sciences & Earth Sciences (AREA)
- Image Analysis (AREA)
Priority Applications (1)
| Application Number | Priority Date | Filing Date | Title |
|---|---|---|---|
| EP99810864A EP1087326A1 (fr) | 1999-09-24 | 1999-09-24 | Méthode de création des grappes |
Applications Claiming Priority (1)
| Application Number | Priority Date | Filing Date | Title |
|---|---|---|---|
| EP99810864A EP1087326A1 (fr) | 1999-09-24 | 1999-09-24 | Méthode de création des grappes |
Publications (1)
| Publication Number | Publication Date |
|---|---|
| EP1087326A1 true EP1087326A1 (fr) | 2001-03-28 |
Family
ID=8243045
Family Applications (1)
| Application Number | Title | Priority Date | Filing Date |
|---|---|---|---|
| EP99810864A Withdrawn EP1087326A1 (fr) | 1999-09-24 | 1999-09-24 | Méthode de création des grappes |
Country Status (1)
| Country | Link |
|---|---|
| EP (1) | EP1087326A1 (fr) |
Cited By (2)
| Publication number | Priority date | Publication date | Assignee | Title |
|---|---|---|---|---|
| CN110070109A (zh) * | 2019-03-28 | 2019-07-30 | 东南大学 | 一种适用于建筑排列密集区的地物散乱点自动聚类的方法 |
| CN116719230A (zh) * | 2023-03-29 | 2023-09-08 | 河海大学 | 一种基于节点的群集一致性自适应牵制控制方法 |
-
1999
- 1999-09-24 EP EP99810864A patent/EP1087326A1/fr not_active Withdrawn
Non-Patent Citations (1)
| Title |
|---|
| KEINOSUKE FUKUNAGA: "Introduction to Statistical Pattern Recognition", 1990, ACADEMIC PRESS, INC, LONDON, XP002140074 * |
Cited By (3)
| Publication number | Priority date | Publication date | Assignee | Title |
|---|---|---|---|---|
| CN110070109A (zh) * | 2019-03-28 | 2019-07-30 | 东南大学 | 一种适用于建筑排列密集区的地物散乱点自动聚类的方法 |
| CN110070109B (zh) * | 2019-03-28 | 2021-02-26 | 东南大学 | 一种适用于建筑排列密集区的地物散乱点自动聚类的方法 |
| CN116719230A (zh) * | 2023-03-29 | 2023-09-08 | 河海大学 | 一种基于节点的群集一致性自适应牵制控制方法 |
Similar Documents
| Publication | Publication Date | Title |
|---|---|---|
| DE60224324T2 (de) | Verfahren und Vorrichtung zur Verarbeitung von Fahrzeugbildern | |
| DE3689049T2 (de) | Selbstanpassender Prozessor. | |
| DE69734801T2 (de) | Verfahren zur automatischen Segmentierung von numerischen Bildern und Vorrichtung zur Ausführung dieses Verfahrens | |
| DE69329380T2 (de) | Verfahren zum Segmentieren von Bildern und Klassifizieren von Bildelementen zur Dokumentverarbeitung | |
| EP3044760B1 (fr) | Procédé d'analyse de la distribution d'objets dans des files d'attente libres | |
| DE69008477T2 (de) | Verfahren und Vorrichtung zur Zielerkennung. | |
| DE69818438T2 (de) | Verfahren zur kontrolle der oberfläche einer laufenden materialbahn mit bildsegmentierung zur umgrenzung von defektbereichen | |
| DE112017005640B4 (de) | Informationsverarbeitungsvorrichtung und Informationsverarbeitungsverfahren | |
| EP2676241A1 (fr) | Procédé et système de détermination d'un certain nombre d'objets intermédiaires | |
| DE69310946T2 (de) | Verfahren und Mittel zum Detektieren einer Leitweglenkungsschleife in einem Fernmeldenetz | |
| DE69821225T2 (de) | Verfahren zur kontrolle der oberfläche einer laufenden materialbahn mit vorklassifikation von ermittelten unregelmässigkeiten | |
| DE102005046747B3 (de) | Verfahren zum rechnergestützten Lernen eines neuronalen Netzes und neuronales Netz | |
| DE2813157C2 (de) | Gerät zur selbsttätigen, lageunabhängigen Mustererkennung | |
| EP1087326A1 (fr) | Méthode de création des grappes | |
| DE10049366A1 (de) | Verfahren zum Überwachen eines Sicherheitsbereichs und entsprechendes System | |
| DE2838185C2 (de) | Korrelationseinrichtung in einem Radargerät zum Erfassen eines Radarsignals aus dem Rauschen | |
| DE69504140T2 (de) | Verfahren zum Detektieren der Flankenrichtung in einem Fernsehbild mit Zeilensprungverfahren | |
| EP0443120A1 (fr) | Méthode de détermination des valeurs de mesure d'un corps humain ou animal | |
| DE60109442T2 (de) | System zum zählen von lebewesen | |
| EP1359539A2 (fr) | Modèle neurodynamique de traitement d'informations visuelles | |
| DE69410733T2 (de) | Neuronaler Zellularautomat und darauf basierter Optimierer | |
| WO2022122307A1 (fr) | Comparaison d'un premier réseau neuronal artificiel avec un second réseau neuronal artificiel | |
| DE102021100512A1 (de) | Verfahren und system zum erkennen von in einem bild anhand einer punktwolke repräsentierten objekten | |
| DE102023117654B4 (de) | Verfahren zur Überwachung eines Schutzbereichs basierend auf einem Modellobjektdatensatz mit mindestens einem 3D-Modellobjekt | |
| EP3142068A1 (fr) | Procede de detection tridimensionnelle d'objets |
Legal Events
| Date | Code | Title | Description |
|---|---|---|---|
| PUAI | Public reference made under article 153(3) epc to a published international application that has entered the european phase |
Free format text: ORIGINAL CODE: 0009012 |
|
| AK | Designated contracting states |
Kind code of ref document: A1 Designated state(s): AT BE CH CY DE DK ES FI FR GB GR IE IT LI LU MC NL PT SE |
|
| AX | Request for extension of the european patent |
Free format text: AL;LT;LV;MK;RO;SI |
|
| 17P | Request for examination filed |
Effective date: 20010906 |
|
| AKX | Designation fees paid |
Free format text: AT BE CH CY DE DK ES FI FR GB GR IE IT LI LU MC NL PT SE |
|
| STAA | Information on the status of an ep patent application or granted ep patent |
Free format text: STATUS: THE APPLICATION IS DEEMED TO BE WITHDRAWN |
|
| 18D | Application deemed to be withdrawn |
Effective date: 20050401 |