EP1092782A2 - Méthode et appareil de screening génétique - Google Patents
Méthode et appareil de screening génétique Download PDFInfo
- Publication number
- EP1092782A2 EP1092782A2 EP00122440A EP00122440A EP1092782A2 EP 1092782 A2 EP1092782 A2 EP 1092782A2 EP 00122440 A EP00122440 A EP 00122440A EP 00122440 A EP00122440 A EP 00122440A EP 1092782 A2 EP1092782 A2 EP 1092782A2
- Authority
- EP
- European Patent Office
- Prior art keywords
- dna
- cdna
- alleles
- fragments
- pcr amplification
- Prior art date
- Legal status (The legal status is an assumption and is not a legal conclusion. Google has not performed a legal analysis and makes no representation as to the accuracy of the status listed.)
- Granted
Links
Images



Classifications
-
- G—PHYSICS
- G01—MEASURING; TESTING
- G01N—INVESTIGATING OR ANALYSING MATERIALS BY DETERMINING THEIR CHEMICAL OR PHYSICAL PROPERTIES
- G01N27/00—Investigating or analysing materials by the use of electric, electrochemical, or magnetic means
- G01N27/26—Investigating or analysing materials by the use of electric, electrochemical, or magnetic means by investigating electrochemical variables; by using electrolysis or electrophoresis
- G01N27/416—Systems
- G01N27/447—Systems using electrophoresis
- G01N27/44704—Details; Accessories
- G01N27/44717—Arrangements for investigating the separated zones, e.g. localising zones
- G01N27/44721—Arrangements for investigating the separated zones, e.g. localising zones by optical means
-
- C—CHEMISTRY; METALLURGY
- C12—BIOCHEMISTRY; BEER; SPIRITS; WINE; VINEGAR; MICROBIOLOGY; ENZYMOLOGY; MUTATION OR GENETIC ENGINEERING
- C12Q—MEASURING OR TESTING PROCESSES INVOLVING ENZYMES, NUCLEIC ACIDS OR MICROORGANISMS; COMPOSITIONS OR TEST PAPERS THEREFOR; PROCESSES OF PREPARING SUCH COMPOSITIONS; CONDITION-RESPONSIVE CONTROL IN MICROBIOLOGICAL OR ENZYMOLOGICAL PROCESSES
- C12Q1/00—Measuring or testing processes involving enzymes, nucleic acids or microorganisms; Compositions therefor; Processes of preparing such compositions
- C12Q1/68—Measuring or testing processes involving enzymes, nucleic acids or microorganisms; Compositions therefor; Processes of preparing such compositions involving nucleic acids
- C12Q1/6809—Methods for determination or identification of nucleic acids involving differential detection
-
- C—CHEMISTRY; METALLURGY
- C12—BIOCHEMISTRY; BEER; SPIRITS; WINE; VINEGAR; MICROBIOLOGY; ENZYMOLOGY; MUTATION OR GENETIC ENGINEERING
- C12Q—MEASURING OR TESTING PROCESSES INVOLVING ENZYMES, NUCLEIC ACIDS OR MICROORGANISMS; COMPOSITIONS OR TEST PAPERS THEREFOR; PROCESSES OF PREPARING SUCH COMPOSITIONS; CONDITION-RESPONSIVE CONTROL IN MICROBIOLOGICAL OR ENZYMOLOGICAL PROCESSES
- C12Q1/00—Measuring or testing processes involving enzymes, nucleic acids or microorganisms; Compositions therefor; Processes of preparing such compositions
- C12Q1/68—Measuring or testing processes involving enzymes, nucleic acids or microorganisms; Compositions therefor; Processes of preparing such compositions involving nucleic acids
- C12Q1/6844—Nucleic acid amplification reactions
- C12Q1/6851—Quantitative amplification
Definitions
- the present invention relates to a genetic screening method for the simple and inexpensive detection, as a discrepancy (or imbalance) in the amount of gene expression, of a gene mutation related to cancer and other disorders using nucleic acid (DNA, RNA) extracted from cells from a patient's urine, sputum, feces, swabs, whole blood, plasma, biopsy tissue, bone marrow, pus, wash fluid from the affected area or the like.
- DNA nucleic acid
- Conventional methods for detecting gene mutation, especially, gene insertion, deletion and the like include amplifying a gene by polymerase chain reaction, and then detecting the presence or absence of the gene fragments by hybridization (e.g., Southern, Northern hybridization )and comparing the size of the fragments.
- hybridization e.g., Southern, Northern hybridization
- methods such as the SSCP (Single Strand Conformation Polymorphism) method, the APO (Allele Specific Oligonucleotide) method, the RNase A mismatch cleavage method, the DGGE (Denaturant Gradient Gel Electrophoresis) method, and the nucleotide sequencing method are widely used.
- SSCP single strand conformation polymorphism
- mutation is detected by exploiting the inability to form hybrids due to mismatch of a single nucleotide pair (Wallace et al., Nucleic Acid Res., vol. 9, 879- 895 (1981)).
- RNase A mismatch cleavage method mutation is detected by cleaving an RNA probe with enzyme RNase A at the position at which there occurs an RNA-DNA or RNA-RNA hybrid mismatch (Myers, Nature, vol.313, 495- 498 (1985)).
- the DGGE method allows for detection of a mutation by exploiting the fact that DNA fragments having a mismatch and DNA fragments not having a mismatch exhibit different degrees of mobility on a denaturant gradient gel (Fischer & Lerman, Cell, vol.16, 191- 200 (1979)).
- the nucleotide sequence of the isolated DNA fragment is directly determined by the deoxy-termination method (Sanger et al, Proc. Natl. Acad. Sci., vol. 7, 5463-5467 (1977)).
- the amount of obtained information is greatest with the nucleotide sequencing method, but there are problems in that the procedure is complex and time-consuming.
- the PCR-SSCP method With the SSCP method, the repeatability of results is good, and the presence or absence of a mutation can be rapidly determined. Consequently, this method has become widely employed during recent years. Normally, since the amount of DNA obtainable from a sample is small, the PCR-SSCP method is used, wherein the region to be analyzed is first amplified using PCR and the thus obtained DNA fragments subjected to SSCP analysis (Orita et al, Genomics, vol. 5, 874- 879 (1989)). The PCR-SSCP method has been applied to the genetic diagnosis of digestive organ cancer and bladder cancer (Sugano et al, Int. J. Cancer, vol. 74, 403- 406 (1997)).
- RT-PCR-SSCP which involves extracting mRNA from a sample, obtaining complementary DNA (cDNA) from the mRNA by reverse transcriptase reaction and thereafter conducting PCR-SSCP, has been used as a means for determining the presence or absence of gene expression and quantifying the amount of expression (Murakami et al, Oncogene, vol. 6, 37-42 (1991)).
- amount of gene expression is defined as the number of a mRNA involved in total RNA or poly(A) RNA, per unit mass, for example, per 1 ⁇ g of total RNA or poly(A) RNA. If is possible to isolate DNA having a mutation in the nucleotide sequence of a genomic DNA gene by PCR-SSCP. On the other hand, it is possible to detect a mutation in a gene's nucleotide sequence and gene expression disorder by the RT-PCR-SSCP method using cDNA obtained from mRNA. A gene expression disorder may be caused by, for example, a mutation in the nucleotide sequence of the expression control region upstream of the gene, or a methylation abnormality, or the like. It is possible to gain information using the RT-PCR-SSCP method that cannot be obtained by the PCR-SSCP method.
- a sufficient amount of DNA can be amplified by PCR, RT-PCR-SSCP from a small sample amount.
- the amplification efficiency of PCR varies frequently according to differences in the reaction instrument-types and heat-resistant DNA polymerase.
- Theoretically r 1, however the value of r varies frequently according to various factors such as the thermal profile of the PCR reaction, properties of the DNA polymerase (e.g., reproducibility of the enzyme), DNA sequence length, primer sequence, ratio of primer concentration and DNA concentration, and the like.
- r may take a value of between 0.6 and 0.8, and since n is generally a value of around 30, the slightest difference in the value of r may result in the value C of PCR being several to tens of times different.
- competitive PCR As methods of quantitative analysis using PCR, competitive PCR (Gilliard et al, Proc. Natl. Acad. Sci., Vol. 87, 2725- 2729, 1990), kinetic PCR (Wang et al, Proc. Natl. Acad. Sci., Vol. 86, 9717-9721, 1989), TaqMan PCR (Gelfand et al, USP5210015 (1993)) have been developed.
- competitive PCR to measure the amount of DNA, DNA of a known concentration is used as an internal standard, and the internal standard DNA is systematically diluted, and then added, and amplified at the same time as the sample DNA.
- PCR products are separated by gel electrophoresis, and the number of copies of sample DNA and internal standard DNA are compared using ethidium bromide staining technique.
- the precision in quantifying the amount of DNA increases with the number of dilutions.
- the amount of sample required and the amount of work increases in proportion to the number of dilutions.
- kinetic PCR PCR is stopped at the logarithmic amplification phase.
- the number of PCR amplification products is thought to correlate to the number of sample DNA. Firstly, a plurality of DNA of known concentration are amplified using PCR, and the amounts of obtained PCR amplification product are plotted and a calibration curve (a straight line) is created.
- DNA of unknown concentration is amplified using PCR and the amount of sample DNA is quantified using the calibration curve. Since in kinetic PCRS the number of PCR cycles is reduced so that the PCR does not saturate, there is the problem that the final concentration of PCR amplification product is low. However, through the use of a fluorescence-labeled primer and laser fluorescence DNA sequencer, slight amounts of PCR amplification products can be detected.
- TaqMan PCR is a method combining kinetic PCR and a fluorescence-labeled primer by which the amount of amplification product for each cycle can be monitored during the PCR amplification.
- an individual (carrier) having reproductive cellular mutation in one of the two alleles of a cancer suppressive gene or DNA repairing enzyme gene the frequency of tumor occurrence increases and onset of disease increases somewhat, and an increase in multiple primary cancer and multiple cancer is known, so there is a need for increased efficiency in detection.
- mRNAs originating from the two alleles can be distinguished.
- Messenger RNAs, where genomic imprinting etc. does not arise, are thought to be transcribed from the two alleles in equal amounts.
- nucleotide sequence polymorphisms it is known that where a termination codon occurs in the middle of coding region of a gene as a result of point mutation or frameshift mutation, there is a decrease in mRNA expression. Therefore, when a striking difference in gene expression of mRNA between alleles is found, it is thought that this result reflects sharply etiological conditions including inactivation of the gene, and this phenomenon may be used for a simple method to detect the presence or absence of gene mutations. It is known that there exist various differences in nucleotide sequence between alleles, between individuals, and between populations in human genomic DNA. Since the greater proportion of these sequence differences are not pathological, they are called nucleotide sequence polymorphisms, not mutations.
- nucleotide sequence polymorphisms Single nucleotide polymorphisms (SNP) arising from the substitution of a single nucleotide pair, microsatellite polymorphisms due to differences in the number of repetitions of short repeat sequences of about 2-4 base pairs, and VNTR (Variable Number of Tandem Repeat) polymorphisms that differ in terms of number of repeats and nucleotide sequence in units of several tens of base pairs, are known.
- Single nucleotide polymorphisms are predicted to exist on average in more than one in every thousand base pairs in human DNA, and have significant value as markers covering the entire human genome.
- SNP in CDNA: cSNP single nucleotide polymorphisms existing in the exon regions of genes
- SSCP single strand conformation polymorphism
- nucleotide deletion or insertion alters the conformation and mobility of the single-stranded DNA fragment, allowing the detection of substitution, deletion and insertion with gel electrophoresis and the separation of abnormal DNA fragments.
- genomic DNA fragments and RNA fragments are obtained from a sample taken from a subject; (2) cDNA fragments are obtained from the said RNA fragments by reverse transcriptase reaction; (3) PCR amplification reaction is conducted using said genomic DNA fragments and said complementary DNA fragments as templates, and a first PCR amplification product derived from the target region of said genomic DNA fragments, and a second PCR amplification product derived from the target region of said complementary DNA fragments, are obtained; (4) the amounts of said first PCR amplification product and of said second PCR amplification product are measured in respect of each allele from which said genomic DNA fragments and said complementary DNA fragments are derived; (5) differences in gene expression between the alleles are detected based on the results of said measurements; and, (6) the presence or absence of genetic abnormality is determined based on the results of said detection.
- the method of the present invention is characterized in that it comprises a first step of obtaining a genomic DNA fragments and RNA fragments from a sample taken from a subject; a second step of obtaining complementary DNA fragments to said RNA fragments by reverse transcriptase reaction; a third step of performing PCR amplification using said genomic DNA fragments and said complementary DNA fragments as templates to obtain a first PCR amplification product derived from the target region of said genomic DNA fragment and a second PCR amplification product derived from the target region of said complementary DNA fragment; a fourth step of measuring the amount of said first PCR amplification product and said second PCR amplification product for each allele from which said genomic DNA fragments and said complementary DNA fragments are derived; a fifth step of detecting the difference in gene expression between the alleles based on the results of said measurements; and, a sixth step of determining the existence or otherwise of genetic abnormality based on said measurement results.
- a preferred embodiment of the method of the present invention further comprises a step of blunting the 3' termini of the said first PCR amplification product and the said second PCR amplification product.
- Another preferred embodiment of the method of the present invention requires the conditions of the said PCR amplification reaction to be identical in respect of both the said genomic DNA fragment and complementary DNA fragment templates.
- said fourth step is conducted by the single strand conformation polymorphism method.
- the PCR amplification reaction in said third step uses a fluorescently labeled primer, and the said first PCR amplification product and the said second PCR amplification product obtained in said third step are subjected to electrophoresis, and measurement in said fourth step is conducted by detecting the fluorescence of said fluorescent labels.
- each signal intensity of the electrophoretic band of said first PCR amplification product (peak height or peak area) for each of the alleles from which the genomic DNA fragments used as templates are derived is expressed as "A1(DNA)” and “A2(DNA)” respectively
- each signal intensity of the electrophoretic band of said second PCR amplification product (peak height or peak area) for each of the alleles from which the complementary DNA fragments used as template are derived is expressed as "B1(cDNA)” and "B2(cDNA)” respectively.
- or, the following formula: ⁇ '
- a further preferred embodiment of the method of the present invention includes a step wherein said first indicator and said second indicator are displayed numerically or graphically.
- the apparatus for screening genes comprises a plurality of electrophoresis lanes for electrophoresis of nucleic acid fragments labeled with a fluorescent label; a means for irradiating a laser onto the plurality of electrophoresis lanes; a means for detecting the fluorescence emitted from the fluorescent label by irradiation with a laser; a means for analyzing the electrophoresis pattern of nucleic acid fragments separated by electrophoresis; and a display apparatus for displaying the analysis results.
- said display apparatus displays, as either letter(s), numerical value(s), or graph(s), any 1 or more selected from the group consisting of a name of a target gene site, nucleotide sequences of primers, nucleotide sequences of alleles, difference in nucleotide sequence between said alleles, signal intensities of electrophoretic bands of genomic DNA fragments derived from each of said alleles, signal intensities of electrophoretic bands of cDNA fragments derived from each of said alleles, a ratio of signal intensities of electrophoretic bands of genomic DNA fragments derived from each of said alleles, a ratio of signal intensities of electrophoretic bands of cDNA fragments derived from each of the alleles, difference in gene expression between said alleles, a ratio of gene expression between said alleles, and statistically significant difference of said differences and/or ratios of the gene expression between said alleles.
- the method of the present invention can be employed as a new screening method for screening a carrier with familial tumor, when peripheral blood lymphocyte is used as a test sample, and as a target, an tumor- suppressor (e.g., p53, BRCA1 or BRCA2) or a DNA fragment which has a polymorphism in an exon of a DNA mismatch repairing enzyme gene (e.g., hMSH2 or hMLH1), are used.
- This method can therefore contribute greatly to precise examinations.
- whether there exists abnormality in a specific gene can be rapidly screened with good reproducibility. A subject judged as that there is an abnormality will be subjected to a more precise examination such as determination of gene sequence and identification of mutation.
- the screening method according to the present invention is not known until now. This method can be utilized for screening mutations of genes associated with onset of cancer and various life-habitual diseases, and for studies on differences between individuals based on extensive nucleotide sequence polymorphisms.
- DNA fragments amplified using genomic DNA as a template may be referred to as a "genomic DNA fragments”
- DNA fragments amplified using complementary DNA as a template may be referred to as “complementary DNA fragments” or “cDNA fragments” in-the specification.
- DNA fragments and RNA fragments are obtained from a sample taken from a subject.
- the samples taken from a subject include, but are not limited to, urine, sputum, feces, swabs, whole blood, serum, biopsy tissue, bone marrow, pus, and wash fluid from the affected area.
- the genomic DNA fragments and the RNA fragments are taken from the same sample.
- the method for collecting the genomic DNA fragments and the RNA fragments from the sample is not particularly limited and conventional methods are acceptable. Methods for collecting DNA include DNA extraction methods such as the proteinase K-phenol-chloroform method. Further, methods for obtaining amplified DNA by conducting PCR directly using blood or biopsy samples, (Mercier et al, Nucleic Acid Res., vol.
- RNA collection methods include, for example, RNA extraction methods such as the guanidine-thiocyanate method.
- the collected RNA may be either total cellular RNA or poly(A) RNA.
- RNA is obtained through a reverse transcriptase reaction.
- the reverse transcriptase reaction can be conducted according to conventional techniques.
- enzymes to be used in the reverse transcriptase reaction enzymes with high optimal reaction temperature such as Superscript II reverse transcriptase or Tth DNA polymerase are preferable, but AMV reverse transcriptase or MoMuLV reverse transcriptase can also be used.
- a primer to be used in the reverse transcriptase reaction any of Oligo dT primer, a random primer of about 6 nucleotides, or a specific primer of about 20-30 nucleotides, or any two or more of these in combination, can be used.
- PCR is conducted using said genomic DNA fragments and said complementary DNA fragments as templates.
- a first PCR amplification product derived from the target region of said genomic DNA fragments, and a second PCR amplification product derived from the target region of said complementary DNA fragments, are obtained.
- target region means the region to be amplified by PCR, and the target region of the genomic DNA fragment and the target region of the complementary DNA fragment are substantially the same region.
- any region within the exons of the genomic DNA fragment may be selected, but it is preferable to select a region exhibiting polymorphism.
- a region exhibiting polymorphism for example, a region exhibiting single nucleotide polymorphism (SNP) may be used.
- SNP single nucleotide polymorphism
- the first PCR amplification product derived from the target region of the genomic DNA fragment can be obtained by conducting PCR with the genomic DNA fragment as the template and using a primer able to hybridize with each terminus of the target region.
- the second PCR amplification product derived from the target region of the complementary DNA fragment can be obtained by conducted PCR with the complementary DNA fragment as a template, and a primer able to hybridize with each terminus of the target region.
- the primer to be used in PCR is labeled (e.g. with a fluorescent label) in order to conduct detection of the electrophoresis pattern in the fourth step easily and accurately. It is preferably that PCR conditions (e.g.
- temperatures and durations for denaturation, annealing and extension reaction, PCR cycle number, etc. are identical when obtaining the "genomic DNA fragment" and the "complementary DNA fragment", and normally PCR is conducted on the same amplification reaction apparatus. It is preferable that the number PCR cycles is as near to identical as possible, but where the template concentrations prior to amplification as between the genomic DNA and complementary DNA clearly differ (e.g. less than one tenth, or greater than ten times), then the number of PCR cycles used when obtaining the "genomic DNA fragment” may differ from the number of PCR used when obtaining the "complementary DNA fragment” by a few cycles. It should be noted that in the third step, amplification methods other than PCR, for example, LCR, NASBA and other such known methods of amplification can be used.
- Blunting maybe performed, for example, by processing with an enzyme having 3' ⁇ 5' exonuclease activity such as Klenow fragment.
- step 4 the amounts of said first PCR amplification product and said second PCR amplification product are measured in respect of each allele from which said genomic DNA fragment and said complementary DNA fragment are derived.
- methods for measuring the amount of PCR amplification product for each allele include a method of measuring based on the electrophoresis pattern obtained by electrophoresis separation of the PCR product, and a method of measuring by probe hybridization using oligonucleotide chips etc.
- a preferable method of measurement is SSCP. With the SSCP method, a difference in a single nucleotide within the DNA fragment can be detected.
- a fluorescently labeled primer is used, by subjecting the PCR amplification products to electrophoresis, and detecting fluorescence from the fluorescent label, and by taking electrophoresis time (minutes) as the transverse axis, and fluorescent intensity (relative value) as the vertical axis, an electrophoresis pattern as shown in Figure 5 can be obtained. If the nucleotide sequences of the PCR products differ, their electrophoresis patterns will also differ (Fig. 5). Thus, PCR products derived from the respective alleles of a gene exhibiting heterozygosity, will exhibit differing electrophoresis patterns.
- the electrophoresis patterns of the "genomic DNA fragment" of the paternally derived allele and the maternally derived allele correspond to the electrophoresis patterns of the genomic DNA alleles
- the electrophoresis patterns of the "complementary DNA fragment" transcribed from the paternally derived allele and the maternally derived allele correspond to the electrophoresis pattern indicating the expression pattern of RNA.
- the difference in gene expression between alleles is detected based on said measurement results.
- the amount of PCR amplification product of the complementary DNA fragment differs for each allele, it is thought that this difference is caused by a difference in gene expression between the alleles. Since the PCR amplification products of the complementary DNA fragments derived from each allele were subject to PCR amplification reaction under the same conditions, then the difference in the amount of PCR amplification product results from a difference in the amount of complementary DNA fragment of a template, that is, a difference in the amount of expressed mRNA between the alleles.
- the presence or absence of a genetic abnormality is determined based on said detection results. Where a difference in expression between the alleles is detected, a genetic abnormality is determined to exist. Where no difference in expression between the alleles is detected, no genetic abnormality is determined to exist.
- the signal intensity ratio of the electrophoretic band signals for the "genomic DNA fragment” derived from each allele and the signal intensity ratio of the electrophoretic band signals for the "complementary DNA fragment” derived from each allele - where these ratios differ by more than a given value, it can be determined that there exists a disorder in respect of gene expression of two alleles. Where these ratios do not differ by more than a given value, then it can be determined that exists no disorder in respect of gene expression of two alleles.
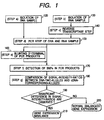
- Figure 1 is flowchart indicating an example of the steps of the method of the present invention.
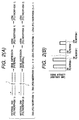
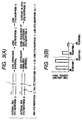
- Figures 2 and 3 are figures which explain a screening example where a genetic abnormality is tested using single nucleotide polymorphism.
- Figure 2 explains a screening example where the gene is normal and
- Figure 3 explains a screening example where a gene abnormality is suggested.
- Figure 2(A) is a figure which explains the relationship between a normal gene and the transcript of the normal gene.
- Figure 2(B) is a figure indicating the signal intensity of the electrophoretic bands of a "genomic DNA fragment” and a "complementary DNA fragment.”
- the DNA fragments of a paternally-derived allele 1 and a maternally-derived allele 1' exhibit single nucleotide polymorphisms, for example as shown in figure 2, where the nucleotide pair of the paternal allele 1 is an AT-pair, and the corresponding nucleotide pair of maternal allele 1' is a GC pair, then since in a normal pair of chromosomes of a normal cell, one chromosome is inherited from each of the father and mother, the ratio between allele 1 and allele 1' is 1:1.
- Figure 3(A) is a figure explaining the relationship between a gene where there is a gene expression imbalance suggesting gene abnormality, and the transcription product of the gene.
- Figure 3(B) is a figure showing the signal intensities of electrophoretic bands of the "genomic DNA fragment" and the "cDNA fragment.” As shown in Fig. 3(A) where there is a mutation 2 in the maternally-derived allele 1' there often occurs a difference in gene expression as between the alleles.
- Mutation 2 indicates a mutation in the nucleotide sequence of the expression control region upstream of the gene, a mutation arising from a termination codon in the coding region of the gene, an abnormality in the nucleotide sequence of the non-translated region of the mRNA 3'-terminus, or the like.
- the ratio of allele 1 to allele 1' equals the ratio of the "cDNA fragment” derived from allele 1 to the "cDNA fragment” derived from allele 1'.
- the ratio of allele 1 to allele 1' will not equal the ratio of the "cDNA fragment” derived from allele 1 to the "cDNA fragment” derived from allele 1', thus allowing the detection of gene abnormality as a gene expression imbalance.
- the signal intensity of the electrophoretic band of the "genomic DNA fragment” derive from allele 1 is denoted as A1; the signal intensity of the electrophoretic band of the "genomic DNA fragment derived from allele 1', as A2; the signal intensity of the electrophoretic band of the "complementary DNA fragment” derived from allele 1, as B1; and, the signal intensity of the electrophoretic band of the "complementary DNA fragment” derived from allele 1', as B2.
- (1+( ⁇ /k)) (B2/B1)/(A2/A1)
- the method of the present invention is unique in that as well as detecting with high precision the "difference in gene expression between alleles" ( ⁇ ), it makes possible also the derivation of the data k which is significant in examination, and the "gene-expression ratio between alleles", 1+( ⁇ /k), and is thus superior to known competitive PCR.
- k', ⁇ ' and (1+( ⁇ '/k')) derived from Formula (V) - Formula (VIII)) by reversing A2 and A1, and, B2 and B1 in Formula (I) to Formula (IV) may be used in place of k, ⁇ , (1+( ⁇ /k)).
- (1+( ⁇ '/k')) (B1/B2)/(A1/A2)
- the signal strength where both of the two alleles are expressed is established as 100, theoretically, the signal strength where only one of the two alleles is expressed is 50, and where both alleles do not express, the signal strength is 0.
- there is a dispersion of around 30% to 50% In the measurement results of gene expression amounts obtained by conventional methods such as competitive PCR, there is a dispersion of around 30% to 50%. However, if there is a dispersion of around 30% to 50%, it is difficult to accurately distinguish between the case where both of the two alleles are expressed and the case where only one of the alleles is expressed, and also between the case where one allele only is expressed and the case where neither of the two alleles is expressed.
- the dispersion in detection in the method of the present invention is below 10%, several % average (Described below.)
- the method of the present invention can be applied not only to single nucleotide polymorphisms but to genes having cancer-specific mutations.
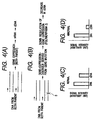
- Figure 4 is a figure explaining a screening example suitable for cancer cells having a mutation of one of the alleles, without having a single nucleotide polymorphism.
- Figure 4(A) is a figure explaining the relationship between a normal gene and the transcript of the normal gene.
- Figure 4(B) is a figure explaining the relationship between abnormal gene of a cancer cell or the like, and the transcript of the abnormal gene.
- Figure 4(C) is a figure indicating the amount of "genomic DNA fragment” and “complementary DNA fragment” present in the case of a normal gene.
- Figure 4(D) is a figure indicating the amount of "genomic DNA fragment” and "complementary DNA fragment” present in the case of an abnormal gene.
- the method of electrophoresis is influenced by gel composition, gel freezing point, time etc, however, where as in the present embodiment, the ratios of peak height and peak area of the two alleles are used as indicators, the variance in the result data is very low.
- An examination using the results of the present embodiment is superior to examination methods using conventional methods in that there are fewer misdiagnoses.
- the "genomic DNA fragment" and the "complementary DNA fragment” are labeled with differing fluorescent labels, and electrophoresed on the same lane, variance between lanes can be reduced allowing more precise measurement.
- the genetic screening method of the present invention is applied, and by means of fluorescence-detection type genetic screening apparatus comprising a plurality of electrophoresis lanes for electrophoresis of nucleic acid fragments labeled with a fluorescent marker; a means for irradiating a laser onto the plurality of electrophoresis paths; a means for detecting the fluorescence emitted from the fluorescent labels due to irradiation with a laser; a means for analyzing the electrophoresis pattern of nucleic acid fragments separated by electrophoresis; and a display apparatus for displaying the analysis results, there are preferably displayed on the display apparatus thereof, as either letter(s), numerical value(s), or graph(s), 1 or more of any of the following: the name of the target gene site, the nucleotide sequence of the primer, the nucleotide sequences of the alleles (allele 1 and allele 1'), the difference in nucleotide sequence between the alleles (allele 1 and all
- the peak height and peak area of the electrophoretic band of the DNA fragment may be used as the signal intensity.
- DNA sample was isolated by the following procedures:
- Fig. 5 depicts an example of the electropherograms determined by the method for screening genes according to the present invention.
- Figs. 5(A) and 5(B) show the electropherograms of normal and abnormal samples, respectively.
- the target was a single nucleotide polymorphism of the exon 11 of BRCA 1 gene, which gene is expressed systemically, for example in blood, and is capable of preparing from DNA or RNA that is extracted from leukocytes of a patient with familial breast cancer.
- the transverse axis represents electrophoresis time
- the vertical axis represents a quantity of fluorescent light from fluorescence-labeled primer (in counts).
- Area of electrophoretic band 41 of "genomic DNA fragment” from allele 1 is represented as S1(DNA), and peak value of the band as P1(DNA); area of electrophoretic band 42 of "genomic DNA fragment from allele 1' is represented as S2 (DNA), and peak value of the band as P2(DNA); area of electrophoretic band 43 of "cDNA fragment” from allele 1 is represented as S1(cDNA), and peak value of the band as P1(cDNA); and area of electrophoretic band 44 of "cDNA fragment” from allele 1' is represented as S2(CDNA), and peak value of the band as P2(CDNA).
- Fig. 6 shows an effect of PCR cycle number in the method for screening genes according to the present invention, where Fig. 6(A) shows the relation of a PCR cycle number and a DNA copy number, and Fig. 6(B) shows the relation of a PCR cycle number and a "gene expression imbalance of two alleles".
- the target was a single nucleotide polymorphism of the exon 4 of p53 gene, which gene is expressed systemically, for example in blood, and can be prepared from DNA or RNA which is extracted from leukocytes of a healthy person.
- Primers used in the examples of Figs. 6(A) and 6(B) are represented as SEQ ID NOS:5 and 6:
- a sample from healthy person i.e., DNA, cDNA
- DNA a sample from healthy person
- PCR amplification 94°C for 30 sec., 60°C for 30 sec., and 72°C for 1 min.
- the transverse axis represents a PCR cycle while the vertical axis is a fluorescence quantity emitted from a fluorescence labeled primer (in counts). Since the DNA copy number is proportional to the fluorescence count, the vertical axis represents a DNA copy number.
- a closed circle 53 indicates a value of (S2(cDNA)/S1(cDNA))/(S2(DNA)/S1(DNA)), and the symbol x 54 represents a value of (P2(cDNA)/P1(CDNA))/(P2(DNA)/P1(DNA)).
- all the points are in the range from 0.93 to 1.10.
- the difference in gene expression between alleles is not so large and the gene expression ratio of two alleles is likely to be nearly 1, thus the results in Fig. 6(B) are reasonable.
- Fig. 7 shows an effect of PCR temperature profile in the method for screening genes according to the present invention.
- the results shown in this figure were obtained by using the same sample as in Figs. 6(A) and 6(B).
- the PCR temperature profiles (i.e., combinations of temperature and time in denaturation, annealing and extension) 1 to 4 are as follows.
- Fig. 7 further shows average (1+ ⁇ /k) values and standard deviations (which are numerals following ⁇ ), which were determined by multiple measurements.
- Fig. 8 shows dispersion of three results individually obtained by RT-PCR in the method for screening genes according to the present invention.
- reverse transcriptase Superscript II reverse transcriptase
- the primers used were ones shown in SEQ ID NOS:5 and 6, which amplify a region of the exon 4 of p53 gene.
- PCR temperature profile 1 was employed.
- the ratio of gene expression between alleles i.e. 1+( ⁇ /k), indicated as formula IV
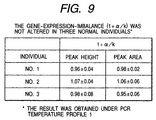
- Fig. 9 shows dispersions of results obtained for three different samples by the method for screening genes according to the present invention.
- the sample used in Figs. 6, 7 and 8 was identical to sample No. 1 in Fig. 9.
- Used as PCR temperature profile was its No. 1.
- dispersions of the results individually obtained in sample Nos. 1, 2 and 3 were 2.0%, 5.7% and 6.3%, respectively, as determined using area, each of which was several % or less, indicating that all results obtained were reasonable.
- the dispersion was as low as several % or less under the same PCR temperature profile conditions in the case of the method of this invention.
- Fig. 10 is a display example that represents screening results obtained by the method of this invention upon medical examination of individuals.
- Fig. 10(A) is a display example representing an electrophoretic pattern (or electropherogram) for each locus of an individual tested, wherein the transverse axis is electrophoresis time and the vertical axis is fluorescent intensity.
- Fig. 10(B) is a display example that represents peak values of electrophoretic bands (H1, H2), calculatedareas (A1, A2), and ratios (H2/H1, A2/A1), by numerals. These values were determined by analyzing the electrophoretic bands on the electrophoresis pattern of each locus shown in Fig. 10(A).
- H1, H2 peak values of electrophoretic bands
- A1, A2 calculatedareas
- ratios H2/H1, A2/A1
- Loci 2 and 3 are also displayed in the same manner.
- each of the above four ratios is ideally 1.0.
- the vertical axis represents any of the four ratios. Based on results obtained by for example a group medical examination, if it is previously known that in healthy people each ratio is in the range from 0.8 to 1.2 then the boundary between normal and abnormal is represented by dot lines.
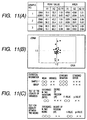
- Fig. 11 is a display example that displays screening results obtained upon group medical examination by the method of the present invention.
- the display in Fig. 11(A) is similar to that in Fig. 10(B) and is based on screening results for a certain locus in a plurality of subjects (or samples).
- each dot is (1.0, 1.0). Many dots obtained by this screening are present near (1.0, 1.0). If there is a sample with abnormality of gene expression among samples to be tested, dots for sample having such-abnormality are displayed at positions apart from (1.0, 1.0), whereby one can readily identify the abnormal samples. For example, when clicking such a dot with a pointing apparatus like mouse, one can refer to more detailed screening results regarding an abnormal sample.
- Fig. 11(C) is a display example showing a statistical significance between an abnormal sample, which is displayed at a position apart from (1.0, 1.0) and is designated by clicking it with a pointing apparatus, and a population including no abnormal sample, the statistical significance being calculated by for example t-test (i.e., test for equality between two mean values) or F-test (i.e., test of the equality of variances).
- t-test i.e., test for equality between two mean values
- F-test i.e., test of the equality of variances
- t-test displayed for t-test are a difference in two mean values, a ratio of two variations, a degree of freedom (DF), a t-value, and a p-value
- F-test a ratio of two variations, a DF, a F-value and a p-value. Any one of t-test and F-test may be displayed with respect to its results.
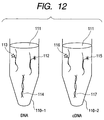
- Fig. 12 shows an example of applying DNA-DNA hybridization to the method for screening genes according to the present invention.
- genomic DNA and cDNA are amplified in tubes 110-1 and 110-2 containing a PCR buffer.
- the amplification of genomic DNA and cDNA is performed in tubes 110-1 and 110-2, respectively.
- amplified "genomic DNA fragment" 114 and "CDNA fragment” 117 are separately denatured to a single strand by heat treatment or the like.
- to tube 110-1 are added a DNA probe 112, which hybridizes specifically with allele 1 of genomic DNA, and a DNA probe 113, which hybridizes specifically with allele 1' of genomic DNA.
- the DNA probes, 112 and 113 each are previously labeled with a fluorescent agent, where in fluorescent agents one has a difference of 10 nm or more in emission wave length when compared to the other.
- Tube 110-1 is irradiated with light having a wave length which is in the vicinity of an excitation wave length of the fluorescent agent. The generated fluorescence is detected by means of detector. Fluorescent intensities from DNA probes 112 and 113 are corresponding to S1(DNA) and S2(DNA), respectively.
- tube 110-2 are added to tube 110-2 a DNA probe 115, which hybridizes specifically with allele 1 of cDNA, and a DNA probe 116, which hybridizes specifically with allele 1' of cDNA.
- the DNA probes, 115 and 116 each are previously labeled with a fluorescent agent, where in fluorescent agents one has a difference of 10 nm or more in emission wave length when compared to the other.
- Tube 110-2 is irradiated with light having a wave length which is in the vicinity of an excitation wave length of the fluorescent agent. The generated fluorescence is detected by means of detector.
- Fluorescent intensities from DNA probes 115 and 116 correspond to S1(CDNA) and S2(cDNA) respectively, so that s2(DNA)/S1(DNA) and S2(cDNA)/S1(cDNA) can be compared.
- the method of this invention can also be carried out by probe hybridization.
- the method for screening genes according to the present invention is based on a new paint of view, which makes it possible to detect the presence or absence of an abnormal gene or to clarify a significance of nucleotide polymorphism, by utilizing as an indicator a "difference in gene expression between alleles" or a "ratio of gene expression between alleles".
- mRNA from each heterozygous allele is separated and a difference in quantity between mRNAs is measured by RT-PCR-SSCP, utilizing nucleotide sequence polymorphism in an exon region of genomic DNA.
- the heterozygosity of DNA is examined using the same process and is compared to the quantitative difference of mRNA.
- the method for screening genes according to the present invention makes it possible to detect the presence or absence of an abnormal gene or to clarify a significance of a genetic abnormality which can not be determined by DNA sequencing only, by utilizing as an indicator a "difference in gene expression between alleles" or a "ratio of gene expression between alleles". Moreover, since the dispersion caused by sample preparation and PCR amplification becomes small, this method is superior to conventional methods in respect of quantification and reproducibility whereby the method or apparatus for screening genes, which is suitable for being automated, can be provided.
Landscapes
- Chemical & Material Sciences (AREA)
- Life Sciences & Earth Sciences (AREA)
- Health & Medical Sciences (AREA)
- Organic Chemistry (AREA)
- Proteomics, Peptides & Aminoacids (AREA)
- Molecular Biology (AREA)
- Zoology (AREA)
- Wood Science & Technology (AREA)
- Analytical Chemistry (AREA)
- Engineering & Computer Science (AREA)
- Physics & Mathematics (AREA)
- General Health & Medical Sciences (AREA)
- Immunology (AREA)
- Biochemistry (AREA)
- Genetics & Genomics (AREA)
- Biotechnology (AREA)
- Microbiology (AREA)
- Biophysics (AREA)
- Chemical Kinetics & Catalysis (AREA)
- Bioinformatics & Cheminformatics (AREA)
- General Engineering & Computer Science (AREA)
- General Physics & Mathematics (AREA)
- Electrochemistry (AREA)
- Pathology (AREA)
- Measuring Or Testing Involving Enzymes Or Micro-Organisms (AREA)
- Investigating Or Analysing Biological Materials (AREA)
- Investigating Or Analysing Materials By The Use Of Chemical Reactions (AREA)
Applications Claiming Priority (2)
| Application Number | Priority Date | Filing Date | Title |
|---|---|---|---|
| JP29425799 | 1999-10-15 | ||
| JP29425799A JP4058508B2 (ja) | 1999-10-15 | 1999-10-15 | 遺伝子検査方法及び遺伝子検査装置 |
Publications (3)
| Publication Number | Publication Date |
|---|---|
| EP1092782A2 true EP1092782A2 (fr) | 2001-04-18 |
| EP1092782A3 EP1092782A3 (fr) | 2003-09-24 |
| EP1092782B1 EP1092782B1 (fr) | 2006-02-08 |
Family
ID=17805387
Family Applications (1)
| Application Number | Title | Priority Date | Filing Date |
|---|---|---|---|
| EP20000122440 Expired - Lifetime EP1092782B1 (fr) | 1999-10-15 | 2000-10-13 | Méthode et appareil de screening génétique |
Country Status (3)
| Country | Link |
|---|---|
| EP (1) | EP1092782B1 (fr) |
| JP (1) | JP4058508B2 (fr) |
| DE (1) | DE60025871T2 (fr) |
Cited By (5)
| Publication number | Priority date | Publication date | Assignee | Title |
|---|---|---|---|---|
| WO2005054458A1 (fr) * | 2003-12-03 | 2005-06-16 | Hitachi High-Technologies Corporation | Methode d'analyse d'acide nucleique, cellule d'analyse d'acide nucleique et analyseur d'acide nucleique |
| WO2006007648A1 (fr) * | 2004-07-20 | 2006-01-26 | Conexio 4 Pty Ltd | Procede et appareil d'analyse de sequence d'acide nucleique |
| US7476502B2 (en) | 2004-04-12 | 2009-01-13 | Willey James C | Methods and compositions for assaying analytes |
| US8304192B2 (en) | 2004-03-05 | 2012-11-06 | University Of Toledo | Methods and compositions for assessing nucleic acids and alleles |
| CN103642916A (zh) * | 2013-12-03 | 2014-03-19 | 四川农业大学 | 一种快速有效鉴定偃麦草属Ee基因组的方法 |
Families Citing this family (2)
| Publication number | Priority date | Publication date | Assignee | Title |
|---|---|---|---|---|
| JP4922778B2 (ja) * | 2007-01-31 | 2012-04-25 | 株式会社日立ハイテクノロジーズ | 遺伝子検査結果判定法およびプログラムおよびその装置 |
| WO2009151757A2 (fr) * | 2008-04-07 | 2009-12-17 | Transnetyx, Inc. | Procédé et appareil de dépistage médico-légal |
-
1999
- 1999-10-15 JP JP29425799A patent/JP4058508B2/ja not_active Expired - Fee Related
-
2000
- 2000-10-13 EP EP20000122440 patent/EP1092782B1/fr not_active Expired - Lifetime
- 2000-10-13 DE DE2000625871 patent/DE60025871T2/de not_active Expired - Fee Related
Non-Patent Citations (6)
| Title |
|---|
| HAYASHI K: "Recent enhancements in SSCP" GENETIC ANALYSIS: BIOMOLECULAR ENGINEERING, ELSEVIER SCIENCE PUBLISHING, US, vol. 14, no. 5-6, February 1999 (1999-02), pages 193-196, XP004158704 ISSN: 1050-3862 * |
| MAKINO R ET AL: "F-SSCP: fluorescence-based polymerase chain reaction-single-strand conformation polymorphism (PCR-SSCP) analysis." PCR METHODS AND APPLICATIONS. UNITED STATES AUG 1992, vol. 2, no. 1, August 1992 (1992-08), pages 10-13, XP000644666 ISSN: 1054-9803 * |
| MURAKAMI Y ET AL: "INACTIVATION OF THE RETINOBLASTOMA GENE IN A HUMAN LUNG CARCINOMA CELL LINE DETECTED BY SINGLE-STRAND CONFORMATION POLYMORPHISM ANALYSIS OF THE POLYMERASE CHAIN REACTION PRODUCT OF CDNA" ONCOGENE, BASINGSTOKE, HANTS, GB, vol. 6, no. 1, 1991, pages 37-42, XP000671241 ISSN: 0950-9232 * |
| SHIGYO MASANORI ET AL: "Allelic loss on chromosome 9 in bladder cancer tissues and urine samples detected by blunt-end single-strand DNA conformation polymorphism." INTERNATIONAL JOURNAL OF CANCER, vol. 78, no. 4, 9 November 1998 (1998-11-09), pages 425-429, XP002247702 ISSN: 0020-7136 * |
| SUGANO K ET AL: "Diagnosis of bladder cancer by analysis of the allelic loss of the p53 gene in urine samples using blunt-end single-strand conformation polymorphism" INTERNATIONAL JOURNAL OF CANCER 1997 UNITED STATES, vol. 74, no. 4, 1997, pages 403-406, XP002247701 ISSN: 0020-7136 * |
| YOKOZAKI HIROSHI ET AL: "Alterations of p73 preferentially occur in gastric adenocarcinomas with foveolar epithelial phenotype." INTERNATIONAL JOURNAL OF CANCER, vol. 83, no. 2, 8 October 1999 (1999-10-08), pages 192-196, XP002247700 ISSN: 0020-7136 * |
Cited By (7)
| Publication number | Priority date | Publication date | Assignee | Title |
|---|---|---|---|---|
| WO2005054458A1 (fr) * | 2003-12-03 | 2005-06-16 | Hitachi High-Technologies Corporation | Methode d'analyse d'acide nucleique, cellule d'analyse d'acide nucleique et analyseur d'acide nucleique |
| US8304192B2 (en) | 2004-03-05 | 2012-11-06 | University Of Toledo | Methods and compositions for assessing nucleic acids and alleles |
| US7476502B2 (en) | 2004-04-12 | 2009-01-13 | Willey James C | Methods and compositions for assaying analytes |
| WO2006007648A1 (fr) * | 2004-07-20 | 2006-01-26 | Conexio 4 Pty Ltd | Procede et appareil d'analyse de sequence d'acide nucleique |
| US7617054B2 (en) | 2004-07-20 | 2009-11-10 | Conexio 4 Pty Ltd | Method and apparatus for analysing nucleic acid sequence |
| CN103642916A (zh) * | 2013-12-03 | 2014-03-19 | 四川农业大学 | 一种快速有效鉴定偃麦草属Ee基因组的方法 |
| CN103642916B (zh) * | 2013-12-03 | 2015-03-25 | 四川农业大学 | 一种快速有效鉴定偃麦草属Ee基因组的方法 |
Also Published As
| Publication number | Publication date |
|---|---|
| JP2001112499A (ja) | 2001-04-24 |
| DE60025871D1 (de) | 2006-04-20 |
| JP4058508B2 (ja) | 2008-03-12 |
| DE60025871T2 (de) | 2006-10-05 |
| EP1092782A3 (fr) | 2003-09-24 |
| EP1092782B1 (fr) | 2006-02-08 |
Similar Documents
| Publication | Publication Date | Title |
|---|---|---|
| EP2663652B1 (fr) | Analyse haute résolution des courbes de fusion à titre d'outil de précriblage | |
| CN108913757B (zh) | 一种染色体非整倍体数目异常的引物组与检测试剂盒及其应用 | |
| CN104805206B (zh) | 检测tert基因启动子突变的试剂盒及其检测方法 | |
| JP3844996B2 (ja) | 反復性pcr産物の融解曲線解析方法 | |
| CN110541033B (zh) | Egfr基因突变检测用组合物及检测方法 | |
| KR20160115913A (ko) | 결정적 제한 부위 전체 게놈 증폭에 의해 수득된 dna 서열의 라이브러리의 게놈 보전성 및/또는 품질을 측정하기 위한 방법 및 키트 | |
| CN109735623B (zh) | 一种结直肠癌生物标志物 | |
| EP1092782B1 (fr) | Méthode et appareil de screening génétique | |
| CN104928355A (zh) | 检测braf基因突变的方法及其试剂盒 | |
| WO1996001908A1 (fr) | Procede, reactifs et kit de detection ciblee et de diagnostic du retinoblastome | |
| US20030082616A1 (en) | Apparatus and method for analyzing nucleic acids and related genetic abnormality | |
| CN110564861A (zh) | 人类Y染色体STR基因座和InDel位点的荧光标记复合扩增试剂盒及其应用 | |
| KR20170051747A (ko) | 피부 주름 발생 민감도 진단용 단일염기다형성 마커 및 이의 용도 | |
| CN110709522A (zh) | 生物样本核酸质量的测定方法 | |
| EP2447376A1 (fr) | Sonde de détection de polymorphisme, procédé de détection de polymorphisme, évaluation de l'efficacité de médication et kit de détection de polymorphisme | |
| CN101883864B (zh) | 用在癌症检测中的约12317-16254残基之间的线粒体dna缺失 | |
| US9528161B2 (en) | Materials and methods for quality-controlled two-color RT-QPCR diagnostic testing of formalin fixed embedded and/or fresh-frozen samples | |
| CN115747322B (zh) | 一种恒温多重扩增检测肝豆状核变性atp7b基因高频突变位点基因分型的检测方法 | |
| JP4922778B2 (ja) | 遺伝子検査結果判定法およびプログラムおよびその装置 | |
| EP2653560A1 (fr) | Sonde et procédé de détection de polymorphisme l'utilisant | |
| EP3368690B1 (fr) | Procédé de diagnostic prénatal à l'aide de la pcr numérique. | |
| CN117512118A (zh) | 检测人egfr基因第19外显子缺失突变的引物探针组合物、试剂盒及方法 | |
| RU2746055C1 (ru) | Способ диагностики мутации c.-23+1G>A (rs80338940) гена GJB2 | |
| RU2739889C1 (ru) | Способ диагностики мутации 35delG (rs80338939) гена GJB2 | |
| CN103352070A (zh) | 一种ros1融合基因的筛查方法 |
Legal Events
| Date | Code | Title | Description |
|---|---|---|---|
| PUAI | Public reference made under article 153(3) epc to a published international application that has entered the european phase |
Free format text: ORIGINAL CODE: 0009012 |
|
| AK | Designated contracting states |
Kind code of ref document: A2 Designated state(s): AT BE CH CY DE DK ES FI FR GB GR IE IT LI LU MC NL PT SE |
|
| AX | Request for extension of the european patent |
Free format text: AL;LT;LV;MK;RO;SI |
|
| PUAL | Search report despatched |
Free format text: ORIGINAL CODE: 0009013 |
|
| AK | Designated contracting states |
Kind code of ref document: A3 Designated state(s): AT BE CH CY DE DK ES FI FR GB GR IE IT LI LU MC NL PT SE |
|
| AX | Request for extension of the european patent |
Extension state: AL LT LV MK RO SI |
|
| 17P | Request for examination filed |
Effective date: 20040316 |
|
| AKX | Designation fees paid |
Designated state(s): DE GB |
|
| 17Q | First examination report despatched |
Effective date: 20050121 |
|
| GRAP | Despatch of communication of intention to grant a patent |
Free format text: ORIGINAL CODE: EPIDOSNIGR1 |
|
| GRAS | Grant fee paid |
Free format text: ORIGINAL CODE: EPIDOSNIGR3 |
|
| GRAA | (expected) grant |
Free format text: ORIGINAL CODE: 0009210 |
|
| AK | Designated contracting states |
Kind code of ref document: B1 Designated state(s): DE GB |
|
| REG | Reference to a national code |
Ref country code: GB Ref legal event code: FG4D |
|
| REF | Corresponds to: |
Ref document number: 60025871 Country of ref document: DE Date of ref document: 20060420 Kind code of ref document: P |
|
| PGFP | Annual fee paid to national office [announced via postgrant information from national office to epo] |
Ref country code: GB Payment date: 20060920 Year of fee payment: 7 |
|
| PGFP | Annual fee paid to national office [announced via postgrant information from national office to epo] |
Ref country code: DE Payment date: 20061205 Year of fee payment: 7 |
|
| PLBE | No opposition filed within time limit |
Free format text: ORIGINAL CODE: 0009261 |
|
| STAA | Information on the status of an ep patent application or granted ep patent |
Free format text: STATUS: NO OPPOSITION FILED WITHIN TIME LIMIT |
|
| 26N | No opposition filed |
Effective date: 20061109 |
|
| GBPC | Gb: european patent ceased through non-payment of renewal fee |
Effective date: 20071013 |
|
| PG25 | Lapsed in a contracting state [announced via postgrant information from national office to epo] |
Ref country code: DE Free format text: LAPSE BECAUSE OF NON-PAYMENT OF DUE FEES Effective date: 20080501 |
|
| PG25 | Lapsed in a contracting state [announced via postgrant information from national office to epo] |
Ref country code: GB Free format text: LAPSE BECAUSE OF NON-PAYMENT OF DUE FEES Effective date: 20071013 |