EP1092976A2 - Teilchenmessung durch akustischen sprenkeln - Google Patents
Teilchenmessung durch akustischen sprenkeln Download PDFInfo
- Publication number
- EP1092976A2 EP1092976A2 EP00308886A EP00308886A EP1092976A2 EP 1092976 A2 EP1092976 A2 EP 1092976A2 EP 00308886 A EP00308886 A EP 00308886A EP 00308886 A EP00308886 A EP 00308886A EP 1092976 A2 EP1092976 A2 EP 1092976A2
- Authority
- EP
- European Patent Office
- Prior art keywords
- speckle
- particles
- signal
- acoustic
- fluid
- Prior art date
- Legal status (The legal status is an assumption and is not a legal conclusion. Google has not performed a legal analysis and makes no representation as to the accuracy of the status listed.)
- Withdrawn
Links
Images




Classifications
-
- G—PHYSICS
- G01—MEASURING; TESTING
- G01N—INVESTIGATING OR ANALYSING MATERIALS BY DETERMINING THEIR CHEMICAL OR PHYSICAL PROPERTIES
- G01N29/00—Investigating or analysing materials by the use of ultrasonic, sonic or infrasonic waves; Visualisation of the interior of objects by transmitting ultrasonic or sonic waves through the object
- G01N29/02—Analysing fluids
- G01N29/032—Analysing fluids by measuring attenuation of acoustic waves
-
- G—PHYSICS
- G01—MEASURING; TESTING
- G01N—INVESTIGATING OR ANALYSING MATERIALS BY DETERMINING THEIR CHEMICAL OR PHYSICAL PROPERTIES
- G01N15/00—Investigating characteristics of particles; Investigating permeability, pore-volume or surface-area of porous materials
- G01N15/02—Investigating particle size or size distribution
-
- G—PHYSICS
- G01—MEASURING; TESTING
- G01N—INVESTIGATING OR ANALYSING MATERIALS BY DETERMINING THEIR CHEMICAL OR PHYSICAL PROPERTIES
- G01N29/00—Investigating or analysing materials by the use of ultrasonic, sonic or infrasonic waves; Visualisation of the interior of objects by transmitting ultrasonic or sonic waves through the object
- G01N29/22—Details, e.g. general constructional or apparatus details
- G01N29/221—Arrangements for directing or focusing the acoustical waves
-
- G—PHYSICS
- G01—MEASURING; TESTING
- G01N—INVESTIGATING OR ANALYSING MATERIALS BY DETERMINING THEIR CHEMICAL OR PHYSICAL PROPERTIES
- G01N29/00—Investigating or analysing materials by the use of ultrasonic, sonic or infrasonic waves; Visualisation of the interior of objects by transmitting ultrasonic or sonic waves through the object
- G01N29/44—Processing the detected response signal, e.g. electronic circuits specially adapted therefor
- G01N29/46—Processing the detected response signal, e.g. electronic circuits specially adapted therefor by spectral analysis, e.g. Fourier analysis or wavelet analysis
-
- G—PHYSICS
- G01—MEASURING; TESTING
- G01S—RADIO DIRECTION-FINDING; RADIO NAVIGATION; DETERMINING DISTANCE OR VELOCITY BY USE OF RADIO WAVES; LOCATING OR PRESENCE-DETECTING BY USE OF THE REFLECTION OR RERADIATION OF RADIO WAVES; ANALOGOUS ARRANGEMENTS USING OTHER WAVES
- G01S15/00—Systems using the reflection or reradiation of acoustic waves, e.g. sonar systems
- G01S15/88—Sonar systems specially adapted for specific applications
- G01S15/885—Meteorological systems
-
- G—PHYSICS
- G01—MEASURING; TESTING
- G01N—INVESTIGATING OR ANALYSING MATERIALS BY DETERMINING THEIR CHEMICAL OR PHYSICAL PROPERTIES
- G01N2291/00—Indexing codes associated with group G01N29/00
- G01N2291/01—Indexing codes associated with the measuring variable
- G01N2291/015—Attenuation, scattering
-
- G—PHYSICS
- G01—MEASURING; TESTING
- G01N—INVESTIGATING OR ANALYSING MATERIALS BY DETERMINING THEIR CHEMICAL OR PHYSICAL PROPERTIES
- G01N2291/00—Indexing codes associated with group G01N29/00
- G01N2291/02—Indexing codes associated with the analysed material
- G01N2291/024—Mixtures
- G01N2291/02416—Solids in liquids
-
- G—PHYSICS
- G01—MEASURING; TESTING
- G01N—INVESTIGATING OR ANALYSING MATERIALS BY DETERMINING THEIR CHEMICAL OR PHYSICAL PROPERTIES
- G01N2291/00—Indexing codes associated with group G01N29/00
- G01N2291/02—Indexing codes associated with the analysed material
- G01N2291/028—Material parameters
- G01N2291/02809—Concentration of a compound, e.g. measured by a surface mass change
-
- G—PHYSICS
- G01—MEASURING; TESTING
- G01N—INVESTIGATING OR ANALYSING MATERIALS BY DETERMINING THEIR CHEMICAL OR PHYSICAL PROPERTIES
- G01N2291/00—Indexing codes associated with group G01N29/00
- G01N2291/02—Indexing codes associated with the analysed material
- G01N2291/028—Material parameters
- G01N2291/02836—Flow rate, liquid level
Definitions
- the present invention relates to the measurement of size, concentration and size distribution of particles in fluids, and more particularly to the measurement of size, concentration and size distribution of particles in fluids by using acoustic speckle.
- the measurement of the size and concentration of small particles in fluids is important in many industrial and diagnostic applications. Control or monitoring of operations such as crystallization, filtration, combustion, preparation of reaction feed streams, degree of reaction and the like, often depend on the ability to measure the size and concentration of small particles that are components of gas or liquid process streams.
- particle measurement techniques include phase doppler anemometry, microscopy with optical scanning and image analysis, sieving, and particle counting by optical and electrical counters. Although all of these methods are useful in certain applications, each has limitations that make it difficult or impossible to use in certain situations.
- Particle measurement by the use of ultrasonic energy has been shown to have useful advantages in certain applications -- for example, in streams that are optically opaque, or where particle density is high.
- the attenuation of sound as a function of frequency (Acoustic Attenuation Spectroscopy) has been used in the UltrasizerTM device of Malvern Instruments Ltd., Worchester, U.K.
- a transducer inputs an acoustic signal having a certain frequency range into the fluid sample and a second transducer receives the attenuated portion of the original signal.
- Mathematical modeling permits the calculation of particle size and size distribution from the measured attenuation spectra.
- the present invention is directed to a method for determining the size of particles in a fluid comprising the steps of obtaining an acoustic speckle signal of the particles in the fluid and deriving the size of the particles in the fluid from the acoustic speckle signal.
- the present invention is also directed to a novel method for measuring the concentration of particles in a fluid comprising the steps of obtaining an acoustic speckle signal of the particles in the fluid and deriving the concentration of particles in the fluid from the acoustic speckle signal.
- the present invention is also directed to a novel method for determining the size distribution of particles in a fluid comprising the steps of obtaining an acoustic speckle signal of the particles in the fluid and deriving the size distribution of the particles from the acoustic speckle signal.
- the present invention is also directed to a novel method for determining the degree of particle agglomeration in a liquid containing particles that produce individual speckle events, the method comprising obtaining, for two or more individual speckle events, an individual acoustic speckle signal from the liquid and determining the degree of agglomeration from the acoustic speckle signal.
- the present invention is also directed to a novel apparatus for determining the size distribution of particles in a fluid
- a signal generator capable of generating an electrical signal
- a transducer that can translate the electrical signal from the signal generator into an acoustic input signal that is introduced into the fluid
- a sensor that can sense acoustic energy that is scattered by the particles in the fluid in response to their interaction with the acoustic input signal and provide an output electrical signal that is related to the sensed acoustic energy
- an oscilloscope that is capable of acquiring the output signal in an amplitude versus time domain and transforming the signal to a magnitude versus frequency domain
- a computer that is programmed with an algorithm that is capable of identifying an acoustic speckle signal in the frequency domain and relating the magnitude and/or duration of the acoustic speckle signal to the size distribution of the particles in the fluid.
- the size, concentration and size distribution of small particles in a fluid can be derived from a measurement of acoustic speckle signals produced by the particles in response to input signals of acoustic energy.
- This surprising discovery is especially significant because acoustic speckle, particularly for energy of ultrasonic wavelengths, can be measured very quickly and can be transmitted and sensed even in optically opaque fluids.
- the novel measurement technique of this invention can be used alone or can be combined with other particle measurement techniques to provide valuable knowledge about the size and concentration characteristics of both small and larger particles in a fluid on a real-time basis.
- the method of this invention can be used on fluid samples in a test cell or on fluids in process flow streams, in tanks or in reactors.
- the method can be applied anywhere an ultrasonic transducer can be introduced into a fluid to be tested. Moreover, it is believed that the method can be applied to any fluid that will transmit ultrasonic waves and that it can be used to measure the size and concentration characteristics of any particles that scatter ultrasonic energy and that are sufficiently small that their motion within the fluid is controlled by Brownian motion.
- acoustic speckle signals by small particles in a fluid is related to their tendency to move randomly with Brownian motion.
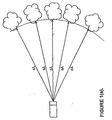
- a beam of monochromatic acoustic energy having a certain wavelength and a certain diameter interacts with the particles, the particles scatter some portion of the acoustic energy. From time to time, some of these particles, each having a diameter that is less than the wavelength of the interacting beam of acoustic energy and less than the beam diameter, assemble stochastically into a common plane before moving out of formation again.
- this plane will lie orthogonal to the path of the acoustic beam and the backscattered signal from each particle will form a coherent sum at the transducer.
- the particles are said to form an acoustic mirror, one form of which is illustrated in Figure 1(a).
- a similar effect can also be produced by particles that are not in the same plane orthogonal to the propagation direction of the ultrasound signal, as long as the particles lie in planes that are separated an integral number of wavelengths apart along the path of the sound wave.
- Such an arrangement is termed a "Bragg lattice", as illustrated in Figure 1(b), which also results in a coherent sum of the backscattered signal from all the particles at the transducer.
- Particles in either of the arrangements described above will be referred to herein as being in an acoustic mirror, or simply, a mirror.
- particles are considered to be "small particles” if their motion in a static fluid is controlled primarily by Brownian motion, as opposed to, for example, gravitational force.
- the diameter of such small particles is believed to be much less than the wavelength of the acoustic energy signal. For a signal having a wavelength that corresponds to a frequency of 1 MHz, for example, this would mean particles having a diameter of from about 5 micrometers down to a few nanometers.
- particles and agglomerates of particles are substantially spherical particles having the same mass as the actual particle and the term "particle size", as that term is applied to single particles, is to be understood to mean a number that is proportional to the diameter of the substantially spherical particle or the agglomerate.
- the approaching acoustic wave encounters each particle in the lattice at the same moment and acoustic energy is emitted by each scattering particle simultaneously and in phase.
- a portion of the acoustic energy that is scattered by these particles can be sensed and measured by a sensing transducer to produce an electrical signal that corresponds to the scattered acoustic energy.
- the acoustic emissions from the mirror combine at the sensing transducer and produce a characteristic signal that is termed an "acoustic speckle" (which, hereinafter, may also be termed a "speckle", or “speckle signal”, or “speckle event").
- the speckle can be displayed on an oscilloscope amplitude versus time plot of scattered ultrasonic energy as a peak having an amplitude significantly greater than that of the energy scattered by particles that are not in a mirror.
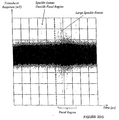
- Several acoustic speckle peaks can be seen in Figures 2(b) and 2(c) as dotted line excursions whose amplitude significantly exceeds the amplitude of non-speckle scattering.
- each mirror forms and disintegrates due to the random motion of the scattering particles, the period of time for which the structure exists is dependent upon the speed with which the scattering particles move in the fluid.
- the velocity of small particles in a fluid due to Brownian motion depends upon the particle size and the viscosity of the fluid. In a fluid having a given viscosity, smaller, dispersed particles will move faster than their larger, or aggregated, counterparts and speckles from small particles will appear and disappear more quickly than will speckles produced by large particles or aggregates.
- the duration of an acoustic speckle event can be used to derive the size of the particles in the mirror that produced the speckle.
- the duration of the acoustic speckle event represents the life span of the speckle event in time.
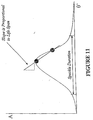
- the term "duration" is a number that is proportional to the life span over time of a measured signal of a speckle event. Depending upon how the duration of a speckle event is measured, the measured value can be equal to the total life span of the individual signal of the speckle event, or it can be some particular fraction thereof. This concept can be described, for illustration purposes only, by reference to Figures 10 and 11.
- Figure 10 shows a conceptual view of an amplitude (A) versus time ( ⁇ ) plot of scattered acoustic energy where the scan has been repeated at a selected repetition frequency over a period of time along the ⁇ ' axis.
- A amplitude
- ⁇ time
- FIG. 10 shows a conceptual view of an amplitude (A) versus time ( ⁇ ) plot of scattered acoustic energy where the scan has been repeated at a selected repetition frequency over a period of time along the ⁇ ' axis.
- A amplitude
- ⁇ time
- the duration of this speckle event can be derived from either a direct measurement of the life span on the persistence display of the oscilloscope, or correlation with frequency dependent scattering amplitude via scattering theory by using techniques analogous to those employed by dynamic light scattering instrumentation such as the Malvern Zetasizer, (Malvern Zetasizer Manual, Malvern Instruments, Malvern, U.K.).
- the duration can be measured by the calculation of some parameter from the speckle signal peak that is a particular fraction of the life span -- such as by calculation of an autocorrelation function as described by Berry et al. , in Physical Chemistry , p.1106, Wiley Publ.
- particle size derived from the duration of a speckle signal by any of these methods represents an average of the sizes of the particles that produced the speckle signal.
- particle size it is to be understood to include absolute particle size, as well as values that are related to absolute particle size and from which the absolute particle size can be derived.
- the size distribution of the particles in the fluid can be derived from a measurement of the number and duration of speckle events over a sufficient period of time. This derivation is possible because the average size of the particles producing each speckle event can be derived from the duration of the individual speckle signal and, thus, the frequency of occurrence of speckle events for an array of average particle sizes essentially represents the particle size distribution of the particles in the fluid. Since the measurement of speckle duration provides an average particle size, it is believed that the more speckle events that are included in the calculation, the more accurate will be the particle size distribution that is derived in this manner.
- the peak height of an acoustic speckle signal is related to the total cross-section area of the particles that produced the speckle event.
- This provides the basis for an alternative method of deriving particle concentration.
- the method can be briefly described as follows. Since the average size of the particles producing the speckle event can be derived from the duration of the speckle signal -- as described above -- the number of particles that produced the speckle can be derived by dividing the total cross section area of particles producing the speckle by some function of the average particle diameter. This number can be used to produce a particle concentration value when it is related to some characteristic volume, such as, for example, the volume of the focal region of the transducer, as will be described below. Once particle concentration is determined, the size distribution of the particles in the fluid can be derived by a method that is similar to that described above.
- a signal generator, or pulser 30 generates an electrical signal which is transmitted to a transducer 10 that transduces the electric signal into an acoustic input signal that is introduced into the fluid having the particles to be measured.
- the same transducer, or, optionally, a separate transducer acts as a sensor 20 , to sense a portion of the acoustic energy that is scattered by the particles in the fluid in response to their interaction with the acoustic input signal and provide an output electrical signal that corresponds to the sensed acoustic energy.
- An amplifier 40 amplifies the output signal and transmits the amplified signal to an oscilloscope 50 that is capable of acquiring the output signal in an amplitude versus time domain and transforming the signal to a magnitude versus frequency domain.
- the oscilloscope is preferably capable of selecting that part of the detected scattered signal that results from acoustic scattering by particles in the focal region (which step can be termed "gating") and transforming only the selected part of the output signal into a magnitude vs. frequency domain.
- This transformed output signal can be transmitted to a computer 60 that is programmed with an algorithm that is capable of relating the magnitude and/or duration of the acoustic speckle signals to the size of the particles in the fluid.
- the system described above could be easily modified while still carrying out the same functions.
- the electric signal to be transmitted to the transducer 10 could be generated by a combined pulser/amplifier, as well as by the pulser 30 .
- the oscilloscope 50 could provide amplification of the sensed signal and replace the separate amplifier 40 .
- the computer 60 could accomplish the calculation functions ascribed above to the oscilloscope 50 , or vice versa.
- the acoustic transducer 10 may be mounted in a test cell, or may be mounted directly in a pipeline or a tank. Other systems for the ultrasonic measurement of particles in liquids are generally described in U.S. Pat. No.
- the transducer 10 is an ultrasonic transducer that introduces a signal of acoustic energy into the fluid.
- the transducer includes, in general, a piezoelectric element capable of transforming electrical signals into physical pulses. If the element is in contact with a fluid, such physical pulses are transferred to the fluid and initiate waves having a frequency that is controlled by the frequency of the electronic signal.
- the transducer 10 is a focused transducer that contains a lens to focus the signal as illustrated by the dashed lines of Figure 4.
- the focal length of the transducer is the distance from the end of the transducer to the point where the wave patterns converge.
- focal length is not critical, it is preferred that the focal length is less than the distance from the lens of the transducer 10 to any solid material or to the opposing wall of a test cell, pipe or tank. In other words, the focal region should be within the fluid of interest.
- a transducer 10 having a focal length of about 100 mm to about 200 mm is suitable for the present invention as long as no wall, pipe or other process equipment structure intervenes between the transducer 10 and the focal region.
- the selection of a transducer 10 involves consideration of its capability to introduce into the fluid an acoustic signal with respect to the characteristics of duration, power and frequency.
- Such signal can be in the form of a pulse that is transmitted to the transducer 10 as a high-voltage spike of short duration and typically repeated many times per second, or as a tone burst.
- tone burst signals are useful in circumstances where the use of high voltage is undesirable and where a signal of narrower frequency band is preferred.
- the voltage of the input signal pulse can be from about 100 to about 600 volts.
- An input signal pulse voltage of from about 200 to about 500 volts is preferred and from about 250 to about 500 volts is more preferred.
- the input signal is transmitted to the transducer at a pulse repetition frequency of from about 5 to about 250 Hertz (Hz). However, a frequency of from about 20 to about 200 Hz is preferred and a frequency of from about 100 to about 200 Hz is more preferred.
- the duration of the input signal can be from about 5 to about 80 nanoseconds (ns). However, it is preferred that the duration of the input signal be from about 10 to about 60 ns and it is more preferred that the duration be from about 20 to about 40 ns.
- the detected power of the input signal can be amplified so that it is from about 5 to about 50 decibels (dB). However, it is preferred that it be from about 10 to about 40 dB and more preferred that it be from about 20 to about 40 dB.
- a series of input pulses each of 500 volts, having a duration of 25 nanoseconds and a power of 33 dB and repeated at a frequency of 200 Hz, and with a receiver gain of 33 dB, is suitable for some applications of this invention.
- the transducer should be capable of resisting temperature to 200°C, and preferably to 300°C, and most preferably to 500°C.
- the transducer should also be capable of resisting pressure to about 200 kPa, and preferably to about 2.50 MPa and most preferably to about 5 MPa.
- the transducer should preferably be capable of resisting chemical corrosion and physical erosion by the fluids in which it is to be used.
- Suitable transducers may be commercially obtained or may be constructed.
- One type of commercially available acoustic transducer suitable for use in the present system is a SLIM 10 - 10/SF30 mm/834/02, 10 MHz transducer as supplied by Sonatest Ltd., Milton Keynes, U.K.
- the acoustic transducer 10 may also be used as a sensor to sense acoustic energy scattered by particles in the fluid.
- a separate sensor 20 may be used. If a separate sensor 20 is used, it may be placed anywhere in the fluid in relationship to the probe 10 , that is insensitive to the directly transmitted beam, but is preferably close enough to receive energy scattered from the focal region.
- the sensor whether the transducer 10 , or a separate sensor 20 , converts that portion of the scattered acoustic energy encountering the piezoelectric element into an electrical signal. This signal corresponds to the amplitude of the portion of scattered acoustic energy encountering the piezoelectric element as a function of time and is termed the "output signal". Operation of an acoustic energy sensor, in general, is described by the references given above in the section describing the transducer 10 .
- the senor of the subject system has sensitivity suitable for sensing back-scattered energy having frequencies up to 20 MHz, but a sensor which can sense back-scattered energy having frequencies up to 100 MHz is more preferred and a sensor which can sense back-scattered energy having frequencies up to 200 MHz is most preferred.
- a pulser/receiver, or pulser 30 provides the necessary input signal to drive the transducer 10 .
- An amplifier 40 amplifies the sensed scattered signal before it is transmitted to the oscilloscope 50 .
- the pulser 30 and amplifier 40 may be separate components or may be combined in a single component.
- a pulser/receiver that provides both pulser 30 and amplifier 40 functions in a combined component is a UTEX 320; available from Scientific Instruments Inc., Mississauqua, Ontario, Canada. It is preferred that the pulser/receiver is supplied with a software package such as, for example, Ultrasonic Instrument Control V3.04.
- the pulser/receiver is capable of providing an input signal having a frequency range of 1 MHz to 150 MHz; a pulse voltage of from 100 V to 500 V; a pulse width of from 5 ns to 80 ns; a pulse repetition frequency (PRF) of about 200 Hz to 20KHz; and a gain of from 0 to 63 dB
- the oscilloscope 50 of the present system should be capable of gating the scattered acoustic signal by limiting the output signal to the portion of acoustic energy scattered by particles in the focal region.
- the oscilloscope is also preferably capable of carrying out an analog-to-digital conversion and, more preferably, of transforming the output signal from an amplitude vs. time domain to a magnitude vs. frequency domain as described below.
- the gating function limits the output signal to the sensed energy that was scattered by particles within the focal region. Thus, the gating step deletes that part of the signal caused by any reflection due to an opposing pipe wall and all other portions of the signal except for the scatter due to particles in the focal region.
- An oscilloscope that is suitable for use in the present system is, for example, a LeCroy 9310A, dual channel 400 MHz oscilloscope, with a sampling rate up to 100 MS/s.
- Such oscilloscopes should be complete with software suitable for waveform processing such as, for example, Wave form processing packages WPO1 and WPO2 incorporating FFT averaging function, available from LeCroy.
- Data from the oscilloscope is transferred to a computer 60 by using, for example, a National Instruments IEEE Plug and Play adapter.
- the oscilloscope may have an integral computer that is capable of carrying out all of the necessary computational functions that will be described below.
- a computer 60 is preferably one that is capable of receiving the signal from the oscilloscope 50 and storing the waveforms for future reference and also of comparing the waveforms against reference scans and other standards. It is also preferred that the computer be capable of performing the derivation of the size, concentration and size distribution of particles from an acoustic speckle signal of the particles in a fluid; of determining the degree of asphaltene agglomeration in a hydrocarbon liquid and to initiate any desired alarm or control action. It is more preferred that the computer is programmed with one or more algorithms that are capable of relating the magnitude and/or duration of acoustic speckle signals to the size, concentration, and/or size distribution of the particles in the fluid.
- the algorithms can include a diffusion model that is capable of relating the size of particles that participate in a speckle event to the duration of an acoustic speckle signal of the speckle event.
- the algorithm can be one that includes an autocorrelation model that is capable of relating the size of particles that participate in a speckle event to the duration of an acoustic speckle signal of the speckle event.
- a personal computer having at least a Pentium® processor, or its equivalent, and having spreadsheet software such as, for example, Microsoft Excel®, be used in the present system.
- the present invention provides a novel method for determining the size, concentration and size distribution of particles in a fluid. The method will now be described in more detail.
- the steps of the method include obtaining an acoustic speckle signal of the particles in the fluid and deriving the size, concentration and/or size distribution of the particles from the acoustic speckle signal.
- One embodiment of the method for obtaining an acoustic speckle signal of the particles in a fluid is by introducing an input signal of acoustic energy into the fluid; sensing a portion of scattered acoustic energy resulting from interaction of the particles with the input signal; producing an output signal corresponding to amplitude of the portion of scattered acoustic energy as a function of time; and transforming the output signal from a time domain to a frequency domain.
- a peak on the magnitude versus frequency plot, as shown in Figure 5, can be identified as characteristic of the acoustic speckle.
- the coherent scattered acoustic energy will sum, the incoherent scattered acoustic energy will cancel out and a clearer acoustic speckle signal peak can be identified as shown by the less noisy line in Figure 5.
- the output signal that the oscilloscope receives is in an amplitude versus time domain. If it is desired, the output signal can be limited to a certain frequency range before it is transmitted to the oscilloscope in order to delete high frequency signals that provide no information about the particles in the fluid. In some situations, for example, the output signal can be limited to a frequency range of from 1 to 30 MHz, or even from 1 to 20 MHz.
- FIG. 6(a) An example of an amplitude versus time signal on an oscilloscope for a sample of crude oil is shown in Figure 6(a).
- the output signal can be limited to acoustic energy scattered by particles in the focal region.
- Figure 6(b) shows another oscilloscope plot of an amplitude versus time output signal for crude oil that has been gated, or limited, to the signal from particles in the focal region. The selected part of the signal from the focal region is shown as a bolded section of the signal plot.
- the output signal from the focal region is then transformed from a time domain to a frequency domain.
- This transformation is preferably carried out by the oscilloscope by using a Fast Fourier Transformation (FFT) algorithm to transform the gated signal from time to frequency domain.
- FFT Fast Fourier Transformation
- Computation of the FFT is described in detail at pages C-3 to C-5 of the Operating Manual for the LeCroy Oscilloscope, LeCroy Corporation, Chestnut Hill, NY. Where a semiquantitative and simple assessment of the total backscattering is required, the power spectrum can be used. This provides a measure of the total backscattered intensity detected in the focal region.
- Figure 6(c) shows the oscilloscope plot of the FFT of the output signal of Figure 6(b).
- Figure 6(d) shows a plot of the FFT of the gated part of the transformed signal averaged over 900 oscilloscope sweeps.
- the time-averaged acoustic speckle signal is identified on the plot of Figure 6(d) as the peak at a frequency of about 10 MHz -- corresponding to the transducer output maximum.
- the acoustic speckle signal for each individual speckle event has a certain duration that corresponds to the average size of the particles that produced the speckle event.
- the duration can be used to derive the size of the particles that produced the speckle event.
- the particle size can also be derived by using an autocorrelation model of the type described by Berry et al. , in Physical Chemistry , p.1106, Wiley Publ. New York (1980); and by Wellstead, P.E., Methods and Applications of Digital Spectral Techniques , Technical Report No. 0008/83, UMIST, Solartron Instruments, Farnborough, U.K.
- the novel method measures the average size of particles that produce an individual speckle event, it is believed that when the duration of two or more speckle events are measured, the average particle size that is calculated for the different speckle events will vary within the range of the actual range of sizes of particles in the fluid. It follows that the higher the concentration of particles of a given size, the more frequently those particles will produce speckle events. Thus, the concentration of particles of a given size can be obtained by measuring the frequency of occurrence of speckle events produced by particles having that given size. If desirable, one of ordinary skill would easily be able to obtain a correlation between particle size and frequency of occurrence of speckle events in a fluid having a given viscosity by carrying out a routine test in the same fluid with particles of known size at several concentration levels.
- the novel method is capable of making acoustic speckle measurements very rapidly and many speckle events can be recorded and measured within a short period of time. If a sufficient number of individual measurements are taken, the concentration of particles having average sizes that span the size range of all particles in the fluid can be obtained. This can be done by combining the particle concentration measurements for all of the average particle sizes measured.
- One method for making this combination is by defining the total range of particle sizes in the fluid as being the range between the smallest and the largest average particle size calculated in the test; dividing the total range of particle sizes into a discrete number of smaller size ranges; and adding together the particle concentrations that were determined for particles having an average size within each smaller size range.
- the total range of particle sizes in the fluid would be taken to be from 1 to 100 microns. This range could then be divided into almost any number of smaller size ranges -- 20 for example.
- the discrete sub-ranges would be 0 - 5 microns, 5 - 10 microns, and so on, up to 95 - 100 microns.
- An example of how such a plot of frequency of occurrence versus average particle size might appear for this example is shown in Figure 7.
- the concentration of particles in the fluid could then be derived by adding the concentration of particles in each of the 20 discrete smaller size ranges.
- the novel method makes it possible to derive the particle size distribution in the fluid from a frequency of occurrence versus average particle size distribution.
- the particle size measurements are required for such derivation, it is preferred that many individual measurements be used.
- the 2000 speckle events can be categorized into a number of discrete average particle sizes, each discrete size having a narrow size range.
- the frequency of occurrence of speckle events in each discrete size range is then essentially a measure of the size distribution of the particles in the fluid.
- the distribution measurement would have been provided in the short span of only about 0.01 seconds. This rapidity of measurement provided by the present invention would permit measurement and reporting of particle size distribution on a real-time basis.
- a sufficient number of particle size calculations are obtained for the calculation of a particle size distribution for the particles in the fluid. If the plot of Figure 7, for example, is based on a sufficient number of individual particle size calculations, the curve itself would be indicative of the particle size distribution. It is preferred that the size distribution be derived on the basis of at least about 100 individual particle size calculations and at least about 500 individual calculations are more preferred, at least about 1000 individual calculations are even more preferred, and at least about 2000 calculations or more are most preferred. It is also necessary to presume a particular form for the particle size distribution, such as, for example, a log-normal distribution.
- the concentration of particles in the focal region is measured for two or more speckle events and the values of such concentrations are averaged, the concentration of particles in the fluid can be calculated. As described previously, it is preferred that measurements be taken for many speckle events in order to increase the accuracy of the calculation.
- the step of calculating particle concentration from speckle peak height can be left out and a value that is proportional to particle concentration can be calculated directly from average particle size and speckle peak height data.
- the size distribution of particles in the fluid can be calculated as described previously.
- the apparatus and method of the present invention can be used to measure the size, concentration and size distribution of particles in any fluid, but the novel apparatus and method are particularly useful for use where the fluid is a liquid and even more particularly when the liquid is an optically opaque liquid.
- the novel apparatus and method can be used when the liquid is corrosive, hot or under pressure.
- a particularly useful application of the subject method and apparatus is for the measurement of particles in crude oil, or other opaque hydrocarbon liquids.
- One embodiment of the novel method has been found to be particularly useful for determining the degree of agglomeration of small particles, such as asphaltene particles, in liquids. This embodiment is especially useful when the liquid is a hydrocarbon liquid.
- This method comprises obtaining, for two or more individual speckle events, an individual acoustic speckle signal from the hydrocarbon liquid and determining the degree of asphaltene agglomeration from the acoustic speckle signal.
- an input signal of acoustic energy is introduced into the fluid, which input signal is focused on a focal region in the liquid.
- An output signal of the acoustic energy that is scattered by the particles in the focal region in response to their interaction with the input signal is sensed as amplitude as a function of time.
- This output signal is then transformed from a time domain to a frequency domain.
- the transformation is preferably carried out by an the oscilloscope by the use of a Fast Fourier Transform algorithm.
- An acoustic speckle signal from the transformed output signal in the frequency domain is then identified.
- the transformed signal from the control liquid acts as a baseline standard.
- a plot of a transformed output signal from a crude oil sample plotted concurrently with a transformed signal from n-heptane as a control fluid is shown in Figure 8.
- the degree of asphaltene agglomeration can be determined by comparing the acoustic speckle signal from the hydrocarbon liquid with the acoustic speckle signal from the control liquid.
- One method by which the signal from the hydrocarbon liquid and the sample from the control liquid can be compared is by subtracting the magnitude of the acoustic speckle signal of the hydrocarbon liquid at a selected frequency from the magnitude of the acoustic speckle signal of the control liquid at the same frequency to obtain a difference.
- the maximum value of this difference between the two curves is herein termed the "speckle height”.
- An illustration of the calculation of the speckle height from the data of Figure 8 is shown in Figure 9, where maximum speckle height is seen to occur at a frequency of about 11 MHz.
- the method and apparatus of the present invention can be used when the test fluid is static, such as in a non-flow sample cell, but it can also be used in an agitated tank or process line in which the fluid is flowing.
- the only limitation for the use of the method in a flow situation is that the particles constituting the speckle mirror remain illuminated by the acoustic beam throughout the speckle event. Thus, flow along the acoustic beam axis will remain longer in the beam than flow transverse to the beam.
- the longest event that can be detected will be a function of beam width, flow rate, the size of the focal region and the relationship between the direction of fluid flow and the acoustic beam direction.
- Transducers that are installed in an elbow of a flow conduit and which have their beam aligned into the incoming or outgoing fluid, for example, would be preferred for use in fluid flow situations.
- the present method and apparatus have the advantage of being useable with only one transducer when it is important to minimize cost or number of penetrations into the fluid. Only a single type of signal is required -- an acoustic energy signal -- rather than requiring other, additional signals and there is no need for the addition of titrants, such as heptane or hexane, or contaminating chemicals to the subject fluid. Measurements by the present method and apparatus provide a measurement of particle size, concentration and/or size distribution that are available very quickly and even on a real-time basis.
- This example shows the observation of acoustic speckle in crude oil.
- a SLIM 10-10/SF30mm/834/02 transducer available from Sonatest, UK; Dickens Road, Milton Keynes, MK12 5QQ, UK; was connected with a pulser/receiver and a LeCroy 9310A oscilloscope as shown in Figure 3.
- the transducer also acted as the sensor for backscattered acoustic energy.
- the input signal settings were 500 volts, 25 ns, 200 Hz and using a power receiver having a gain of 33 dB.
- the oscilloscope settings were set to an impedance of DC50 Ohms, with the screen plot axes being set to 0.5 microseconds per division for the X-axis (time) and from 5 mV to 20 mV per division (amplitude) for the Y-axis.
- the tip of the transducer was immersed into a sample of crude oil at 23°C in a test cell and the input signal and sensing of the scattering was started.
- the delay time required for the input signal to move to the focal region and the backscattered acoustic energy to move back to the transducer was 41.5 microseconds + 0.5 microseconds/division x 5 divisions.
- the backscattered signal received by the transducer was gated to the focal region and transformed by the oscilloscope by using a Fast Fourier Transform from a time domain to a frequency domain.
- the FFT transformed signal was averaged over 435 sweeps and the magnitude of the resulting averaged transformed signal was plotted versus frequency.
- a peak was seen which had a maximum magnitude at about 10 - 12 MHz. This peak was identified as being the "speckle peak". It is believed that the peak is the image in the frequency domain of the acoustic transducer output.
- This example illustrates the calculation of particle size as a function of the duration of an acoustic speckle by the use of two diffusion models.
- the first model is a simple calculation, but provides a less accurate value than the second model.
- the physical constants for asphaltene particles in crude oil were estimated and used for the computation for both models.
- the second model is used to show the dependence of the calculated particle size on the viscosity of the fluid.
- the table below is in three parts.
- the first section of the table shows the effect of variation in the viscosity of the fluid on the particle size calculation.
- the second section of the table shows the dependence of the duration of an acoustic speckle on particle size at a single value of viscosity.
- the third part of the table shows the calculation of particle size as a function of the duration of an acoustic speckle by a diffusion model.
Landscapes
- Physics & Mathematics (AREA)
- Chemical & Material Sciences (AREA)
- Engineering & Computer Science (AREA)
- General Physics & Mathematics (AREA)
- Pathology (AREA)
- Biochemistry (AREA)
- General Health & Medical Sciences (AREA)
- Life Sciences & Earth Sciences (AREA)
- Immunology (AREA)
- Health & Medical Sciences (AREA)
- Analytical Chemistry (AREA)
- Radar, Positioning & Navigation (AREA)
- Acoustics & Sound (AREA)
- Remote Sensing (AREA)
- Signal Processing (AREA)
- Spectroscopy & Molecular Physics (AREA)
- Mathematical Physics (AREA)
- Computer Networks & Wireless Communication (AREA)
- Dispersion Chemistry (AREA)
- Investigating Or Analyzing Materials By The Use Of Ultrasonic Waves (AREA)
- Application Of Or Painting With Fluid Materials (AREA)
- Investigating Or Analysing Materials By Optical Means (AREA)
Applications Claiming Priority (2)
| Application Number | Priority Date | Filing Date | Title |
|---|---|---|---|
| US416325 | 1999-10-12 | ||
| US09/416,325 US6481268B1 (en) | 1999-10-12 | 1999-10-12 | Particle measurement by acoustic speckle |
Publications (2)
| Publication Number | Publication Date |
|---|---|
| EP1092976A2 true EP1092976A2 (de) | 2001-04-18 |
| EP1092976A3 EP1092976A3 (de) | 2002-07-31 |
Family
ID=23649508
Family Applications (1)
| Application Number | Title | Priority Date | Filing Date |
|---|---|---|---|
| EP00308886A Withdrawn EP1092976A3 (de) | 1999-10-12 | 2000-10-09 | Teilchenmessung durch akustischen sprenkeln |
Country Status (3)
| Country | Link |
|---|---|
| US (5) | US6481268B1 (de) |
| EP (1) | EP1092976A3 (de) |
| NO (1) | NO318857B1 (de) |
Cited By (7)
| Publication number | Priority date | Publication date | Assignee | Title |
|---|---|---|---|---|
| NL1020714C2 (nl) * | 2002-05-30 | 2003-12-02 | Tno | Ultrasone karakterisatie van hoge concentratie deeltjes. |
| US6786096B2 (en) | 2001-11-28 | 2004-09-07 | Battelle Memorial Institute | System and technique for detecting the presence of foreign material |
| US6992771B2 (en) | 2001-11-28 | 2006-01-31 | Battelle Memorial Institute | Systems and techniques for detecting the presence of foreign material |
| GB2479450A (en) * | 2010-04-07 | 2011-10-12 | David Wood | Measurement of drill fluid particle size distribution |
| WO2014068498A1 (en) | 2012-10-30 | 2014-05-08 | Chimec S.P.A. | A method for monitoring operative conditions of thermal and/or catalytic cracking plants and related apparatus |
| RU2516200C2 (ru) * | 2012-06-15 | 2014-05-20 | Федеральное государственное бюджетное образовательное учреждение высшего профессионального образования "Южно-Российский государственный университет экономики и сервиса" (ФГБОУ ВПО "ЮРГУЭС") | Устройство анализа загрязненности моторного масла двигателя внутреннего сгорания дисперсными частицами |
| RU2750566C1 (ru) * | 2021-01-14 | 2021-06-29 | Федеральное государственное бюджетное образовательное учреждение высшего образования "Пензенский государственный университет" | Устройстводля определения степени загрязненности моторных масел методом ультразвукового интерферометра |
Families Citing this family (58)
| Publication number | Priority date | Publication date | Assignee | Title |
|---|---|---|---|---|
| US5969237A (en) * | 1997-10-09 | 1999-10-19 | Baker Hughes Incorporated | Measurement and control of asphaltene agglomeration in hydrocarbon Liquids |
| US6481268B1 (en) * | 1999-10-12 | 2002-11-19 | Baker Hughes, Inc. | Particle measurement by acoustic speckle |
| WO2002050511A2 (en) * | 2000-12-18 | 2002-06-27 | E.I. Du Pont De Nemours And Company | Method and apparatus for ultrasonic sizing of particles in suspensions |
| DE10224294A1 (de) * | 2002-05-31 | 2004-01-15 | systec Controls Meß- und Regeltechnik GmbH | Verfahren zur Ultraschall-Laufzeit-Mengenmessung |
| US7047809B2 (en) * | 2003-01-21 | 2006-05-23 | Applied Sonics, Incorporated | Ultrasonic monitor of material composition and particle size |
| US7114375B2 (en) * | 2004-01-13 | 2006-10-03 | Battelle Memorial Institute | Process monitoring and particle characterization with ultrasonic backscattering |
| US6968740B2 (en) * | 2004-01-26 | 2005-11-29 | Johns Manville International Inc. | Systems and methods for determining an acoustic and/or thermal characteristic of a target material |
| JP3917601B2 (ja) * | 2004-04-14 | 2007-05-23 | 株式会社東芝 | 薬液の認定方法および半導体装置の製造方法 |
| GB0410533D0 (en) * | 2004-05-12 | 2004-06-16 | Univ Heriot Watt | Method for identification of nucleation |
| US20060027015A1 (en) * | 2004-07-23 | 2006-02-09 | Tavlarides Lawrence L | Method and apparatus for estimating solids concentration in slurries |
| WO2006055449A2 (en) * | 2004-11-15 | 2006-05-26 | Massachusetts Institute Of Technology | System and method for ultrasonic measuring concentration of particle properties |
| DE202004021624U1 (de) * | 2004-11-24 | 2009-08-06 | Lifebridge Medizintechnik Ag | Vorrichtung zur Bereitstellung eines extrakorporalen Blutkreislaufs |
| US7614302B2 (en) * | 2005-08-01 | 2009-11-10 | Baker Hughes Incorporated | Acoustic fluid analysis method |
| US7983456B2 (en) * | 2005-09-23 | 2011-07-19 | Siemens Medical Solutions Usa, Inc. | Speckle adaptive medical image processing |
| US7891235B2 (en) * | 2005-11-14 | 2011-02-22 | Predect Ab | Method for monitoring water quality |
| US8834399B2 (en) | 2010-12-07 | 2014-09-16 | Zoll Lifebridge Gmbh | Cardiopulmonary apparatus and methods for preserving organ viability |
| US7484414B2 (en) * | 2005-11-30 | 2009-02-03 | Nanoalert Ltd. | Method and apparatus for determination of the concentration of particles in multi-component fluid systems |
| US7739911B2 (en) * | 2006-09-15 | 2010-06-22 | Battelle Memorial Institute | Ultrasonic characterization of solid liquid suspensions |
| US8187214B2 (en) | 2006-10-30 | 2012-05-29 | Lifebridge Medizintechnik Ag | Apparatus for making extracorporeal blood circulation available |
| US7673526B2 (en) * | 2006-11-01 | 2010-03-09 | Expro Meters, Inc. | Apparatus and method of lensing an ultrasonic beam for an ultrasonic flow meter |
| US7661293B2 (en) * | 2007-02-06 | 2010-02-16 | Cosense, Inc. | Ultrasonic system for detecting and quantifying of air bubbles/particles in a flowing liquid |
| US8631683B2 (en) * | 2007-02-06 | 2014-01-21 | Fresenius Medical Care Holdings, Inc. | Dialysis systems including non-invasive multi-function sensor systems |
| DE102007014519A1 (de) * | 2007-03-27 | 2008-10-02 | Fraunhofer-Gesellschaft zur Förderung der angewandten Forschung e.V. | Photoakustischer Detektor zur Messung von Feinstaub |
| RU2346261C1 (ru) * | 2007-07-09 | 2009-02-10 | Государственное образовательное учреждение высшего профессионального образования "Алтайский государственный технический университет им. И.И. Ползунова" (АлтГТУ) | Способ определения параметров дисперсных частиц |
| JP5212224B2 (ja) * | 2009-03-31 | 2013-06-19 | トヨタ自動車株式会社 | 粒径分布モデル作成方法、当該粒径分布モデル作成方法を用いた燃料電池触媒の劣化予測方法、及び当該燃料電池触媒の劣化予測方法を用いた燃料電池の制御方法 |
| US8942928B2 (en) * | 2009-05-11 | 2015-01-27 | The University Of Western Ontario | Ultrasonic method of monitoring particle size distribution of a medium |
| DE102009046159A1 (de) | 2009-10-29 | 2011-05-05 | Endress + Hauser Flowtec Ag | Ultraschall-Durchfluss- und Partikelmesssystem |
| DE102010031129A1 (de) | 2010-07-08 | 2012-01-12 | Endress + Hauser Flowtec Ag | Ultraschall-Partikelmesssystem |
| DE102010031128A1 (de) | 2010-07-08 | 2012-01-12 | Endress + Hauser Flowtec Ag | Ultraschall-Partikelmesssystem |
| EP2612143A4 (de) * | 2010-09-03 | 2017-01-18 | Los Alamos National Security LLC | Vorrichtung und verfahren für nichtinvasive partikeldetektion mithilfe einer dopplerspektroskopie |
| US8882693B2 (en) * | 2010-12-07 | 2014-11-11 | Zoll Lifebridge Gmbh | Cardiopulmonary apparatus and methods for preserving life |
| CN107335104A (zh) | 2010-12-07 | 2017-11-10 | 措尔生命桥梁有限责任公司 | 使过滤器逐步注满的用于体外血液治疗的装置的填充和排气的方法及系统 |
| US8353870B2 (en) | 2011-04-26 | 2013-01-15 | Fresenius Medical Care Holdings, Inc. | Medical temperature sensors and related systems and methods |
| US8836519B2 (en) | 2011-05-12 | 2014-09-16 | Fresenius Medical Care Holdings, Inc. | Determining the absence or presence of fluid in a dialysis system |
| US9333286B2 (en) | 2011-05-12 | 2016-05-10 | Fresenius Medical Care Holdings, Inc. | Medical tubing installation detection |
| US11110648B2 (en) | 2012-07-31 | 2021-09-07 | Makerbot Industries, Llc | Build material switching |
| US9873921B2 (en) | 2012-10-22 | 2018-01-23 | Qiagen Gaithersburg, Inc. | Ultrasonic biological sample analysis apparatus and methods |
| US9435718B2 (en) | 2012-10-22 | 2016-09-06 | Qiagen Gaithersburg, Inc. | Automated pelletized sample decanting apparatus and methods |
| USD735881S1 (en) | 2012-10-22 | 2015-08-04 | Qiagen Gaithersburg, Inc. | Tube strip holder for automated processing systems |
| US9260763B2 (en) | 2012-10-22 | 2016-02-16 | Qiagen Gaithersburg, Inc. | Sample processing method using tube strips and tube strip holder |
| US9180461B2 (en) | 2012-10-22 | 2015-11-10 | Qiagen Gaithersburg, Inc. | Condensation-reducing incubation cover |
| US9310281B2 (en) | 2012-10-22 | 2016-04-12 | Qiagen Gaithersburg, Inc. | Automated pelletized sample blotting apparatus and methods |
| US9135515B2 (en) | 2012-10-22 | 2015-09-15 | Qiagen Gaithersburg, Inc. | Automated pelletized sample vision inspection apparatus and methods |
| US9459194B2 (en) | 2013-03-14 | 2016-10-04 | Cardio Metrix | Apparatuses, processes, and systems for measuring particle size distribution and concentration |
| US9212976B2 (en) | 2013-03-15 | 2015-12-15 | Qiagen Gaithersburg, Inc. | Vision-guided aspiration apparatus and methods |
| US9527240B2 (en) | 2013-03-15 | 2016-12-27 | Stratasys, Inc. | Additive manufacturing system and method for printing three-dimensional parts using velocimetry |
| AU2014272737B2 (en) * | 2013-05-31 | 2017-12-07 | Société des Produits Nestlé S.A. | Systems and methods for detecting water/product interfaces during food processing |
| WO2016210246A2 (en) * | 2015-06-24 | 2016-12-29 | Massachusetts Institute Of Technology | Ultrasound image-based concentration measurement |
| DE102015116376A1 (de) | 2015-09-28 | 2017-03-30 | TIPCO Tudeshki Industrial Process Control GmbH | Verfahren zum Bestimmen der Korngrößenverteilung von Granulaten in einen Förderstrom und Messeinrichtung |
| DE102015116379A1 (de) | 2015-09-28 | 2017-03-30 | TIPCO Tudeshki Industrial Process Control GmbH | Verfahren zum Bestimmen der Korngrößenverteilung von Granulaten in einen Förderstrom und Vorrichtung zur Durchführung des Verfahrens |
| US10280714B2 (en) | 2015-11-19 | 2019-05-07 | Ecolab Usa Inc. | Solid chemicals injection system for oil field applications |
| AR112058A1 (es) | 2017-05-23 | 2019-09-18 | Ecolab Usa Inc | Sistema de inyección para administración controlada de sustancias químicas sólidas de campos petrolíferos |
| AR111953A1 (es) | 2017-05-23 | 2019-09-04 | Ecolab Usa Inc | Patín de dilución y sistema de inyección para sustancias químicas sólidas / líquidas de alta viscosidad |
| WO2020243055A2 (en) * | 2019-05-26 | 2020-12-03 | Oceaneering International, Inc. | System for detecting flooding in flexible tubular pipes under high pressure conditions |
| US11592424B2 (en) * | 2019-08-28 | 2023-02-28 | Oceaneering International, Inc. | System for detecting flooding in flexible tubular pipes under high pressure conditions |
| US11327158B1 (en) * | 2020-10-19 | 2022-05-10 | Aeva, Inc. | Techniques to compensate for mirror Doppler spreading in coherent LiDAR systems using matched filtering |
| JP7453136B2 (ja) * | 2020-12-25 | 2024-03-19 | 株式会社日立製作所 | 異常検出装置、異常検出方法及び異常検出システム |
| US20250020566A1 (en) * | 2023-07-12 | 2025-01-16 | Ovivo Inc. | Acoustic Particle Counter for Nanoparticles in Liquids |
Family Cites Families (28)
| Publication number | Priority date | Publication date | Assignee | Title |
|---|---|---|---|---|
| US4283953A (en) * | 1978-10-30 | 1981-08-18 | Schlumberger Technology Corporation | Method and apparatus for determining a granularity property of a subsurface formation around a borehole |
| US4412451A (en) | 1980-05-21 | 1983-11-01 | Outokumpu Oy | Method and apparatus for the determination of the average particle size in a slurry |
| US4561019A (en) | 1983-05-16 | 1985-12-24 | Riverside Research Institute | Frequency diversity for image enhancement |
| US4509360A (en) | 1983-06-24 | 1985-04-09 | Massachusetts Institute Of Technology | On-line measurement of fluid mixtures |
| DE3438798C2 (de) | 1984-10-23 | 1987-01-02 | Löffler, Friedrich, Prof. Dr.-Ing., 7500 Karlsruhe | Verfahren und Vorrichtung zum Messen der Feststoffkonzentration und der Korngrößenverteilung in einer Suspension mittels Ultraschall |
| US4771470A (en) | 1985-11-14 | 1988-09-13 | University Of Florida | Noise reduction method and apparatus for medical ultrasound |
| US5090412A (en) | 1987-08-31 | 1992-02-25 | Yokogawa Medical Systems, Limited | Ultrasonic diagnosis apparatus |
| US5040734A (en) * | 1987-09-22 | 1991-08-20 | The British Petroleum Company P.L.C. | Method for determining physical properties |
| US4788520A (en) | 1987-09-24 | 1988-11-29 | Honeywell Inc. | Ratchet means switch operator |
| JPH01236041A (ja) | 1987-11-30 | 1989-09-20 | Aloka Co Ltd | 超音波スペックル速度計測方法及び装置 |
| EP0321717B1 (de) | 1987-11-30 | 1995-07-05 | Aloka Co. Ltd. | Verfahren und Anordnung zur Ultraschall-Messung der Strömungsgeschwindigkeit |
| US5121629A (en) | 1989-11-13 | 1992-06-16 | E. I. Du Pont De Nemours And Company | Method and apparatus for determining particle size distribution and concentration in a suspension using ultrasonics |
| US5212667A (en) | 1992-02-03 | 1993-05-18 | General Electric Company | Light imaging in a scattering medium, using ultrasonic probing and speckle image differencing |
| WO1994004907A1 (en) | 1992-08-17 | 1994-03-03 | Commonwealth Scientific And Industrial Research Organisation | A method and apparatus for determining the particle size distribution, the solids content and the solute concentration of a suspension of solids in a solution bearing a solute |
| JPH0746045B2 (ja) | 1992-09-09 | 1995-05-17 | 工業技術院長 | スペックル干渉法変形測定方法 |
| US5524636A (en) | 1992-12-21 | 1996-06-11 | Artann Corporation Dba Artann Laboratories | Method and apparatus for elasticity imaging |
| US5339815A (en) | 1992-12-22 | 1994-08-23 | Cornell Research Foundation, Inc. | Methods and apparatus for analyzing an ultrasonic image of an animal or carcass |
| JPH0774560A (ja) | 1993-04-28 | 1995-03-17 | Night Technol Internatl | 音響システム用利得/等化回路 |
| EP0834063B1 (de) * | 1995-06-19 | 2005-10-26 | Commonwealth Scientific And Industrial Research Organisation | Bestimmung der teilchengrössenverteilung in einer flüssigkeit |
| US5734754A (en) | 1996-02-23 | 1998-03-31 | University Of Rochester | System for model-based compression of speckle images |
| US5748311A (en) | 1996-03-11 | 1998-05-05 | Hamann; Oliver | Apparatus and method of particle geometry measurement by speckle pattern analysis |
| NL1003595C2 (nl) | 1996-04-10 | 1997-10-14 | Tno | Werkwijze en inrichting voor het karakteriseren van suspensies. |
| SE509447C2 (sv) * | 1997-05-13 | 1999-01-25 | Stellan Ahlin | Utrustning för undersökning av partiklar i lösa material |
| US5969237A (en) | 1997-10-09 | 1999-10-19 | Baker Hughes Incorporated | Measurement and control of asphaltene agglomeration in hydrocarbon Liquids |
| US6231516B1 (en) * | 1997-10-14 | 2001-05-15 | Vacusense, Inc. | Endoluminal implant with therapeutic and diagnostic capability |
| US6109098A (en) * | 1998-06-30 | 2000-08-29 | Doukhin Dispersion Technology, Inc. | Particle size distribution and zeta potential using acoustic and electroacoustic spectroscopy |
| US6119510A (en) * | 1998-08-31 | 2000-09-19 | Lucent Technologies Inc. | Process for determining characteristics of suspended particles |
| US6481268B1 (en) * | 1999-10-12 | 2002-11-19 | Baker Hughes, Inc. | Particle measurement by acoustic speckle |
-
1999
- 1999-10-12 US US09/416,325 patent/US6481268B1/en not_active Expired - Fee Related
-
2000
- 2000-10-06 NO NO20005026A patent/NO318857B1/no not_active IP Right Cessation
- 2000-10-09 EP EP00308886A patent/EP1092976A3/de not_active Withdrawn
-
2002
- 2002-10-29 US US10/282,425 patent/US6698276B2/en not_active Expired - Fee Related
- 2002-10-29 US US10/282,626 patent/US6748815B2/en not_active Expired - Fee Related
- 2002-10-29 US US10/282,636 patent/US6698277B2/en not_active Expired - Fee Related
-
2003
- 2003-04-24 US US10/422,098 patent/US6796195B2/en not_active Expired - Fee Related
Cited By (10)
| Publication number | Priority date | Publication date | Assignee | Title |
|---|---|---|---|---|
| US6786096B2 (en) | 2001-11-28 | 2004-09-07 | Battelle Memorial Institute | System and technique for detecting the presence of foreign material |
| US6992771B2 (en) | 2001-11-28 | 2006-01-31 | Battelle Memorial Institute | Systems and techniques for detecting the presence of foreign material |
| US7363817B2 (en) | 2001-11-28 | 2008-04-29 | Battelle Memorial Institute | System and technique for detecting the presence of foreign material |
| NL1020714C2 (nl) * | 2002-05-30 | 2003-12-02 | Tno | Ultrasone karakterisatie van hoge concentratie deeltjes. |
| WO2003102550A1 (en) | 2002-05-30 | 2003-12-11 | Nederlandse Organisatie Voor Toegepast- Natuurwetenschappelijk Onderzoek Tno | Ultrasonic characterization of high concentration particles |
| NO338715B1 (no) * | 2002-05-30 | 2016-10-03 | Tno | Fremgangsmåte for karakterisering av en suspensjon |
| GB2479450A (en) * | 2010-04-07 | 2011-10-12 | David Wood | Measurement of drill fluid particle size distribution |
| RU2516200C2 (ru) * | 2012-06-15 | 2014-05-20 | Федеральное государственное бюджетное образовательное учреждение высшего профессионального образования "Южно-Российский государственный университет экономики и сервиса" (ФГБОУ ВПО "ЮРГУЭС") | Устройство анализа загрязненности моторного масла двигателя внутреннего сгорания дисперсными частицами |
| WO2014068498A1 (en) | 2012-10-30 | 2014-05-08 | Chimec S.P.A. | A method for monitoring operative conditions of thermal and/or catalytic cracking plants and related apparatus |
| RU2750566C1 (ru) * | 2021-01-14 | 2021-06-29 | Федеральное государственное бюджетное образовательное учреждение высшего образования "Пензенский государственный университет" | Устройстводля определения степени загрязненности моторных масел методом ультразвукового интерферометра |
Also Published As
| Publication number | Publication date |
|---|---|
| US20030084734A1 (en) | 2003-05-08 |
| US20030070474A1 (en) | 2003-04-17 |
| US20040065160A1 (en) | 2004-04-08 |
| US6481268B1 (en) | 2002-11-19 |
| US20030061868A1 (en) | 2003-04-03 |
| US6698277B2 (en) | 2004-03-02 |
| US6748815B2 (en) | 2004-06-15 |
| NO20005026D0 (no) | 2000-10-06 |
| EP1092976A3 (de) | 2002-07-31 |
| NO318857B1 (no) | 2005-05-18 |
| NO20005026L (no) | 2001-04-17 |
| US6698276B2 (en) | 2004-03-02 |
| US6796195B2 (en) | 2004-09-28 |
Similar Documents
| Publication | Publication Date | Title |
|---|---|---|
| US6481268B1 (en) | Particle measurement by acoustic speckle | |
| EP1021710B1 (de) | Messung und kontrolle von asphaltene-agglomerationen in kohlenwasserstoff-flüssigkeiten | |
| US7984642B2 (en) | System and method for ultrasonic measuring of particle properties | |
| US7331233B2 (en) | Method and apparatus for ultrasonic sizing of particles in suspensions | |
| Jacobs et al. | Effect of aggregate size on attenuation of Rayleigh surface waves in cement-based materials | |
| JP6910083B2 (ja) | 超音波粒子径測定器及び超音波測定装置 | |
| Kitao et al. | Nanoparticle sizing by focused-beam dynamic ultrasound scattering method | |
| Palanchon et al. | New technique for emboli detection and discrimination based on nonlinear characteristics of gas bubbles | |
| Spiekhout et al. | Time-resolved absolute radius estimation of vibrating contrast microbubbles using an acoustical camera | |
| JP2001343366A (ja) | 金属薄板の結晶粒測定方法及び装置 | |
| Chen et al. | Measurement of solid in liquid content using ultrasound attenuation | |
| Hurther et al. | Multistatic acoustic Doppler profilers for fine-scale studies of velocity and particle flux processes | |
| Yamada et al. | 1P1-7 Dynamics of Microparticles in Suspension Induced by Ultrasonic Irradiation | |
| Niederdränk | Correlations of backscattered ultrasound from scattering suspensions in turbulent flow | |
| Wöckel et al. | Monitoring of highly concentrated suspensions by ultrasonic scattering | |
| Horvat et al. | Laser ultrasonics for bubbly flow detection | |
| Wirdelius et al. | Validation of models for Laser Ultrasonic spectra as a function of the grain size in steel | |
| Dib et al. | PVT Degradation Studies: Acoustic Diagnostics | |
| Bigelow et al. | Scatterer size estimation using a generalized ultrasound attenuation-compensation function to correct for focusing | |
| Hollman et al. | Receiver operating characteristic analysis of phase-sensitive and phase-insensitive ultrasonic detection in specimens with rough surfaces |
Legal Events
| Date | Code | Title | Description |
|---|---|---|---|
| PUAI | Public reference made under article 153(3) epc to a published international application that has entered the european phase |
Free format text: ORIGINAL CODE: 0009012 |
|
| AK | Designated contracting states |
Kind code of ref document: A2 Designated state(s): AT BE CH CY DE DK ES FI FR GB GR IE IT LI LU MC NL PT SE |
|
| AX | Request for extension of the european patent |
Free format text: AL;LT;LV;MK;RO;SI |
|
| PUAL | Search report despatched |
Free format text: ORIGINAL CODE: 0009013 |
|
| AK | Designated contracting states |
Kind code of ref document: A3 Designated state(s): AT BE CH CY DE DK ES FI FR GB GR IE IT LI LU MC NL PT SE |
|
| AX | Request for extension of the european patent |
Free format text: AL;LT;LV;MK;RO;SI |
|
| RIC1 | Information provided on ipc code assigned before grant |
Free format text: 7G 01N 29/02 A, 7G 01N 15/02 B, 7G 01N 33/28 B |
|
| 17P | Request for examination filed |
Effective date: 20030109 |
|
| AKX | Designation fees paid |
Designated state(s): AT BE CH CY DE DK ES FI FR GB GR IE IT LI LU MC NL PT SE |
|
| 17Q | First examination report despatched |
Effective date: 20041027 |
|
| 17Q | First examination report despatched |
Effective date: 20041027 |
|
| STAA | Information on the status of an ep patent application or granted ep patent |
Free format text: STATUS: THE APPLICATION IS DEEMED TO BE WITHDRAWN |
|
| 18D | Application deemed to be withdrawn |
Effective date: 20120131 |