EP1139251A2 - System und Verfahren zum Optimieren von Wertketten - Google Patents
System und Verfahren zum Optimieren von Wertketten Download PDFInfo
- Publication number
- EP1139251A2 EP1139251A2 EP01105484A EP01105484A EP1139251A2 EP 1139251 A2 EP1139251 A2 EP 1139251A2 EP 01105484 A EP01105484 A EP 01105484A EP 01105484 A EP01105484 A EP 01105484A EP 1139251 A2 EP1139251 A2 EP 1139251A2
- Authority
- EP
- European Patent Office
- Prior art keywords
- business
- participants
- depictions
- displaying
- graphical
- Prior art date
- Legal status (The legal status is an assumption and is not a legal conclusion. Google has not performed a legal analysis and makes no representation as to the accuracy of the status listed.)
- Withdrawn
Links
Images




Classifications
-
- G—PHYSICS
- G06—COMPUTING OR CALCULATING; COUNTING
- G06Q—INFORMATION AND COMMUNICATION TECHNOLOGY [ICT] SPECIALLY ADAPTED FOR ADMINISTRATIVE, COMMERCIAL, FINANCIAL, MANAGERIAL OR SUPERVISORY PURPOSES; SYSTEMS OR METHODS SPECIALLY ADAPTED FOR ADMINISTRATIVE, COMMERCIAL, FINANCIAL, MANAGERIAL OR SUPERVISORY PURPOSES, NOT OTHERWISE PROVIDED FOR
- G06Q10/00—Administration; Management
- G06Q10/06—Resources, workflows, human or project management; Enterprise or organisation planning; Enterprise or organisation modelling
-
- G—PHYSICS
- G06—COMPUTING OR CALCULATING; COUNTING
- G06Q—INFORMATION AND COMMUNICATION TECHNOLOGY [ICT] SPECIALLY ADAPTED FOR ADMINISTRATIVE, COMMERCIAL, FINANCIAL, MANAGERIAL OR SUPERVISORY PURPOSES; SYSTEMS OR METHODS SPECIALLY ADAPTED FOR ADMINISTRATIVE, COMMERCIAL, FINANCIAL, MANAGERIAL OR SUPERVISORY PURPOSES, NOT OTHERWISE PROVIDED FOR
- G06Q10/00—Administration; Management
- G06Q10/04—Forecasting or optimisation specially adapted for administrative or management purposes, e.g. linear programming or "cutting stock problem"
-
- G—PHYSICS
- G06—COMPUTING OR CALCULATING; COUNTING
- G06Q—INFORMATION AND COMMUNICATION TECHNOLOGY [ICT] SPECIALLY ADAPTED FOR ADMINISTRATIVE, COMMERCIAL, FINANCIAL, MANAGERIAL OR SUPERVISORY PURPOSES; SYSTEMS OR METHODS SPECIALLY ADAPTED FOR ADMINISTRATIVE, COMMERCIAL, FINANCIAL, MANAGERIAL OR SUPERVISORY PURPOSES, NOT OTHERWISE PROVIDED FOR
- G06Q10/00—Administration; Management
- G06Q10/06—Resources, workflows, human or project management; Enterprise or organisation planning; Enterprise or organisation modelling
- G06Q10/063—Operations research, analysis or management
Definitions
- This invention relates generally to data processing systems and, more particularly, to value chain optimization in business scenarios.
- E-commerce Electronic commerce, or "e-commerce,” is the term often used to refer to providing goods and services to consumers and/or other businesses using the Internet. E-commerce is a unique opportunity for businesses of any size and can expand a business's marketplace.
- Business modeling may include creating a set of “navigational maps” that help businesses expand into and/or "engineer” a new area.
- the models may be a set of tools, or charts corresponding to various business scenarios and business processes (e.g., organizational charts, workflows, tasks, hierarchy charts, entity relationship models, and process matrixes).
- Value chains are chains of value-added events starting from a beginning of the making of an end-product (or service) through the completion of the making of the end-product. Thus, a value chain describes the creation process from raw material until the final product.
- EPCs are also an integral part in visualizing business processes and scenarios. EPCs link data, tasks, and organizations in various business processes. EPCs depict processes and activities throughout an enterprise as linear flow charts to help the enterprise refine their business. An EPC consists of events (e.g., an order is received), functions (e.g., check order), linking operators that connect events and functions, and a process path that represents logical connections between processes within a business scenario.
- events e.g., an order is received
- functions e.g., check order
- linking operators that connect events and functions
- a process path that represents logical connections between processes within a business scenario.
- systems and methods consistent with the present invention create collaboration between members of an e-community within a Collaborative Business Scenario (CBS).
- CBS Collaborative Business Scenario
- the CBS combines one enterprise with various business participants from multiple industries contributing to the same value chain to maximize the value potential for the participants involved in the collaboration.
- the CBS also provides tools to conceive and discuss new collaborative business models within various e-communities.
- the CBS may encompass electronic marketplaces, consumers, and multiple enterprises.
- Claim 1 describes a method for composing a business application system from business application components with first, second and third views each having graphical depictions that cover areas corresponding to business participants. This has, among other things, the advantage of relating business interactions to participants in the order of consecutive execution. Further embodiments are specified in dependent claims.
- Claim 2 refers to a user request, claims 3-4 refer to the form of the depictions, claim 5-8 refer to action that can optionally be started from the application system.
- Claims 9-13 relate to a method of value chain optimization; and claims 14-16 relate to computer program product, medium and computer system to implement the methods.
- An e-community is a virtual community pursuing a common business goal using electronic commerce.
- Collaboration is in creating value-generating business processes that extend beyond the boundaries of one enterprise. That is, collaboration combines one enterprise with various business participants from multiple industries.
- a CBS is several participants in different enterprises working on a common goal linking different activities (e.g., collaborative planning, vendor-managed inventory). To achieve the goal, enterprises share information and define responsibilities for specific activities. As such, the CBS may span several enterprise systems.
- CBSs provide a tool to analyze, plan, and optimize value chains for an enterprise within a given industry.
- the CBS may perform value chain optimizations for not only one enterprise but also for other business participants beyond the confines of one enterprise.
- CBSs may involve engineering project collaboration with engineering suppliers, collaborative planning with distributors, or collaborative forecasting and replenishment with service station retailers.
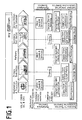
- FIG. 1 depicts an exemplary oil and gas five-step value chain and various CBSs for the oil and gas value chain.
- the value chain starts with exploration & production of oil and ends with providing the oil at a service station, as indicated in FIG. 1.
- the CBSs may consist of categories, such as business-to-business scenarios, customer interaction scenarios, or marketplace scenarios.
- the participants are enterprises; in the marketplace scenario, multiple enterprises cooperate at a single marketplace; and in the customer interaction scenario, a single customer is served by multiple enterprises.
- a CBS can be used in a variety of industries or business communities.
- the CBS consists of various entities, such as participants (e.g., importers, suppliers OEMs, manufacturers, distributors, vendors, sellers, end-customers, insurance companies, publishing companies, service companies, paper manufacturer), activities (e.g., order tracking, receipt processing, production, search requests), information sharing (e.g., business documents, status reports, purchase orders), document flow features (e.g.
- roles e.g., employee roles such as a strategic purchaser
- business benefits e.g., improved buying power, reduced delivery times, cost advantages, increased customer satisfaction
- value potential e.g., 50% increase
- type of CBS e.g., Business to Business Scenario, mySAP.com Marketplace Scenario, Customer Interaction Scenario
- SAP Solution Map the relationship to an SAP Solution Map
- Each participant in a CBS acts according to a specific role (e.g., an employee that purchases goods is a purchaser), and each activity contains functionality and relates to a participant's role.
- CBSs also contain business documents, information flow, and systems landscapes (e.g., roles of the systems, software components, software releases, information to exchange between each system, and functions to process exchanged information within a system).
- Various aspects of CBSs are also described below.
- the CBS enables a top-down approach to optimize value chain between enterprises. This allows the inter-company processes as well as cross-industry processes to be described.
- the CBS also provides an intuitive graphical design illustrating various collaborative aspects.
- the various illustrations although directly derived from one another, cover separate aspects, offer complementary information (e.g., business view, interaction view, component view), and define business benefits for various participants. Moreover, the illustrations explain the contribution of each participant of inter-company collaboration to value creation.
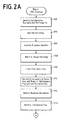
- FIGS. 2A and 2B are a flow diagram representing the steps performed by a method consistent with the present invention when creating a CBS. Some aspects of the following method will vary depending on the nature of the activities of the business being evaluated. The following example describes an organization whose principal activity is the manufacture and development of vehicle sales.
- Information for the CBS may be obtained from various sources, such as industry, business, or value chain expertise, knowledge on value-added activities of each of the participants involved, knowledge on the individual information needs of each role in the entire business scenario, knowledge of employee roles, data modeling expertise, knowledge of the industry business blueprints and Solution Maps (described below), business application expertise (e.g., SAP Financials), implementation expertise, identification of value potentials by realizing collaborative business opportunities that result in tangible business benefits, industry knowledge anticipating the quantifiable business benefits, and/or independent studies (e.g., Harvard Business Review, Goldman Sachs, Management consulting Firms).
- sources such as industry, business, or value chain expertise, knowledge on value-added activities of each of the participants involved, knowledge on the individual information needs of each role in the entire business scenario, knowledge of employee roles, data modeling expertise, knowledge of the industry business blueprints and Solution Maps (described below), business application expertise (e.g., SAP Financials), implementation expertise, identification of value potentials by realizing collaborative business opportunities that result in tangible business benefits, industry knowledge anticipating the
- the types of participants identified will dictate the type of CBS to use. For example, if the participants are employees of different enterprises (e.g., OEM, importer, dealer), the type of CBS is a "Business to Business Scenario" CBS.
- the type of CBS is a "mySAP.com Marketplace Scenario.”
- the parties are multiple enterprises working together to supply information to a set of customers, then the CBS is a "Customer Interaction Scenario.”
- activities performed by the participants to achieve a common business goal are identified (step 204)
- business benefits are identified (step 206)
- value potentials for the business benefits are identified (step 208).
- a business view is created (step 210).
- Business views depict the interaction between participants, activities, business benefits, and/or value potentials.
- FIG. 3 depicts an exemplary business view 300 in accordance with the present invention.
- Business view 300 which is a graphical depiction of interlocking polygons (e.g., hexagons), enables the integration of common business purposes, and the ability to anticipate business benefits while implementing the CBS. Also, business view 300 provides value potential in terms of quantifiable business benefits (e.g., reduced delivery time by up to 75%) that allow return-on-investment (ROI) calculations to be formulated.
- quantifiable business benefits e.g., reduced delivery time by up to 75%) that allow return-on-investment (ROI) calculations to be formulated.
- View 300 illustrates collaboration between various participants involved (e.g., OEM, importer, and dealer), types of CBS present, collaborative aspects between the participants, scope of the business collaboration, impact on the business and the value chain, anticipated business benefits, and quantifiable value potential.
- participants involved e.g., OEM, importer, and dealer
- types of CBS present e.g., collaborative aspects between the participants, scope of the business collaboration, impact on the business and the value chain, anticipated business benefits, and quantifiable value potential.
- Business view 300 comprises participants 302, activities 304, business benefits 306, value potentials 308, and zipper button 310. Participants 302 are depicted in vertical lanes 321, 322 and 322 signified in different colors. Activities 304 illustrate the sequence and scope using interlocking hexagon-shaped boxes similar to a zipper. Zipper button 310 links business view 300 to interaction view 400 (described below). In other words, when the user presses button 310, the display changes from business view to interaction view.
- Business benefits 306 consist of qualitative business benefits (e.g., improved market intelligence) and quantitative/ quantifiable business benefits with so-called value potentials 308 (e.g., reduced delivery times by up to 75%).
- business view 300 a functionality of each activity 304 and roles of participants that perform those activities 304 are identified (step 212 in Fig. 2), various business documents are identified (step 214), and information flow between participants 302 is identified (step 216).
- a role of an employee may be as a strategic purchaser, and the functionality may be to create vehicles pools, or search for new vehicles.
- Business documents are documents exchanged between activities 304.
- information flow relates to information movement between activities 304.
- an interaction view is created (step 218). For convenience, the further explanation distinguishes participants by added reference numbers 1-3.
- FIG. 4A depicts an exemplary interaction view 400 in accordance with the present invention.
- Interaction view 400 is derived directly from business view 300 and includes additional information, identified in steps 212, 214, and 216, regarding the elements of collaborative interaction between the participants. That is, interaction view 400 contains additional elements detailing how information is exchanged, thereby helping to understand the CBS. Also, interaction view 400 depicts the dependency of participants involved in common business purposes, links to the personalized roles and features included in the collaboration.
- Information sharing relates to having multiple participants view the same information so information is not duplicated.
- document flow refers to sending a document from one participant to another. Thereby the document is copied for the other participant. This is different from “information sharing", where a document stays at is original location without being copied.
- Interaction view 400 depicts a sequence of collaborative activities between all participants, roles of the participants in the collaboration, detailed features for each of the collaborative activities, information shared between participants, business documents, and interfaces between the participants. Thereby illustrating the interdependency of the participants in the CBS. Similar to business view 300, interaction view 400 contains participants 402, and activities 404. Lines between activities 404 depict the flow of information and/or exchange of business documents (e.g., sales orders) between participants 402. Double triangles on each line are coded (e.g., shaded) based on the sending participant 402.
- business documents e.g., sales orders
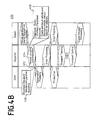
- FIG. 4B depicts a second exemplary interaction view 450 in accordance with the present invention.
- Interaction view 450 depicts various "call-outs" 456, 458 displayed when a user selects an activity 454 or a coded triangle.
- call-out 456 depicts a vehicle configuration business document related to triangle 452
- call-out 458 depicts the roles of a participant 302 related to the features of activity 454.
- a button may link interaction view 400 to component view 500 (described below).
- system requirements needed to implement the CBS are identified (step 220 in Fig. 2).
- system requirements may be systems needed to be installed to implement the CBS, system landscapes, roles of the systems, software components, software releases, information to exchange between each system, and functions to process exchanged information within a system.
- a component view is created (step 222).
- FIG. 5 depicts an exemplary component view 500 in accordance with the present invention.
- Component view 500 offers a further drill-down view (e.g., technical view) of the CBS and its implementation in an installed systems landscape.
- the system landscape depicts the different activities of a CBS implemented in all Information Technology (IT) systems.
- IT Information Technology
- component view 500 depicts the availability of IT systems and specific activities of software components in a CBS.
- Component view 500 provides an exploded view of the concrete system topology in place at each participant's location.
- a concrete system topology includes the connections between various depicted systems (e.g., connecting a participant's location to another participant's location).
- Component view 500 graphically depicts the overall design of the system landscape, including identification of centralized and distributed systems, individual software components, and current releases.
- Component view 500 also provides information relating to each system needed to be installed to implement the CBS. For example, a centralized system is the main office of the participant, whereas the distributed system is any additional site (e.g., warehouse, plant site).
- Component view 500 depicts a CBS at the centralized site as well as the distributed site.
- a particular industry and corresponding Solution Maps for that industry are identified (step 224 in Fig. 2).
- a Solution Map is a tool used to analyze strategies and activities for specified industries and preferably depicts a wide range of solutions for various activities.
- a Solution Map may be linked to the activity (step 226).
- Solution Maps relating to the automotive industry may apply to a vehicle sales CBS.
- a link may be created to that automotive Solution Map from the corresponding activity.
- FIG. 6 depicts an exemplary Solution Map for use in a manner consistent with the present invention, the solution map illustrating business application component of a business application system.
- an exemplary automotive Solution Map that may be linked to a vehicle sales CBS is depicted in FIG. 6.
- Solution Map 600 contains links 602 to various activities 304 in views 300, 400, 450.
- Graphical depictions to business application components are illustrated by symbols S1, S2 and the like, collectively referred to as "S”.
- components S2, S110, S32 and S20 are applications for the interaction "forecast planning".
- FIG. 7 is a block diagram that illustrates a computer system 700 upon which embodiments of the invention may be implemented.
- Computer system 700 includes a bus 702 or other communication mechanism for communicating information, and a processor 704 coupled with bus 702 for processing information.
- Computer system 700 also includes a memory 706, which can be a random access memory (RAM) or other dynamic storage device, coupled to bus 702 for creating business views, interaction views, and component views, and instructions to be executed by processor 704.
- Memory 706 also may be used for storing temporary variables or other intermediate information during execution of instructions to be executed by processor 704.
- Computer system 700 further includes a read only memory (ROM) 708 or other static storage device coupled to bus 702 for storing static information and instructions for processor 704.
- ROM read only memory
- a storage device 710 such as a magnetic disk or optical disk, is provided and coupled to bus 702 for storing information and instructions.
- Computer system 700 may be coupled via bus 702 to a display 712, such as a cathode ray tube (CRT) or liquid crystal display (LCD), for displaying information to a computer user.
- a display 712 such as a cathode ray tube (CRT) or liquid crystal display (LCD)
- An input device 714 is coupled to bus 702 for communicating information and command selections to processor 704.
- cursor control 716 is Another type of user input device, such as a mouse, a trackball or cursor direction keys for communicating direction information and command selections to processor 704 and for controlling cursor movement on display 712.
- This input device typically has two degrees of freedom in two axes, a first axis (e.g., x) and a second axis (e.g., y), that allows the device to specify positions in a plane.
- views 300 and 400 are created when processor 704 (cf. FIG. 7) accesses a database (in storage device 710, cf. FIG. 7) by a database engine and provides the graphical depictions by java applets.
- the database can be a commercially available database such as Microsoft Access 2000.
- Computer system 700 optimizes value chains. Consistent with one implementation of the invention, a graphical depiction of the collaboration of participants is provided by computer system 700 in response to processor 704 executing one or more sequences of one or more instructions contained in memory 706.
- Such instructions may be read into memory 706 from another computer-readable medium, such as storage device 710. Execution of the sequences of instructions contained in memory 706 causes processor 704 to perform the process states described herein. Alternatively hard-wired circuitry may be used in place of or in combination with software instructions to implement the invention. Thus implementations of the invention are not limited to any specific combination of hardware circuitry and software.
- Non-volatile media includes, for example, optical or magnetic disks, such as storage device 710.
- Volatile media includes dynamic memory, such as memory 706.
- Transmission media includes coaxial cables, copper wire, and fiber optics, including the wires that comprise bus 702. Transmission media can also take the form of acoustic or light waves, such as those generated during radiowave and infra-red data communications.
- Computer-readable media include, for example, a floppy disk, a flexible disk, hard disk, magnetic tape, or any other magnetic medium, a CD-ROM, any other optical medium, punch cards, papertape, any other physical medium with patterns of holes, a RAM, PROM, and EPROM, a FLASH-EPROM, any other memory chip or cartridge, a carrier wave as described hereinafter, or any other medium from which a computer can read.
- Various forms of computer readable media may be involved in carrying one or more sequences of one or more instructions to processor 704 for execution.
- the instructions may initially be carried on magnetic disk of a remote computer.
- the remote computer can load the instructions into its dynamic memory and send the instructions over a telephone line using a modem.
- a modem local to computer system 700 can receive the data on the telephone line and use an infra-red transmitter to convert the data to an infra-red signal.
- An infra-red detector coupled to bus 702 can receive the data carried in the infra-red signal and place the data on bus 702.
- Bus 702 carries the data to memory 706, from which processor 704 retrieves and executes the instructions.
- the instructions received by memory 706 may optionally be stored on storage device 710 either before or after execution by processor 704.
- Systems and methods consistent with the present invention create collaboration between members of an e-community within a CBS.
- the CBS combines one enterprise with various business partners from multiple industries to maximize the value potential for the participants involved in the collaboration.
- the CBS also provides tools to conceive and discuss new collaborative business models within various e-communities.
- the CBS may encompass electronic marketplaces and consumers.
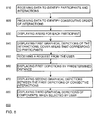
- FIG. 8 illustrates a simplified method flow chart diagram of method 800 for composing business application system 600 (cf. FIG. 6) from business application components S (cf. FIG. 6).
- the components (S) support a plurality of business interactions (cf. FIG. 3, 304-1 ...
- participant 302-1 is an OEM partner
- participant 302-2 is an importer
- participant 302-3 is a dealer.
- the business interactions are executed in a predefined consecutive order, for example, from interaction 304-1 to interaction 304-9.
- First depictions 304 indicate the consecutive order, in views 300 and 400 with vertically top down order. Consecutive interactions 304-n and 304-(n+1) are displayed by adjacent depictions (in view 300 only). For example, depictions 304-1 and 304-2 share one side of the hexagon.
- Method 800 comprises the following steps: receiving 810 data that identify participants 302 and interactions 304; receiving 820 data that identify consecutive order 304-1 to 304-9; in first view 300 (cf. FIG. 300, "business view”), displaying 830 areas for each participant 302-1, 302-2, and 302-3; in first view 300, displaying 840 first graphical depictions 304 of the interactions, wherein first depictions 304 cover areas 321-323 (i.e. lanes) that correspond to participants, and wherein adjacent first depictions (304-n, 304-(n+1) "interlocked") indicate the consecutive order; in second view 400 (cf. FIG.
- interaction view displacing 860 first depictions 304, wherein first depictions 304 still cover areas 321-323 that correspond to participants, and wherein first graphical depictions (i.e. that were previously adjacent) are displayed with a predetermined distance (cf. FIG. 4); displaying 870 second graphical depictions 452 (cf. FIG. 4AB) between first depictions 304 of consecutive interactions, second depictions 452 symbolizing data that qualifies the consecutive interactions; and in third view 600, when selected by a user, displaying 880 third graphical depictions (S) of the components that implement the interactions.
- step displacing 860 first depictions 304 is performed upon receiving 850 a request from the user to alter first view 400, for example when the user operates zipper button 310.
- first depictions 304 and second depictions 452 are polygons, such as hexagons 304 (FIG. 3) and triangles 452 (FIG. 4), respectively.
- step displaying 880 third depictions (S)
- graphical depictions (S) with hyperlinks to interactions are displayed.
- depictions (S) are displayed only for available components.
- receiving steps 810 and 820 are performed in connection with steps 202 and 204 (FIG. 2A).
- Interactions are illustrated, for example, in FIG. 3 as interaction 304-1 ("vehicle specific search request via internet") between participants 302-2 and 302-3; interaction 304-2 ("vehicle locating and allocation") of participant 302-2; interaction 304-3 ("reservation planning") between participants 302-1 and 302-2 and so on.
- the consecutive order is predefined by the business.
- action 304-1 (“vehicle specific search") is prior to action 304-5 (“production”).
- FIG. 3 illustrates the areas by vertical lanes 321, 322, and 323.
- Step displaying 840 is performed, preferably, in view 400 as illustrated in FIG. 3.
- Reference numbers (304-1 ... 304-9) are the same for interactions and first graphical depictions.
- the first graphical depictions 304 cover lanes 321-323, depending on the participants. For example, corresponding to the data received in steps 810 and 820, one half of depiction 304-1 (for interaction 304-1) covers lane 322 and the other half covers lane 323. It is an advantage that view 300 concentrates on participants, interactions and order only, and that view 300 does not distract the user from further information.
- the user operates zipper button 310 and in step 840. Now, the user expresses his or her desire to see more.
- first graphical depictions 304 are displaced.
- Depictions 304 are still arranged (i) to cover areas 321-322 that correspond to the participants and (ii) to indicate the consecutive order. Consecutive interactions are however displayed by distant depictions. Displacing has the advantage that original order as well as the participant-to-interaction relation remain unchanged.
- second depictions 452 contrast to first depictions 304 by being smaller.
- the present invention allows to guide the user directly to the third graphical depictions (e.g., S) of the components that implement the interactions. It is a further advantage that optionally only these components are depicted that are available.
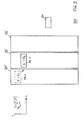
- FIG. 9 illustrates a simplified diagram of view 300' to describe further embodiments (1), (2) and (3) of the present invention.
- View 300' stands for any of views 300-700 illustrated above.
- Lanes 321', 322', and 323' correspond to the areas for each participant.
- FIG. 9 illustrate this past, present and future time aspect by a simplified time diagram of business value Y. It is further possible to preliminary store scenarios for different values Y at different times so that the user can replay the history of the scenario optimization.
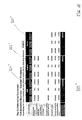
- FIG. 10 illustrates simplified collaboration scorecard 300'' (spread sheet) that summarizes the business parameters in a still further embodiment (4). The value potential for each of the participants has been calculated and is now display for each participant in lanes 321'', 322'' and 323''. A column on the left-hand side indicates the business benefits, e.g., reduced operating cost. The user can fill in the current cost base (i.e.
- method 800 further comprises to receive instructions to alter any of the first, second, and third views from first and second user, wherein the second user is a remote user.
- a method of displaying a value chain optimization in a collaborative business scenario comprises the steps (executed in a data processing system) of: displaying a first view 300 consisting of a plurality of interlocking polygons 304, wherein the polygons corresponding to each participant 302 are vertically aligned; business benefits of each activity are shown in vertical arrangement too.
- Displaying the second view 400 consists of participants of the collaborative business scenario in vertical lanes 321-323; activities of the participants depicted as interlocking polygons; and information flow between the participants illustrated as lines linking the interlocking polygons; and connectors connecting a line and an activity illustrating a direction of document exchange.
- Displaying a third view consisting of a system topology at a particular participant's site
- a method for creating a collaboration between participants in a business scenario comprising the steps, executed in a data processing system, of: identifying a collaborative business, participants in the collaborative business, and activities of the participants; identifying functionality of the activities; identifying system requirements used to implement the collaborative business; identifying quantitative and qualitative business benefits based on a collaboration between participants; identifying an industry and corresponding solution maps relating to the collaborative business; and creating a collaboration based on information obtained in the identifying steps.
- the participants are consumers, enterprises, and/or electronic marketplaces.
- a system for displaying collaboration between participants in a business community comprises: first rendering means 300 for rendering a first graphical depiction 304 of a sequence of interactions between the participants; and second rendering means 400 for rendering second graphical depiction 452, derived from the first graphical depiction, containing information flow.
- Third rendering means 600 for rendering a third graphical depiction (S) depicts an implementation of the first and second graphical depiction in a physical system.
- the first rendering means renders the interactions depicted as interlocking polygons.
- the first rendering means further comprises aligning means for vertically aligning representations of interactions involving one of the participants.
- the first rendering means further comprises aligning means for vertically aligning representations of the business benefits, wherein the business benefits correspond to at least one participant.
- the first rendering means further comprises aligning means for vertically aligning representations of quantifiable business benefits, wherein the quantifiable business benefits provide a basis for ROI calculations.
- the system comprises producing means for producing a link from the first graphical depiction to the second graphical depiction.
- the second rendering means further renders additional information regarding interdependency of the participants in the second graphical depiction.
- the second rendering means further renders a sequence of activities.
- the second rendering means further renders information sharing between participants.
- the second rendering means further renders roles in the collaboration.
- the second rendering means further renders features in the collaboration.
- the third rendering means further renders a system topology used by a participant.
- the third rendering means further renders distributed and centralized systems.
- a computer readable medium for controlling a data processing system to perform a method for displaying collaboration between participants in a business community executed in a data processing system comprises: a rendering module for rendering a first graphical depiction of a sequence of interactions between the participants; and a second rendering module for rendering a second graphical depiction, derived from the first graphical depiction, containing information flow.
- the computer readable medium further comprises: a third rendering module for rendering a third graphical depiction depicting an implementation of the first and second graphical depiction in a physical system.
- the rendering module includes a representing module for representing a plurality of interactions depicted as interlocking polygons.
- the second rendering module includes a representation module for vertically aligning representations of interactions involving one of the participants.
- the rendering module includes a representation module for vertically aligning representations of the business benefits, wherein the business benefits correspond to at least one participant.
- the rendering module includes a representation module for vertically aligning representations of quantifiable business benefits, wherein the quantifiable business benefits provide a basis for ROI calculations.
- the medium further includes a producing module for producing a link from the first graphical depiction to the second graphical depiction.
- the second rendering module includes a providing module for providing additional information regarding interdependency of the participants.
- the second rendering module includes a depicting module for depicting a sequence of activities.
- the second rendering module includes a depicting module for depicting information sharing between participants.
- the second rendering module includes a depicting module for depicting roles in the collaboration.
- the second rendering module includes a depicting module for depicting features in the collaboration.
- the third rendering module includes a depicting module for depicting a system topology used by a participant.
- the third rendering module includes a depicting module for depicting distributed and centralized systems.
- the third graphical depiction is derived from the second graphical depiction and contains additional information regarding the collaboration between participants.
- a computer readable medium for controlling a data processing system to perform a method for displaying a value chain optimization in a collaborative business scenario executed in a data processing system comprises: a displaying module for displaying a first view consisting of a plurality of interlocking polygons, wherein the polygons corresponding to each participant being vertically aligned and the activities of the participants; business benefits of each activity being shown in a vertical arrangement.
- the computer readable medium further comprises: a displaying module for displaying a second view consisting of participants of the collaborative business scenario in vertical lanes; activities of the participants depicted illustrated as interlocking polygons; and information flow between the participants illustrated as lines linking the interlocking polygons; and connectors connecting a line and an activity illustrating a direction of document exchange.
- the medium of further includes a displaying module for displaying a third view consisting of a system topology at a particular participant's site.
Landscapes
- Business, Economics & Management (AREA)
- Engineering & Computer Science (AREA)
- Human Resources & Organizations (AREA)
- Strategic Management (AREA)
- Economics (AREA)
- Entrepreneurship & Innovation (AREA)
- Marketing (AREA)
- Game Theory and Decision Science (AREA)
- Development Economics (AREA)
- Operations Research (AREA)
- Quality & Reliability (AREA)
- Tourism & Hospitality (AREA)
- Physics & Mathematics (AREA)
- General Business, Economics & Management (AREA)
- General Physics & Mathematics (AREA)
- Theoretical Computer Science (AREA)
- Educational Administration (AREA)
- User Interface Of Digital Computer (AREA)
- Management, Administration, Business Operations System, And Electronic Commerce (AREA)
Priority Applications (4)
| Application Number | Priority Date | Filing Date | Title |
|---|---|---|---|
| CA002404081A CA2404081A1 (en) | 2000-03-23 | 2001-03-23 | Value chain optimization system and method |
| AU2001247686A AU2001247686B2 (en) | 2000-03-23 | 2001-03-23 | Value chain optimization system and method |
| AU4768601A AU4768601A (en) | 2000-03-23 | 2001-03-23 | Value chain optimization system and method |
| US09/987,356 US7206751B2 (en) | 2000-03-23 | 2001-11-14 | Value chain optimization system and method |
Applications Claiming Priority (4)
| Application Number | Priority Date | Filing Date | Title |
|---|---|---|---|
| US19145200P | 2000-03-23 | 2000-03-23 | |
| US191452P | 2000-03-23 | ||
| US609714 | 2000-06-30 | ||
| US09/609,714 US7280973B1 (en) | 2000-03-23 | 2000-06-30 | Value chain optimization system and method |
Publications (2)
| Publication Number | Publication Date |
|---|---|
| EP1139251A2 true EP1139251A2 (de) | 2001-10-04 |
| EP1139251A3 EP1139251A3 (de) | 2001-10-10 |
Family
ID=26887057
Family Applications (1)
| Application Number | Title | Priority Date | Filing Date |
|---|---|---|---|
| EP01105484A Withdrawn EP1139251A3 (de) | 2000-03-23 | 2001-03-14 | System und Verfahren zum Optimieren von Wertketten |
Country Status (4)
| Country | Link |
|---|---|
| US (1) | US7280973B1 (de) |
| EP (1) | EP1139251A3 (de) |
| AU (2) | AU2001247686B2 (de) |
| CA (1) | CA2404081A1 (de) |
Families Citing this family (24)
| Publication number | Priority date | Publication date | Assignee | Title |
|---|---|---|---|---|
| US7921023B2 (en) * | 2001-12-28 | 2011-04-05 | Sap Aktiengesellschaft | Portal for implementation of multiple software components |
| US20030187718A1 (en) * | 2002-03-29 | 2003-10-02 | Stefan Hack | Industry information analysis tool |
| US20030187675A1 (en) * | 2002-03-29 | 2003-10-02 | Stefan Hack | Business process valuation tool |
| US20050021348A1 (en) * | 2002-07-19 | 2005-01-27 | Claribel Chan | Business solution management (BSM) |
| US7958037B2 (en) * | 2005-03-23 | 2011-06-07 | Hewlett-Packard Development Company, L.P. | Method and apparatus for product selection |
| US20070038627A1 (en) * | 2005-08-12 | 2007-02-15 | Cohn David L | System and method for using a component business model to manage an enterprise |
| US20090018879A1 (en) * | 2007-07-13 | 2009-01-15 | David Bernard Flaxer | Method and system supporting business solution validation in a component business model |
| US20090055242A1 (en) * | 2007-08-24 | 2009-02-26 | Gaurav Rewari | Content identification and classification apparatus, systems, and methods |
| US20090055368A1 (en) * | 2007-08-24 | 2009-02-26 | Gaurav Rewari | Content classification and extraction apparatus, systems, and methods |
| US7991659B2 (en) * | 2008-02-11 | 2011-08-02 | International Business Machines Corporation | Accounting data retrieval method and system |
| US9405513B2 (en) * | 2008-04-18 | 2016-08-02 | Software Ag | Systems and methods for graphically developing rules for transforming models between description notations |
| US9760634B1 (en) | 2010-03-23 | 2017-09-12 | Firstrain, Inc. | Models for classifying documents |
| US8463789B1 (en) | 2010-03-23 | 2013-06-11 | Firstrain, Inc. | Event detection |
| US10546311B1 (en) | 2010-03-23 | 2020-01-28 | Aurea Software, Inc. | Identifying competitors of companies |
| US10643227B1 (en) | 2010-03-23 | 2020-05-05 | Aurea Software, Inc. | Business lines |
| US8782042B1 (en) | 2011-10-14 | 2014-07-15 | Firstrain, Inc. | Method and system for identifying entities |
| US9052907B2 (en) | 2011-10-25 | 2015-06-09 | Software Ag | Selective change propagation techniques for supporting partial roundtrips in model-to-model transformations |
| US9064220B2 (en) * | 2011-12-14 | 2015-06-23 | Sap Se | Linear visualization for overview, status display, and navigation along business scenario instances |
| US20130268855A1 (en) * | 2012-04-10 | 2013-10-10 | John O'Byrne | Examining an execution of a business process |
| US9292505B1 (en) | 2012-06-12 | 2016-03-22 | Firstrain, Inc. | Graphical user interface for recurring searches |
| US10592480B1 (en) | 2012-12-30 | 2020-03-17 | Aurea Software, Inc. | Affinity scoring |
| US20170344933A1 (en) * | 2016-05-27 | 2017-11-30 | Caterpillar Inc. | Method and system for managing supply chain with variable resolution |
| CN112561312B (zh) * | 2020-12-14 | 2022-11-15 | 国网河南省电力公司电力科学研究院 | 一种基于电能质量因素的配电网线损计算方法及系统 |
| CN117892867A (zh) * | 2023-12-29 | 2024-04-16 | 广州市景翔信息科技有限公司 | 一种企业管理流程智能优化处理方法 |
Family Cites Families (16)
| Publication number | Priority date | Publication date | Assignee | Title |
|---|---|---|---|---|
| US4813013A (en) * | 1984-03-01 | 1989-03-14 | The Cadware Group, Ltd. | Schematic diagram generating system using library of general purpose interactively selectable graphic primitives to create special applications icons |
| US4674042A (en) | 1985-04-02 | 1987-06-16 | International Business Machines Corp. | Editing business charts |
| US5630069A (en) * | 1993-01-15 | 1997-05-13 | Action Technologies, Inc. | Method and apparatus for creating workflow maps of business processes |
| EP0696775A1 (de) * | 1993-04-21 | 1996-02-14 | Hitachi, Ltd. | Rechnergestütztes Entwurfs- und Anfertigungssystem für Bauteilanordnung und Rohrverlegungsplanung |
| US5621871A (en) * | 1994-08-31 | 1997-04-15 | Jaremko; Mark | Automated system and method for annotation using callouts |
| JPH08190587A (ja) * | 1995-01-06 | 1996-07-23 | Hitachi Ltd | 業務プロセスのシミュレーションシステム |
| EP0770967A3 (de) * | 1995-10-26 | 1998-12-30 | Koninklijke Philips Electronics N.V. | System zur Entscheidungsunterstützung für das Management einer flinken Versorgungskette |
| US5884287A (en) | 1996-04-12 | 1999-03-16 | Lfg, Inc. | System and method for generating and displaying risk and return in an investment portfolio |
| US6460058B2 (en) * | 1996-12-06 | 2002-10-01 | Microsoft Corporation | Object-oriented framework for hyperlink navigation |
| JPH11316780A (ja) * | 1998-05-06 | 1999-11-16 | Hitachi Ltd | 階層化されたビジネスプロセス定義を有するワークフローシステム |
| US6119149A (en) | 1998-06-05 | 2000-09-12 | I2 Technologies, Inc. | System and process allowing collaboration within and between enterprises for optimal decision making |
| US6243101B1 (en) * | 1998-09-03 | 2001-06-05 | Timothy Joseph Erskine | Method of enhancing computer-generated symbols |
| US6233493B1 (en) * | 1998-09-16 | 2001-05-15 | I2 Technologies, Inc. | Computer-implemented product development planning method |
| AU3109200A (en) * | 1998-12-04 | 2000-06-26 | Technology Enabling Company, Llc | Systems and methods for organizing data |
| US6393425B1 (en) * | 1999-05-05 | 2002-05-21 | Microsoft Corporation | Diagramming real-world models based on the integration of a database, such as models of a computer network |
| AU2001247984A1 (en) * | 2000-02-16 | 2001-08-27 | Bea Systems Inc. | Workflow integration system for enterprise wide electronic collaboration |
-
2000
- 2000-06-30 US US09/609,714 patent/US7280973B1/en not_active Expired - Lifetime
-
2001
- 2001-03-14 EP EP01105484A patent/EP1139251A3/de not_active Withdrawn
- 2001-03-23 AU AU2001247686A patent/AU2001247686B2/en not_active Ceased
- 2001-03-23 AU AU4768601A patent/AU4768601A/xx active Pending
- 2001-03-23 CA CA002404081A patent/CA2404081A1/en not_active Abandoned
Non-Patent Citations (1)
| Title |
|---|
| No Search * |
Also Published As
| Publication number | Publication date |
|---|---|
| CA2404081A1 (en) | 2001-09-27 |
| EP1139251A3 (de) | 2001-10-10 |
| AU2001247686B2 (en) | 2004-12-16 |
| AU4768601A (en) | 2001-10-03 |
| US7280973B1 (en) | 2007-10-09 |
Similar Documents
| Publication | Publication Date | Title |
|---|---|---|
| US7206751B2 (en) | Value chain optimization system and method | |
| AU2001247686B2 (en) | Value chain optimization system and method | |
| AU2001247686A1 (en) | Value chain optimization system and method | |
| Guimaraes et al. | Empirically assessing the impact of BPR on manufacturing firms | |
| US7069230B2 (en) | Enhanced method and system for providing supply chain execution processes in an outsourced manufacturing environment | |
| US6067525A (en) | Integrated computerized sales force automation system | |
| Sahay et al. | Development of software selection criteria for supply chain solutions | |
| US20020087382A1 (en) | Method and system for assigning and tracking tasks, such as under an electronic auction | |
| US20100169229A1 (en) | Business Processing System Using Remote PC Control System of Both Direction | |
| US20030229526A1 (en) | Computer-implemented system and method for assessing supply chain solutions | |
| US20060080326A1 (en) | Method for reengineering of business processes | |
| US8954342B2 (en) | Publishing an industry business architecture model | |
| Schnellbächer et al. | Jumpstart to Digital Procurement | |
| JP2003114916A (ja) | 通信ネットワークを通じて好適部品計画を実現するための方法およびシステム | |
| Agrawal et al. | Matching intermediaries for information goods in the presence of direct search: an examination of switching costs and obsolescence of information | |
| KR20030013742A (ko) | 이벤트와 관계를 이용한 비즈니스 모델 구축 방법과 그적용 시스템 | |
| Buck-Emden et al. | mySAP CRM | |
| Kim | An empirical investigation of the impact of electronic commerce on supply chain management: A study in the healthcare industry | |
| WO2001071629A2 (en) | Value chain optimization system and method | |
| Miller | Building an effective information systems function | |
| Minguela-Rata et al. | Processes integration and e-business in supply chain management | |
| Kunii et al. | Fujitsu’s activities to support digital transformation | |
| Nguyen et al. | A Risk Management Tool for the Reverse Supply Chain Network | |
| WO2002005138A1 (en) | Process guru | |
| Vara Mesa et al. | Ingeniería de Procesos de Negocio (Semipresencial)-Apuntes |
Legal Events
| Date | Code | Title | Description |
|---|---|---|---|
| PUAI | Public reference made under article 153(3) epc to a published international application that has entered the european phase |
Free format text: ORIGINAL CODE: 0009012 |
|
| PUAL | Search report despatched |
Free format text: ORIGINAL CODE: 0009013 |
|
| AK | Designated contracting states |
Kind code of ref document: A2 Designated state(s): AT BE CH CY DE DK ES FI FR GB GR IE IT LI LU MC NL PT SE TR |
|
| AX | Request for extension of the european patent |
Free format text: AL;LT;LV;MK;RO;SI |
|
| AK | Designated contracting states |
Kind code of ref document: A3 Designated state(s): AT BE CH CY DE DK ES FI FR GB GR IE IT LI LU MC NL PT SE TR |
|
| AX | Request for extension of the european patent |
Free format text: AL;LT;LV;MK;RO;SI |
|
| 17P | Request for examination filed |
Effective date: 20011022 |
|
| AKX | Designation fees paid |
Free format text: AT BE CH CY DE DK ES FI FR GB GR IE IT LI LU MC NL PT SE TR |
|
| RAP1 | Party data changed (applicant data changed or rights of an application transferred) |
Owner name: SAP AG |
|
| STAA | Information on the status of an ep patent application or granted ep patent |
Free format text: STATUS: THE APPLICATION IS DEEMED TO BE WITHDRAWN |
|
| 18D | Application deemed to be withdrawn |
Effective date: 20060727 |