EP1158449A2 - Procédé informatique et appareil pour analyser la lecture d'essais d'acides nucléiques - Google Patents
Procédé informatique et appareil pour analyser la lecture d'essais d'acides nucléiques Download PDFInfo
- Publication number
- EP1158449A2 EP1158449A2 EP01110657A EP01110657A EP1158449A2 EP 1158449 A2 EP1158449 A2 EP 1158449A2 EP 01110657 A EP01110657 A EP 01110657A EP 01110657 A EP01110657 A EP 01110657A EP 1158449 A2 EP1158449 A2 EP 1158449A2
- Authority
- EP
- European Patent Office
- Prior art keywords
- sample
- values
- data
- value
- corrected
- Prior art date
- Legal status (The legal status is an assumption and is not a legal conclusion. Google has not performed a legal analysis and makes no representation as to the accuracy of the status listed.)
- Ceased
Links
Images







Classifications
-
- G—PHYSICS
- G01—MEASURING; TESTING
- G01N—INVESTIGATING OR ANALYSING MATERIALS BY DETERMINING THEIR CHEMICAL OR PHYSICAL PROPERTIES
- G01N35/00—Automatic analysis not limited to methods or materials provided for in any single one of groups G01N1/00 - G01N33/00; Handling materials therefor
- G01N35/00584—Control arrangements for automatic analysers
- G01N35/00594—Quality control, including calibration or testing of components of the analyser
- G01N35/00693—Calibration
-
- G—PHYSICS
- G01—MEASURING; TESTING
- G01N—INVESTIGATING OR ANALYSING MATERIALS BY DETERMINING THEIR CHEMICAL OR PHYSICAL PROPERTIES
- G01N21/00—Investigating or analysing materials by the use of optical means, i.e. using sub-millimetre waves, infrared, visible or ultraviolet light
- G01N21/17—Systems in which incident light is modified in accordance with the properties of the material investigated
- G01N21/25—Colour; Spectral properties, i.e. comparison of effect of material on the light at two or more different wavelengths or wavelength bands
- G01N21/251—Colorimeters; Construction thereof
- G01N21/253—Colorimeters; Construction thereof for batch operation, i.e. multisample apparatus
-
- G—PHYSICS
- G01—MEASURING; TESTING
- G01N—INVESTIGATING OR ANALYSING MATERIALS BY DETERMINING THEIR CHEMICAL OR PHYSICAL PROPERTIES
- G01N35/00—Automatic analysis not limited to methods or materials provided for in any single one of groups G01N1/00 - G01N33/00; Handling materials therefor
- G01N35/02—Automatic analysis not limited to methods or materials provided for in any single one of groups G01N1/00 - G01N33/00; Handling materials therefor using a plurality of sample containers moved by a conveyor system past one or more treatment or analysis stations
- G01N35/028—Automatic analysis not limited to methods or materials provided for in any single one of groups G01N1/00 - G01N33/00; Handling materials therefor using a plurality of sample containers moved by a conveyor system past one or more treatment or analysis stations having reaction cells in the form of microtitration plates
Definitions
- the present invention relates generally to a computerized method and apparatus for analyzing sets of readings taken of respective samples in a biological or chemical assay, such as a nucleic acid assay, to determine which samples possess a certain predetermined characteristic. More particularly, the present invention relates to a computerized method and apparatus which graphically plots optical readings of a biological or chemical sample taken at different times during a reading period, corrects for an additive background value present in the readings, and compares the corrected readings to a threshold to detect for the presence of a particular characteristic of the sample, such as the presence of a targeted pathogen in the sample.
- bacterial diseases including sexually transmitted diseases such as gonorrhea (GC) and chlamydia trachomatis (CT)
- GC gonorrhea
- CT chlamydia trachomatis
- a test for the presence of CT or GC, for example, in a sample can be completed within an hour or less using DNA probe technology. This allows treatment to begin more quickly, and avoids the need for long patient isolation times.
- nucleic acid amplification reaction In the use of DNA probes for clinical diagnostic purposes, a nucleic acid amplification reaction is usually carried out in order to multiply the target nucleic acid into many copies or amplicons.
- nucleic acid amplification reactions include strand displacement amplification (SDA) and polymerase chain reaction (PCR). Unlike PCR, SDA is an isothermal process which does not require any external control over the progress of the reaction which causes amplification.
- SDA strand displacement amplification
- PCR polymerase chain reaction
- Detection of the nucleic acid amplicons can be carried out in several ways, all involving hybridization (binding) between the target DNA and specific probes. Many common DNA probe detection methods involve the use of fluorescein dyes. One known detection method is fluorescein energy transfer.
- a detector probe is labeled both with a fluorescein dye that emits light when excited by an outside source, and with a quencher which suppresses the emission of light from the flourescein dye in its native state.
- the fluourescein-labled probe binds to the amplicons, is extended, and allows fluorescent emission to occur. The increase of fluorescence is taken as an indication that the disease-causing bacterium is present in the patient sample.
- an X-Y plate scanning apparatus such as the CytoFluor Series 4000 made by PerSeptive Biosystems, is capable of scanning a plurality of fluid samples stored in an array of microwells.
- the apparatus includes a scanning head for emitting light towards a particular sample, and for detecting light generated from that sample.
- the optical head is moved to a suitable position with respect to one of the sample wells.
- a light emitting device is activated to transmit light through the optical head toward the sample well.
- the fluorescent light is received by the scanning head and transmitted to an optical detector.
- the detected light is converted by the optical detector into an electrical signal, the magnitude of which is indicative of the intensity of the detected light.
- This electrical signal is processed by a computer to determine whether the target DNA is present or absent in the fluid sample based on the magnitude of the electrical signal.
- Each well in the microwell tray e.g., 96 microwells total
- a microwell array such as the standard microwell array having 12 columns of eight microwells each (96 microwells total) is placed in a moveable stage which is driven past a scanning bar.
- the scanning bar includes eight light emitting/detecting ports that are spaced from each other at a distance substantially corresponding to the distance at which the microwells in each column are spaced from each other. Hence, an entire column of sample microwells can be read with each movement of the stage.
- the stage is moved back and forth over the light sensing bar, so that a plurality of readings of each sample microwell are taken at desired intervals.
- readings of each microwell are taken at one minute intervals for a period of one hour. Accordingly, 60 readings of each microwell are taken during a well reading period. These readings are then used to determine which samples contain the particular targeted disease or diseases (e.g., CT and/or GC).
- a nucleic acid amplification reaction will cause the target nucleic acid (e.g., CT or GC) to multiply into many amplicons.
- the fluorescein-labeled probe which binds to the amplicons will fluoresce when excited with light.
- the amount of fluorescence correspondingly increases. Accordingly, after a predetermined period of time has elapsed (e.g.
- the magnitude of fluorescence emission from a sample having the targeted disease is much greater then the magnitude of fluorescence emission from a sample not having the targeted disease (a negative sample).
- the magnitude of fluorescence of a negative sample essentially does not change throughout the duration of the test.
- the value of the last reading taken for each sample can be compared with a known threshold value, which has previously been determined. If the sample value is above the threshold value, the sample is identified as a positive sample in which the targeted disease is present. However, if the last value taken of the sample is below the threshold value, the sample is identified as a negative sample free from the disease.
- this "endpoint detection" method can generally be effective in identifying positive and negative samples, it is not uncommon for this method to incorrectly identify a negative sample as being positive or vice versa. That is, the accuracy of the value of any individual sample reading can be adversely effected by factors such as a bubble forming in the sample, obstruction of excitation light and/or fluorescence emission from the sample due to the presence of debris on the optical reader, and so on. Accordingly, if the final reading of a particular sample is erroneous and only that reading is analyzed, the likelihood of obtaining a false positive or false negative result is high.
- the amount of amplicons decreases as the testing progresses. Due to this decrease in amplicons, the magnitude of fluorescent emission from the sample decreases with the passage of time. Accordingly, the magnitude of the last reading taken of the sample can be less than the magnitude of a reading taken at the time when the amount of amplicons present in the sample is at its peak. In some instances, the decrease in amplicons can result in the magnitude of fluorescent emission from the sample being lower then the predetermined threshold value, in which event the positive sample is falsely identified as a negative sample.
- the overall change in the magnitudes of sample readings is calculated and compared to a known value having a magnitude indicative of a positive result. Accordingly, if the magnitude of change is greater than the predetermined value, the sample is identified as a positive sample having the targeted disease. On the other hand, if the magnitude of change is less than the predetermined value, the sample is identified as a negative sample.
- acceleration index method measures incremental changes in the sample readings, and compares those changes to a predetermined value.
- An object of the present invention is to provide a method and apparatus for accurately interpreting the values of data obtained from taking readings of a biological or chemical sample, to ascertain the presence of a particular disease in the sample based on the data values.
- Another object of the invention is to provide a method and apparatus, for use with an optical sample well reader, which accurately interprets data representing magnitudes of fluorescence emissions detected from the sample at predetermined periods of time, to ascertain the presence of a particular disease in the sample.
- a further object of the invention is to provide a method and apparatus for analyzing data obtained from reading a biological or chemical sample contained in a sample well, and without using complicated arithmetic computations, correcting for errors in the data which could adversely affect the results of the analysis.
- a computerized method and apparatus for analyzing numerical data pertaining to a sample assay comprising at least one biological or chemical sample, with the data including a set of data pertaining to each respective sample, and each set of data including a plurality of values each representing a condition of the respective sample at a point in time.
- the method and apparatus assigns a respective numerical value to each of the data values, removes an additive background value from each of the data values to produce corrected data values, compares the values to a threshold value to determine when the data values begin to exceed the threshold value, and controls the system to indicate whether the sample has a predetermined characteristic based on a result of the comparison. Additionally, prior to the comparison to the threshold value, filtering, normalizing and other correcting operations can be performed on the data to correct extraneous values in the data which could adversely affect the accuracy of the results.
- the method and apparatus can perform all of the above functions by representing each of the plurality of data values as points on a graph having a vertical axis representing the magnitudes of the values and a horizontal axis representing a period of time during which readings of the sample were taken to obtain said plurality of data values, correcting the data values to eliminate an additive background value present in each of the data values to produce a corrected plot of points on the graph, with each of the points of the corrected plot of points representing a magnitude of a corresponding one of the values.
- the corrected plot of points is compared to a threshold value to determine if and when the points exceed the threshold value, to therefore determine whether a certain condition, such as a pathogen, exists in the sample to which the set of data pertains.
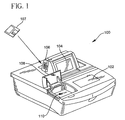
- the apparatus 100 includes a key pad 102, which enables an operator to enter data and thus control operation of the apparatus 100.
- the apparatus 100 further includes a display screen 104, such as an LCD display screen or the like, for displaying "soft keys" which allow the operator to enter data and control operation of the apparatus 100, and for displaying information in response to the operator's commands, as well as data pertaining to the scanning information gathered from the samples in the manner described below.
- the apparatus also includes a disk drive 106 into which can be inserted a floppy disk for storing data generated by the apparatus 100, or from which the apparatus can read data.
- the apparatus 100 further includes as door 108 which allows access to a stage assembly 110 into which can be loaded a sample tray assembly 112.
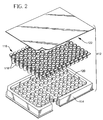
- a sample tray assembly 112 includes a tray 114 into which is loaded a microwell array 116, which can be a standard microwell array having 96 individual microwells 118 arranged in 12 columns of 8 microwells each.
- the tray 114 has openings 120 which pass entirely through the tray and are arranged in 12 columns of eight microwells each, such that each opening 120 accommodates a microwell 118 of microwell array 116.
- a cover 122 can be secured over microwells 118 to retain each fluid sample in its respective microwell 118. Further details of the sample tray assembly 112 and of sample collection techniques are described in the aforementioned U.S. Patent No. 6,043,880.
- Each microwell can include one type of detector probe, as described above, for identifying a particular disease (e.g., GC or CT).
- a particular disease e.g., GC or CT.
- the microwell array 116 is to be used to test for GC and CT in each patient sample
- the microwells 118 are arranged in groups of three microwells each, with one microwell in the group containing a reagent which is used to identify the presence of GC, another microwell in the group a reagent which is used to identify the presence of CT, and the third microwell containing an amplification control reagent AC, the purpose of which is described in more detail below.
- a fluid sample from a particular patient is placed in all three wells of a particular group of wells.
- some (e.g., two) of the 96 microwells 118 in the microwell array 116 can be designated as control sample wells for a particular disease, such as CT, with one of the control sample wells containing a control positive sample and the other control well containing a control negative sample, the purpose of which is described in detail below.
- other (e.g., two other) microwells 118 can be designated as control microwell sample wells for GC, with one of the control microwell sample wells including a positive sample and the other including a negative sample.
- other (e.g., two other) microwells 118 can be designated as control microwell sample wells for AC, with one of the control microwell sample wells including a positive sample and the other including a negative sample.
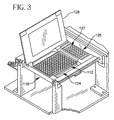
- stage assembly 110 is shown in more detail in Fig. 3. Specifically the stage assembly 110 includes an opening 124 for receiving a sample tray assembly 112.
- stage assembly 110 further includes a plurality of control wells 126 which are used in calibrating and verifying the integrity of the reading components of the well reading apparatus 100.
- control wells 126 is a column of eight normalization wells 127, the purpose of which is described in more detail below.
- the stage assembly 110 further includes a cover 128 which covers the sample tray assembly 112 and control wells 126 when the sample tray assembly 112 has been loaded into the opening 124 and sample reading is to begin. Further details of the stage assembly 110 are described in the above-referenced U.S. Patent No. 6,043,880
- the stage assembly 110 is conveyed past a light sensing bar 130 as shown in Fig. 4.
- the light sensor bar 130 includes a plurality of light emitting/detecting ports 132.
- the light emitting/detecting ports 132 are controlled to emit light towards a column of 8 microwells 118 when the stage assembly 110 positions those microwells 118 over the light emitting/detecting ports, and to detect fluorescent light being emitted from the samples contained in those microwells 118.
- the light sensor bar 130 includes 8 light emitting/detecting ports 132 which are arranged to substantially align with the 8 microwells 118 in a column of the microwell array 116 when that column of microwells 118 is positioned over the light emitting/detecting ports 132.
- the light emitting/detecting ports 132 are coupled by respective fiber optic cables 134 to respective light emitting devices 136, such as LEDs or the like.
- the light emitting/detecting ports 132 are further coupled by respective fiber optic cables 138 to an optical detector 140, such as a photomultiplier tube or the like. Further details of the light sensor bar 130 and related components, as well as the manner in which the stage assembly 110 is conveyed past the light sensor bar 130 for reading the samples contained in the microwells 118, are described in the above-referenced U.S. Patent No. 6,043,880.
- one reading for each microwell is taken at a particular interval in time, and additional readings of each microwell are taken at respective intervals in time for a predetermined duration of time.
- one microwell reading is obtained for each microwell 118 at approximately one minute intervals for a period of one hour.
- One reading of each of the normalization wells 127, as well as one "dark" reading for each of the light emitting/detecting ports 132, are taken at each one minute intervals. Accordingly, 60 microwell readings of each microwell 118, as well as 60 readings of each normalization well 127 and 60 dark readings, are obtained during the one hour period.
- a reading is a measurement of the intensity of the fluorescent emission being generated by a microwell sample in response to excitation light emitted onto the sample. These intensity values are stored in magnitudes of relative fluorescent units (RFU). A reading of a sample having a high magnitude of fluorescent emissions will provide an RFU value much higher then that provided by a reading taken of a sample having low fluorescent emissions.
- RFU relative fluorescent units
- the readings for each sample must be interpreted by the well reading apparatus 100 so the well reading apparatus 100 can indicate whether the sample has tested positive or negative for a particular disease (e.g. CT or GC).
- the microprocessing unit of the well reading apparatus 100 is controlled by software to perform the following operations on the data representing the sample well readings. The operations being described are applied in essentially the same manner to the readings taken for each sample microwell 118. Accordingly, for illustrative purposes, the operations will described with regard to readings taken for one sample microwell 118, which will be referred to as the first sample microwell 118.
- each normalization well 127 has been read 60 times by its respective light emitting/detecting port 132 of the light sensor bar 130, which results in eight sets of 60 normalization well readings.
- the normalization readings of the normalization well 127 that has been read by the light emitting/detecting port 132 which has also read the first sample microwell 118 now being discussed are represented as n 1 through n 60 .
- the optical detector 140 is controlled to obtain a "dark" reading in which a reading is taken without any of the light emitting devices 136 being activated. This allows the optical detector 140 to detect any ambient light that may be present in the system.
- the dark readings are taken for each light emitting/detecting port 132. Accordingly, after 60 readings of every microwell 118 have been obtained, eight sets of 60 dark readings (i.e., one set of 60 dark readings for each of the eight light emitting/detecting portions 132) have been obtained. For illustrative purposes, the dark readings obtained by the light emitting/detecting port 132 which read the first sample microwell 118 now being discussed are represented as d 1 through d 60 .
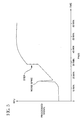
- Fig. 5 is a graph showing the relationship of the 60 readings for one well which have been obtained during the one hour reading period. For illustrative purposes, these readings are represented as r 1 through r 60 . These readings are plotted on the graph of Fig. 5 with their RFU value being represented on the vertical axis with respect to the time in minutes at which the readings were taken during the reading period.
- the RFU values for the readings taken later in the reading period are greater than the RFU values of the readings taken at the beginning of the reading.
- this example shows the trend in readings for a well that contains the particular disease (e.g., CT or GC) for which the well is being tested.
- the graph of the "raw data" readings include a noise spike and a step as shown.
- the process that will now be described eliminates any noise spikes, steps or other apparent abnormalities in the graph which are the result of erroneous readings being taken of the sample well.
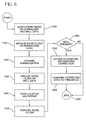
- the flowchart shown in Fig. 6 represents the overall process for interpreting the graph of raw data readings r 1 through r 60 shown in Fig. 5 to provide a well sample result which is used to determine whether the well sample includes the particular target disease for which it is being tested. These processes are performed by the controller (not shown) of the well reading apparatus 100 as controlled by software, which can be stored in a memory (not shown) resident in the well reading apparatus 100, or on a disk inserted into disk drive 106.
- the software initially controls the controller to perform a dark correction on the normalizer data readings n 1 through n 60 and on the well readings r 1 through r 60 .
- the details of this step are shown in the flowchart of Fig. 7 and in Step 1 of the pseudo-code set forth in the attached Appendix.
- Step 1010 the dark reading values d 1 through d 60 are subtracted from the corresponding normalizer reading values n 1 through n 60 , respectively, to provide corrected normalizer readings cn 1 through cn 60 , respectively. That is, dark reading d 1 is subtracted from normalizer reading n 1 to provide corrected normalizer reading cn 1 , dark reading d 2 is subtracted from normalizer reading n 2 to provide corrected normalizer reading cn 2 , and so on.
- Step 1020 the dark readings d 1 through d 60 are subtracted from their corresponding well readings r 1 through r 60 , respectively to provide corrected well readings c 1 through c 60 , respectively. That is, dark well reading d 1 is subtracted from well reading r 1 to provide corrected well reading c 1 , dark reading d 2 is subtracted from well reading r 2 to provide corrected well reading cr 2 , respectively, and so on.
- the first two smoothed normalizer values xn 1 and xn 2 are set equal to the first two corrected normalizer values cn 1 and cn 2 , respectively, while the last two smoothed normalizer values xn 59 and xn 60 are said equal to the last two corrected normalizer values cn 59 and cn 60.
- smoothed normalizer values xn 3 through xn 58 are obtained as an average or midpoint value of their corresponding corrected normalizer values cn 3 through cn 58 , respectively, and surrounding corrected normalizer values.
- smoothed normalizer value xn 3 is set equal to an average or midpoint value of corrected normalizer values cn 1 , cn 2 , cn 3 , cn 4 , and cn 5 .
- smoothed normalizer value xn 4 is set equal to an average or midpoint value of corrected normalizer values cn 2 , cn 3 , cn 4 , cn 5 , and cn 6
- smoothed normalizer values xn 5 through xn 58 are calculated in a similar manner.
- Step 1210 a scalar value is set which is employed in the calculations.
- the scalar value is 3000, but can be any suitable value.
- the processing then proceeds to Step 1220, where the scalar value, corrected well reading values, and smoothed normalize values are used to calculate dynamic normalization values.
- the corresponding corrected well value is multiplied by the scalar value, and then that total is divided by the corresponding smoothed normalizer value.
- nr 1 corrected well reading value cr 1 is multiplied by 3000 (the scalar value), and then that total is divided by the value of smoothed normalizer xn 1 .
- dynamic normalization value nr 2 is calculated by multiplying corrected well reading value cr 2 by 3000, and then dividing that total by smoothed normalizer value xn 2 . This process continues until all 60 dynamic normalization values nr 1 through nr 60 have been obtained.
- Step 1300 The processing then continues to perform the input noise filtering operation on the well data as shown in Step 1300 of the flowchart in Fig. 6.
- the details of this operation are shown in the flowchart of Fig. 10, as well as in Step 4 of the attached pseudo-code.
- Step 1300 a three point running median is applied to the dynamic normalization values nr 1 through nr 60 to obtain smoothed normalized values x 1 through x 60 .
- the first smoothed normalized value x 1 is set equal to the first dynamic normalization value in r 1
- the last smoothed normalized value x 60 is set equal to the last dynamic normalization value in r 60 .
- Step 1320 the smoothed normalized values x 2 through x 59 are obtained. These values are obtained by applying a three point running median to the dynamic normalization values, such that the smoothed normalized values x 2 through x 59 are obtained by calculating an average or midpoint of their corresponding dynamic normalization values nr 2 through nr 59 , respectively, and the surrounding normalization values.
- smoothed normalized value x 2 is obtained by taking the average or midpoint of dynamic normalization values nr 1 , nr 2 , and nr 3 .
- smoothed normalized value x 3 is obtained by taking the average or midpoint of dynamic normalized value nr 2 , nr 3 , and nr 4 .
- Smoothed normalize values x 4 through x 59 are obtained in a similar manner.
- smoothed normalized values x 1 through x 60 have been obtained, a three point running median is applied to those values to obtain smoothed normalized values z 1 through z 60 . That is, in Step 1330, smoothed normalized value z 1 is set equal to smoothed normalized value x 1 , and smoothed normalized value z 60 is set equal to smoothed normalized value x 60 . Then, in Step 1340, smoothed normalized values z 2 through z 59 are obtained by calculating an average or midpoint of their corresponding smoothed normalized value x 2 through x 59 and the surrounding smoothed normalized values.
- smoothed normalized value z 2 is obtained by calculating the average or midpoint of smoothed normalized values x 1 , x 2 , and x 3 .
- smoothed normalized value z 3 is obtained by calculating the average or midpoint of smoothed normalized values x 2 , x 3 , and x 4 .
- Smoothed normalized value z 4 through z 59 are then obtained in a similar manner.
- Steps 1000 through 1300 of the flowchart in Fig. 6 have been performed as described above, the well readings have therefore been smoothened and normalized, and are represented by the smoothed normalized values z 1 through z 50 . Accordingly, as shown in the graph of Fig. 11, when the smoothed normalized values z 1 through z 60 are plotted with respect to a corresponding time periods in which their corresponding well readings have been obtained, the noise spikes in the graph have been eliminated.
- Step 1400 The step removal operation is performed in Step 1400 as shown in the flowchart in Fig. 6. Details of the step removal operation are set forth in the flowchart in Fig. 12, and in Step 5 of the attached pseudo-code.
- Step 1405 in the flowchart of Fig. 12 a count value is set to allow the process to repeat a maximum of five times.
- the process then proceeds to step 1410, where difference values dr 1 through dr 59 are calculated which represent the differences adjacent smoothed normalized value z 1 through z 60 . That is, the first difference value dr 1 is calculated as the value of smoothed normalized value z 2 minus smoothed normalized value z 1 .
- the second difference value dr 2 is calculated as the value of smoothed normalized value z 3 minus smoothed normalized value z 2 . This process is repeated until 59 difference values dr 1 through dr 59 have been obtained.
- Step 1415 in which the difference values dr 1 through dr 59 are added together to provide an average total, which is then divided by 59 to provide a difference average 'dr.
- Step 1420 a variance value var(dr) is calculated.
- This variance value is calculated by subtracting the difference value 'dr from each difference value dr 1 through dr 59 , squaring each subtraction value, and then summing the totals of the squared values. For example, the difference value 'dr is subtracted from the first difference value dr 1 to provide a total, which is then squared. The difference value 'dr is then subtracted from the second difference value dr 2 , and that total is squared. This process continues for all remaining difference values dr 3 through dr 59 . These 59 "squared" totals are then added and divided by 58 to obtain the variance value (dr).
- Step 1425 a sum value "s" is calculated.
- This sum value is calculated by subtracting the difference value 'dr from each of the difference values dr 1 through dr 59 , taking each result to the fourth power to obtain a set of 59 quadrupled results, and then adding all of the 59 quadrupled results. That is, the difference value 'dr is subtracted from the first difference value dr 1 to provide a result. That result is then taken to the fourth power to provide a first quadrupled result. The difference value 'dr is subtracted from second difference value dr 2 , and the result of the subtraction is taken to the fourth power to provide a second quadrupled result. This process is repeated for the remaining difference values dr 3 through dr 59 until all 59 quadrupled results have been calculated. The 59 quadrupled results are then added to provide the sum value "s".
- Step 1430 the processing determines whether the variance value var(dr) is equal to zero. If the value of var(dr) is equal to zero, the processing proceeds to Step 1433, where the count value is incremented by one, and Steps 1410 through 1425 are repeated as discussed above. However, if the value of var(dr) is not equal to zero, then the processing proceeds to Step 1435. In Step 1435, as critical value CRIT_VAL is set equal to 4.9. The processing then proceeds to Step 1440, where it is determined whether the value of sum "s" divided by the total of var(d) squared multiplied by 59 is greater than the value of CRIT_VAL. If the calculated value is not greater than CRIT_VAL, then the step location and repair processing is completed, and the processing continues to the periodic noise filter processing in Step 1500 shown in the flowchart of Fig. 6.
- Step 1445 processing will be performed to determine the location of the step. This is accomplished by subtracting the difference value 'dr from each of the 1 through 59 difference values dr 1 through dr 59 , taking the absolute value of each of those subtraction results, and determining which of the absolute values is the greatest. For example, the processing first subtracts the values 'dr from the first difference value dr 1 , and takes the absolute value of that result. This absolute value is compared with a variable "max", which has initially been set to zero. If the absolute value is greater, the variable max is set to that absolute value, and the variable maxpt_dr is set equal to the number of the difference value, which in this case is 1.
- the processing then subtracts difference value 'dr from the second difference value dr 2 , and takes the absolute value of that subtraction value. The processing determines whether that absolute value is greater than the new "max" value. If the absolute value is greater, then "max" is set to that absolute value, and maxpt_dr is set equal to 2. This process is repeated for all remaining difference values dr 3 through dr 59 . After the process is completed, maxpt_dr will be set equal to the number of the smoothed normalized value at which the step has occurred. As discussed above, in this example, it is presumed that the step occurred at value z 30 . Accordingly, maxpt_dr is set to 30.
- Step 1450 the process then continues to Step 1450 during which the median difference value of the difference values dr 1 through dr 59 is determined.
- Step 1455 the smoothed normalized values occurring after the step are decreased by the difference value calculated for the smoothed normalized value at which the step occurred, and then increased by the median difference value calculated in Step 1450.
- the smoothed normalized values z 31 through z 60 are each decreased by the magnitude of difference dr 30 (the step occurred after the 30 th reading), and then the smoothed normalized values z 31 through z 60 are then each increased by the median difference value calculated in Step 1450.
- this process has the affect of shifting the entire portion of the curve representing the RFU values of z 31 through z 60 downward, thus eliminating the step.
- Step 1460 it is determined whether the entire process has been repeated five times. If the value of count does not equal five, the value of count is increased by one in Step in 1465, and the processing returns to Step 1410 and repeats as discussed above. However, if the value of count is equal to five, the processing proceeds to the periodic noise filter Step 1500 in the flowchart shown in Fig. 6.
- the periodic noise filtering operation 1500 is performed to further filter out erroneous values which may exist in the graph shown in Fig. 13 in which the step has been repaired. Details of the periodic noise filtering operation are shown in the flowchart of Fig. 14 and in Step 6 of the attached pseudo-code.
- a five-point moving average is applied to the read values z 1 through z 60 represented in the graph of Fig. 13 to provide filtered values f 1 through f 60 .
- the first two filter values f 1 and f 2 are set equal to the smoothed normalized values z 1 and z 2 , respectively, and the last two filtered values f 59 and f 60 are set equal to the two smoothed normalized values z 59 and z 60 , respectively.
- the filtered value f 3 through f 58 are determined by taking the average of corresponding smoothed normalized values z 3 through z 58 , respectively and surrounding smoothed normalized values.
- filtered value f 3 is determined by taking the sum of smoothed normalized values z 1 , z 2 , z 3 , z 4 , and z 5 , and dividing that sum by 5.
- Filtered value f 4 is determined by taking the sum of smoothed normalized value z 2 , z 3 , z 4 , z 5 , and z 6 , and dividing that sum by 5. This process is repeated until all remaining filter f 3 through f 58 have been obtained.
- Step 1600 shown in Fig. 6, the processing determines whether the filtered values f 1 through f 60 , which were derived from the above-described steps from the raw data well read values r 1 through r 60 , respectively, were actually taken of a well, or, in other words, whether a well was actually present at that location in the microwell array 116 of the sample tray assembly 112. Details of the well present determination processing are shown in the flowchart of Fig. 15 and in Step 7 of the pseudo-code.
- a well reading average wp avg is determined by adding the filter values f 10 , f 20 , f 30 , f 40 and f 50 , and dividing those values by 5.
- This well present average wp avg is compared to a well threshold value WP_THRES, which in this example is set to 125.0. If, in Step 1620, the processing determines that the well present average wp avg is greater than zero and less than the threshold value WP_THRES, then the processing determines that no well is present and that the data obtained is entirely erroneous. The processing then proceeds to Step 1900 in the flowchart shown in Fig. 6 where processing for that well is concluded. However, if the processing determines in Step 1620 that a well is present, the processing continues to Step 1700 in the flowchart shown in Fig. 6.
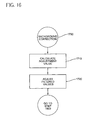
- Step 1700 the processing establishes a base line background correction, in which an average value based on, for example, the first five background values f 1 through f 5 , is calculated. Other ranges of values, such as f 10 through f 15 , may be used, depending on the assay. This average value is then subtracted from all of the filtered values f 1 through f 60 . Additionally, the values used to calculate the average value can each be set to zero after being used to calculate the average value, although this is not required. Further details of this background correction operation is shown in the flowchart of Fig. 16 and in Step 8 of the pseudo-code.
- Step 1710 the filtered values f 1 through f 5 are added to produce a sum value.
- the sum value is then divided by 5 to provide an initial adjustment value IA.
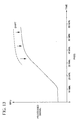
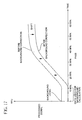
- Step 1720 in which the initial adjustment value IA is subtracted from each of the filter values f 1 through f 60 . If, in performing the subtraction, the filter value becomes less than zero, that filtered value is set to zero. As shown in the graph of Fig. 17, this processing shifts the portion of the graph between filter values f 1 and f 60 down toward the horizontal axis. The processing then proceeds to Step 1800 in the flowchart of Fig. 6 to compare the corrected graph to a threshold value as will now be described.
- the threshold comparison step is described in more detail in the flowchart shown in Fig. 18.
- the corrected graph is compared to a threshold value which has been determined based on past results.
- a threshold value which has been determined based on past results.
- the threshold value is chosen to be a value which will provide the most accurate indication as to the presence or absence of a disease of interest in the sample. This can be accomplished by choosing a threshold value which simultaneously maximizes sensitivity and specificity. In this example, the threshold value is chosen to be "100".
- the processing proceeds to steps 1820 and 1830 as shown in Fig. 18.
- the processing then interpolates to determine where the graph crosses the threshold. That is, as shown in Fig. 19, the value at which the graph crosses the threshold is between two actual reading values. Accordingly, the processing interpolates between the two actual values to calculate a reported value which is a value corresponding to the position on the x-axis (the time axis). For instance, if the graph crosses the threshold between readings 16 and 17, the interpolation will arrive at a reported value having a magnitude between 16 and 17 (e.g., 16.40).
- step 1840 the controller controls the well reading apparatus 100 to report the reported value and provide an indication that the sample in the corresponding well has tested positive for the targeted disease.
- This indication can be in the form of a display on the display screen 108, in the form data stored to a disk in the disk drive 106, and/or in the form of a print-out by a printer resident in or attached to the well reading apparatus 100.
- step 1810 determines in step 1810 that the first corrected value to exceed the threshold value is a value among the first several values used to calculate the background correction value
- the processing proceeds to steps 1850 and 1860 as shown in Fig. 18.
- This condition is shown in the graph of Fig. 20, and occurs when the sample is a very high positive sample containing a substantial amount of the pathogen of interest or target nucleic acid.
- the processing then interpolates between the last value among the values used for background correction and the next value outside the background correction value to calculate a reported value. For example, if the last value among the values used for background correction is 5, the interpolation will calculate a value between 5 and 6 (e.g., 5.70).
- step 1840 the controller controls the well reading apparatus 100 to provide an indication that the sample in the corresponding well has tested highly positive for the targeted pathogen or nucleic acid, in a manner similar to that described above.
- This indication can be in the form of a display on the display screen 108, in the form data stored to a disk in the disk drive 106, and/or in the form of a print-out by a printer resident in or attached to the well reading apparatus 100.
- step 1810 determines in step 1810 that none of the values in the graph exceed the threshold value
- steps 1870 and 1880 as shown in Fig. 18.
- This condition is shown in the graph of Fig. 21, and occurs when the sample is a negative sample containing none or an insufficient amount of the pathogen of interest or target nucleic acid.
- the processing designates the last value in the graph (i.e., 60) as the reported value.
- the processing then proceeds to step 1840, where the controller controls the well reading apparatus 100 to provide an indication that the sample in the corresponding well has tested negative for the targeted disease, in a manner similar to that described above.
- This indication can be in the form of a display on the display screen 108, in the form data stored to a disk in the disk drive 106, and/or in the form of a print-out by a printer resident in or attached to the well reading apparatus 100.
- the manner in which the samples from patient number 1 collected in the other sample microwells are read and analyzed is essentially identical to that described above for the sample in the first sample microwell. Specifically, the 60 readings taken of the sample in each of the respective sample microwells are processed according to Steps 1000 through 1800 in Figs. 6 as described above.
- the amplification control AC can be included as an internal control present in all of the wells. This amplification control can be illuminated by a different frequency light emitted by the light emitting/detecting ports 132 of the light sensor bar 130, or by a duplicate light sensor bar (not shown) as described in more detail in, for example, the above-referenced U.S. Patent No 6,043,880.
- a set of two microwells for each patient is required to test for two different diseases (e.g., CT and GC), and only one microwell per patient is required to test for one disease (e.g., CT or AC).
- the values obtained from reading the CT, GC and AC positive and negative control samples are processed in the manner described above with regard to Steps 1000 through 1800, and the resulting values are analyzed to assure that the known positive and negative control samples have indeed been read as positive and negative samples, respectively. If the readings of any of these control samples are incorrect (i.e., a negative sample has been identified as a positive sample or vice-versa), all of the sample readings taken for the entire microwell tray are called into question. All of the sample data must be discarded, and new samples can be gathered in a new microwell array, and then read and evaluated in the manner described above.
Landscapes
- Physics & Mathematics (AREA)
- General Health & Medical Sciences (AREA)
- Immunology (AREA)
- Health & Medical Sciences (AREA)
- Life Sciences & Earth Sciences (AREA)
- Chemical & Material Sciences (AREA)
- Analytical Chemistry (AREA)
- Biochemistry (AREA)
- General Physics & Mathematics (AREA)
- Pathology (AREA)
- Quality & Reliability (AREA)
- Engineering & Computer Science (AREA)
- Spectroscopy & Molecular Physics (AREA)
- Measuring Or Testing Involving Enzymes Or Micro-Organisms (AREA)
- Apparatus Associated With Microorganisms And Enzymes (AREA)
- Investigating, Analyzing Materials By Fluorescence Or Luminescence (AREA)
- Investigating Or Analysing Biological Materials (AREA)
- Complex Calculations (AREA)
Applications Claiming Priority (2)
| Application Number | Priority Date | Filing Date | Title |
|---|---|---|---|
| US574031 | 1995-12-18 | ||
| US57403100A | 2000-05-19 | 2000-05-19 |
Publications (2)
| Publication Number | Publication Date |
|---|---|
| EP1158449A2 true EP1158449A2 (fr) | 2001-11-28 |
| EP1158449A3 EP1158449A3 (fr) | 2004-12-15 |
Family
ID=24294404
Family Applications (1)
| Application Number | Title | Priority Date | Filing Date |
|---|---|---|---|
| EP01110657A Ceased EP1158449A3 (fr) | 2000-05-19 | 2001-05-02 | Procédé informatique et appareil pour analyser la lecture d'essais d'acides nucléiques |
Country Status (3)
| Country | Link |
|---|---|
| EP (1) | EP1158449A3 (fr) |
| JP (1) | JP2002031636A (fr) |
| CA (1) | CA2348251A1 (fr) |
Cited By (3)
| Publication number | Priority date | Publication date | Assignee | Title |
|---|---|---|---|---|
| EP1535063A4 (fr) * | 2002-07-26 | 2007-07-25 | Becton Dickinson Co | Methode d'analyse de lectures de dosages d'acides nucleiques |
| US7273704B2 (en) | 2002-08-12 | 2007-09-25 | Hitachi High-Technologies Corporation | Method of detecting nucleic acid by using DNA microarrays and nucleic acid detection apparatus |
| US8940882B2 (en) | 2004-04-14 | 2015-01-27 | Becton, Dickinson And Company | Multiple fluorophore detector system |
Families Citing this family (1)
| Publication number | Priority date | Publication date | Assignee | Title |
|---|---|---|---|---|
| JP4967261B2 (ja) * | 2005-06-24 | 2012-07-04 | パナソニック株式会社 | プローブ担体 |
Family Cites Families (3)
| Publication number | Priority date | Publication date | Assignee | Title |
|---|---|---|---|---|
| JP4540754B2 (ja) * | 1996-06-04 | 2010-09-08 | ユニバーシティ オブ ユタ リサーチ ファウンデーション | Pcr中のハイブリダイゼーションのモニタリング |
| US5846726A (en) * | 1997-05-13 | 1998-12-08 | Becton, Dickinson And Company | Detection of nucleic acids by fluorescence quenching |
| US5863736A (en) * | 1997-05-23 | 1999-01-26 | Becton, Dickinson And Company | Method, apparatus and computer program products for determining quantities of nucleic acid sequences in samples |
-
2001
- 2001-05-02 EP EP01110657A patent/EP1158449A3/fr not_active Ceased
- 2001-05-18 CA CA 2348251 patent/CA2348251A1/fr not_active Abandoned
- 2001-05-21 JP JP2001150336A patent/JP2002031636A/ja active Pending
Cited By (3)
| Publication number | Priority date | Publication date | Assignee | Title |
|---|---|---|---|---|
| EP1535063A4 (fr) * | 2002-07-26 | 2007-07-25 | Becton Dickinson Co | Methode d'analyse de lectures de dosages d'acides nucleiques |
| US7273704B2 (en) | 2002-08-12 | 2007-09-25 | Hitachi High-Technologies Corporation | Method of detecting nucleic acid by using DNA microarrays and nucleic acid detection apparatus |
| US8940882B2 (en) | 2004-04-14 | 2015-01-27 | Becton, Dickinson And Company | Multiple fluorophore detector system |
Also Published As
| Publication number | Publication date |
|---|---|
| EP1158449A3 (fr) | 2004-12-15 |
| JP2002031636A (ja) | 2002-01-31 |
| CA2348251A1 (fr) | 2001-11-19 |
Similar Documents
| Publication | Publication Date | Title |
|---|---|---|
| CN104204219B (zh) | 用于检测在样品容器中的微生物生长的方法和系统 | |
| WO2005001453A1 (fr) | Identification automatique de bandes d'essai reactives au moyen de valeurs de reflectance | |
| CA2287643C (fr) | Methode informatisee et appareil pour l'etude des donnees d'une analyse de l'acide nucleique | |
| US20100276580A1 (en) | Quantitative Calibration Method and System for Genetic Analysis Instrumentation | |
| EP2419846B1 (fr) | Procédés pour une quantification d'acides nucléiques | |
| EP1158449A2 (fr) | Procédé informatique et appareil pour analyser la lecture d'essais d'acides nucléiques | |
| US8219326B2 (en) | Determination of melting temperatures of DNA | |
| KR100785188B1 (ko) | 생체 정보 검사 시스템 | |
| JP2019109152A (ja) | 信号処理装置及び信号処理方法 | |
| KR20080003819A (ko) | 생체 정보 처리 장치 및 방법, 프로그램 및 기록 매체 | |
| US8340918B2 (en) | Determination of melting temperatures of DNA | |
| US20040133313A1 (en) | Method for analyzing readings of nucleic acid assays | |
| Freeman et al. | The importance of quality control validation and relationships with total error quality goals and bias in the interpretation of laboratory results | |
| US20140106358A1 (en) | Method of detecting a presence and/or measuring a quantity of an analyte in a sample by a nucleic acid amplification reaction | |
| CN120624633A (zh) | 尘肺易感基因芯片检测试剂盒 | |
| Zaydman et al. | 22 Detecting Antigen Excess in Serum Free Light Chain Measurement |
Legal Events
| Date | Code | Title | Description |
|---|---|---|---|
| PUAI | Public reference made under article 153(3) epc to a published international application that has entered the european phase |
Free format text: ORIGINAL CODE: 0009012 |
|
| AK | Designated contracting states |
Kind code of ref document: A2 Designated state(s): AT BE CH CY DE DK ES FI FR GB GR IE IT LI LU MC NL PT SE TR |
|
| AX | Request for extension of the european patent |
Free format text: AL;LT;LV;MK;RO;SI |
|
| PUAL | Search report despatched |
Free format text: ORIGINAL CODE: 0009013 |
|
| AK | Designated contracting states |
Kind code of ref document: A3 Designated state(s): AT BE CH CY DE DK ES FI FR GB GR IE IT LI LU MC NL PT SE TR |
|
| AX | Request for extension of the european patent |
Extension state: AL LT LV MK RO SI |
|
| 17P | Request for examination filed |
Effective date: 20050613 |
|
| AKX | Designation fees paid |
Designated state(s): BE DE FR GB IT |
|
| STAA | Information on the status of an ep patent application or granted ep patent |
Free format text: STATUS: THE APPLICATION HAS BEEN REFUSED |
|
| 18R | Application refused |
Effective date: 20101009 |