EP1180678A2 - Verfahren zur Untersuchung einer Zellprobe - Google Patents
Verfahren zur Untersuchung einer Zellprobe Download PDFInfo
- Publication number
- EP1180678A2 EP1180678A2 EP01123393A EP01123393A EP1180678A2 EP 1180678 A2 EP1180678 A2 EP 1180678A2 EP 01123393 A EP01123393 A EP 01123393A EP 01123393 A EP01123393 A EP 01123393A EP 1180678 A2 EP1180678 A2 EP 1180678A2
- Authority
- EP
- European Patent Office
- Prior art keywords
- cell
- cells
- sample
- osmolality
- property
- Prior art date
- Legal status (The legal status is an assumption and is not a legal conclusion. Google has not performed a legal analysis and makes no representation as to the accuracy of the status listed.)
- Granted
Links
Images


Classifications
-
- G—PHYSICS
- G01—MEASURING; TESTING
- G01N—INVESTIGATING OR ANALYSING MATERIALS BY DETERMINING THEIR CHEMICAL OR PHYSICAL PROPERTIES
- G01N15/00—Investigating characteristics of particles; Investigating permeability, pore-volume or surface-area of porous materials
- G01N15/10—Investigating individual particles
- G01N15/1031—Investigating individual particles by measuring electrical or magnetic effects
- G01N15/12—Investigating individual particles by measuring electrical or magnetic effects by observing changes in resistance or impedance across apertures when traversed by individual particles, e.g. by using the Coulter principle
-
- G—PHYSICS
- G01—MEASURING; TESTING
- G01N—INVESTIGATING OR ANALYSING MATERIALS BY DETERMINING THEIR CHEMICAL OR PHYSICAL PROPERTIES
- G01N15/00—Investigating characteristics of particles; Investigating permeability, pore-volume or surface-area of porous materials
- G01N15/01—Investigating characteristics of particles; Investigating permeability, pore-volume or surface-area of porous materials specially adapted for biological cells, e.g. blood cells
- G01N2015/012—Red blood cells
-
- G—PHYSICS
- G01—MEASURING; TESTING
- G01N—INVESTIGATING OR ANALYSING MATERIALS BY DETERMINING THEIR CHEMICAL OR PHYSICAL PROPERTIES
- G01N15/00—Investigating characteristics of particles; Investigating permeability, pore-volume or surface-area of porous materials
- G01N15/10—Investigating individual particles
- G01N2015/1022—Measurement of deformation of individual particles by non-optical means
-
- G—PHYSICS
- G01—MEASURING; TESTING
- G01N—INVESTIGATING OR ANALYSING MATERIALS BY DETERMINING THEIR CHEMICAL OR PHYSICAL PROPERTIES
- G01N15/00—Investigating characteristics of particles; Investigating permeability, pore-volume or surface-area of porous materials
- G01N15/10—Investigating individual particles
- G01N2015/1024—Counting particles by non-optical means
-
- G—PHYSICS
- G01—MEASURING; TESTING
- G01N—INVESTIGATING OR ANALYSING MATERIALS BY DETERMINING THEIR CHEMICAL OR PHYSICAL PROPERTIES
- G01N15/00—Investigating characteristics of particles; Investigating permeability, pore-volume or surface-area of porous materials
- G01N15/10—Investigating individual particles
- G01N2015/1029—Particle size
-
- G—PHYSICS
- G01—MEASURING; TESTING
- G01N—INVESTIGATING OR ANALYSING MATERIALS BY DETERMINING THEIR CHEMICAL OR PHYSICAL PROPERTIES
- G01N15/00—Investigating characteristics of particles; Investigating permeability, pore-volume or surface-area of porous materials
- G01N15/10—Investigating individual particles
- G01N2015/103—Particle shape
Definitions
- This invention relates to a method for testing a cell sample or a fluid sample.
- test is especially suitable for testing red and white blood cells.
- cell volume is one of the most informative investigations in clinical medicine.
- Cell size is an important indicator of pathology and in conjunction with haemoglobin, forms the basic classification of anemias. It is the basis of the differentiation of white blood cells and leukaemias, the assessment of prognosis in scores of diseases and is an invaluable screening device for the thalassaemias, the most common genetic disease in the world.
- a normal human blood sample is isotonic with a solution having an osmolality of about 290 mosm Kg -1 , and at this osmolality the average red blood cell in the average individual will have a biconcave shape. It is well known that reducing the osmolality of the solution surrounding a red blood cell below a critical level will cause that cell to swell, then rupture, forming a ghost cell which slowly releases its contents, almost entirely haemoglobin, into the surrounding medium. This process, called haemolysis, can be induced using water (osmotically) or by detergents, venoms or other chemicals, thermal, mechanical or electrical agents. Tests to determine cell volume are typically carried out at isotonic osmolality.
- particle counters In order to estimate the size and the count of the number and properties of red blood cells in a sample, there are several commercial particle counters available which may be used. These particle counters act either by measuring the electrical or optical properties of a stream of cells that pass along a narrow tube. The property measured is usually the current flowing through the suspension in the tube or the electrical field within the tube. The signal generated depends upon several factors including cell size, cell shape and the properties of the cell membrane the difference in the electrical property of the cell and the suspending medium.
- a sample of cells suspended in a liquid medium wherein the cells have at least one measurable property distinct from that of the liquid medium, is subjected to analysis by a method including the steps:
- the data can be subsequently treated so as to identify sub-populations of cells within the sample which respond differently to one another under the imposition of the environmental parameter alteration.
- the present invention provides a method for testing blood samples which enables data to be obtained on a cell-by-cell basis. By using the data on a cell-by-cell basis, it enables new parameters to be measured and to obtain information on the distribution of cells of different sizes among a population and reveal sub-populations of cells based on their anatomical and physiological properties.
- a measure of reproducibility is the standard deviation of the observations made.
- An aspect of the present invention is to provide improvements in which the standard deviation of the results obtained is reduced to ensure clinical utility.
- An apparatus for testing a sample cell suspension in a liquid medium in accordance with the method of the first aspect of the present invention comprises data processing means programmed to compare data from said steps (c) and (g) as a function of the extent of said alteration of said parameter of the cell environment and frequency distribution of said at least one property.
- the environmental parameter which is changed in the method may be any change which will result in a measurable parameter of the cells being altered.
- the method is of most value where the change in environmental parameter changes the size, shape, or other anatomical property of the cell.
- the method is of particular value in detecting a change in the volume of cells as a result of a change of osmolality of the surrounding medium.
- the environmental parameter change is an alteration, usually a reduction, in osmolality.
- the environment of the first aliquot is isotonic, and thus the environment of the altered suspension in step (g) is rendered hypotonic, for instance by diluting a portion of isotonic sample suspension with a hypotonic diluent.
- Other environmental parameter changes which may be investigated include changes in pH, changes in temperature, pressure, ionophores, changes by contact with lytic agents, for instance toxins, cell membrane pore blocking agents or any combinations of these parameters. For instance, it may be useful to determine the effectiveness of lytic agents and/or pore blockers to change the amount or rate of cell volume change on a change in environmental parameters such as osmolality, pH or temperature. Furthermore the effects of two or more agents which affect transport of components in or out of cells on one another may be determined by this technique. It is also possible to subject the cell suspension to a change in shear stress during the passage of the cell suspension through the sensing zone by changing the flow rate through the sensor, without changing any of the other environmental parameters or in conjunction with a change in other environmental parameters.
- a change in the shear stress may affect the shape of the cell and thus the electrical, optical or other property which is measured by the sensor.
- Monitoring such a change in the deformation of cells may be of value. In particular, it may be of value to monitor the change in deformability upon changes imposed by disease or, artificially by changing other environmental parameters, such as chemical components of the suspending medium, pH, temperature or osmolality.
- the data processing means comprises the internal microprocessor of a personal computer.
- the measurements of the cell parameter changes may be stored and retrieved as voltage pulses and they may be displayed as individual dots on a display of voltage against the osmolality of the solution causing the parameter change.
- the resulting plot shows the frequency distribution of voltage by the intensity of the dots representing cells of the same volume.
- the number of blood cells within each aliquot which are counted is typically at least 1000 and the cell-by-cell data is then used to produce an exact frequency distribution of size.
- this density can be made more visible by using different colours to give a three dimensional effect, similar to that seen in radar rainfall pictures used in weather forecasting.
- the measured parameter change could be displayed against the number of individual cells showing the same change. In this way a distribution of cell volume or voltage in a particular tonicity of given osmolality can be obtained.
- the method of the invention may be further improved by, instead of subjecting portions of a sample each to one of a series of hypotonic solutions of different osmolalities to form the individual aliquots, the sample is fed continuously into a solution, the osmolality of which is changed continuously to produce a continuous gradient of aliquots for passage through the sensing zone.
- identical portions of the sample under test are subjected to solutions of each osmolality throughout the range under test after the same time from imposition of the environmental parameter change to the time of passage through the sensing zone.
- This technique ensures that the cells are subjected to the exact concentration which cause critical changes in that particular sample.
- an effect of feeding the sample under test into a continuously changing osmolality gradient is to obtain measurements which are equivalent to treating one particular cell sample with that continuously changing gradient. This technique is the subject of WO 97/24600.
- a four-dimensional display is obtained which may be likened to a changing weather map.
- the rate of change of the property in relation to the time taken to perform each test must be such that any changes which occur during the test must not substantially affect the results.
- This moving three-dimensional display (motion in time being the fourth dimension), which provides a pattern characteristic of a particular blood sample.
- the pattern includes the density of particular cell voltages and thereby sizes, the shape of the area representing ghost cells and particularly the shape and location of a gap between the whole cells and the ghost cells.
- This pattern and its variation with species and the health of individuals within a species provides a characteristic which may be used in clinical diagnosis and other disciplines.
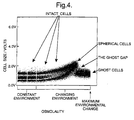
- Cell shape is one property that is the basis of this dancing or changing display. For the first few hours the cell becomes increasingly spherical in the original sample, it then becomes flatter for several hours, then more spherical again reaches a limit and then becomes thinner and finally may swell again.
- the 3D pattern enables identification of the precise osmolality at which particular cells reach their maximum volume, i.e. when they become spheres. With appropriate calibration, and using the magnitude of the voltage pulse, it is possible to define precisely and accurately the actual volume of such cells. By causing cells to pass through their maximum and differentiating, identification of the point of lysis ie sphered cells is obtained to the nearest 1/10 mosm Kg -1 .
- the mean cell volume is required, the data is taken from the voltages and thereby the volume at isotonic osmolality corrected for the proportion of cells that are more leptocytotic or spherocytic than normal and the degree of that deviation.
- individual cell volumes are required they are obtained directly from the observed voltage pulse or from the frequency distribution data with dispersion statistics or its graphical representation.
- a typical cell sample may contain sub-populations of cells which change with time in a different way from other cells in that sample.
- Examination of the patterns obtained at different points in time is preferably done by computer sequencing which gives the effect of the dynamic changes in the cells in the form of a moving picture.
- two or more cell sub-populations may be followed to determine the fate and the relative proportion of each population. This is useful as a means to monitor, for example the recovery of the bone marrow in an anaemia that is under treatment, a leukaemia that has received chemotherapy, a bone marrow transplant or as a means to study the storage lesion in stored blood.
- a method for the diagnosis of abnormalities in a blood cell sample which comprises using the invention whereby the data retrieved on an individual cell basis, or a summary there of, from an experimental source is compared with data retrieved on an individual cell basis from a standard sample.
- the data available from the improved method of the present invention provides a pattern and a method of calculating a number of individual blood cell parameters which are capable of comparison with standard samples. This comparison provides the basis for a wide range of clinical diagnosis.
- the pattern or contour map obtained by conducting measurements against a continuous gradient of osmolality provides a pattern capable of giving a great deal of diagnostic information and summaries of such data.
- the method of the invention may be used in medicine, for example in clinical diagnosis to detect the presence of disease, or to assess remission and prognosis of a diseased state, or in blood banks to assess the condition of stored blood.
- the invention will also have value in veterinary persons. Again a great deal of work needs to be done to identify and correlate particular changes in this pattern with clinical conditions. However it is clear that the existence of this variation in pattern with time will prove to be a significant diagnostic tool.
- the method of the invention may be used in medicine, for example in clinical diagnosis to detect the presence of disease, or to assess remission and prognosis of a diseased state, or in blood banks to assess the condition of stored blood.
- the invention will also have value in veterinary medicine for diagnosis and in zoology as a guide to taxonomy.
- This invention has the advantage of being able to detect subtle changes in red cell morphology, and in particular cell shape changes, long before the cell shows gross changes that may be detectable by existing methods. For example, gross changes in the red cell thickness which cannot be quantified but can usually be detected by light microscopy, can be quantified using the method of the invention. Further small changes in the red cell thickness cannot be detected or quantified by existing methods, but can be both detected and quantified using the method of the invention.
- the invention has been shown to be useful in the clinical diagnosis of many conditions with thin cells and in particular:
- This invention has been shown to be useful in the clinical diagnosis of spherocytic cells in a sample (ie. cell which have more of a spherical shape than is normal) can be an indication of one of the following:
- All existing automated methods include a fixed shape correction in the treatment of sensor readings taken from a single cell suspension in which the cell environment is not altered during the course of the test, which compensates for the deviation of the cells from spherical shape particles commonly used to calibrate the instruments.
- a fixed correction of approximately 1.5 is entered into the calculation on the assumption that a sample cell has the shape of a biconcave disc. This correction is correct for the average cell in the average person at isotonic osmolality, but it is incorrect for many categories of illness where the assumed fixed correction may induce an error of up to 60% in the estimate of cell volume.
- An estimate is made of the in vivo cell shape so that a true estimate of cell volume or other cell parameter at all shapes is obtained.
- the property of the cells which differs from the liquid medium is one which is directly related to the volume of the cell.
- a property is electrical resistance or impedance, and this is measured as in the normal Coulter Counter by determining the flow of electrical current through the cell suspension as it passes through a sensing zone of the sensor.
- the sensing zone is usually a channel or aperture through which the cell suspension is caused to flow.
- Any type of sensor may be used provided that the sensor produces a signal which is proportional to the cell size.
- Such sensor types may depend upon voltage, current, RF, NMR, optical, acoustic or magnetic properties.
- the sensor is substantially as described in WO 97/24600.
- blood cells for instance white or, usually, red blood cells
- cell suspensions which may be plant or animal cells or micro-organism cells, for instance, bacterial cells.
- the method of the present invention may also be applicable to other natural and synthetic vesicles which comprise a membrane surrounding an interior space, the shape or size or deformability of which may be altered by altering an environmental parameter.
- vesicles may be useful as membrane models, for instance, or as drug delivery devices or as devices for storing and/or stabilising other active ingredients or to contain haemoglobin in blood substitutes.
- the time between the initiation of the alteration of the environment to the passage of the cells through the sensing zone may vary but preferably is less than 1 minute, more preferably less than 10 seconds.
- the time is generally controlled in the method and preferably it is kept constant. If it changes, then time may be a further factor which is taken into account in the calculation step of step (h).
- the method of the invention comprises merely of the treatment of two aliquots of the sample cell suspension
- the method includes the steps of subjecting another aliquot of sample cell suspension to a second alteration in at least one parameter of the cell environment passing said altered aliquot through the sensor, recording the change in said property of the cell suspension under the altered environment as each of a number of cells of the aliquot passes through the sensor, recording all the concomitant properties of the environment together with the said change on a cell-by-cell basis, and comparing the data from previous step (c) and the preceding step as a function of the extent of said second alteration of environmental parameter.
- the test is dependent upon two sensor measurements, one of which is at a maximum, or near to it.
- the environment required to induce a cell to reach a maximum size can be entirely unknown.
- the environmental changes can be sequential, non-sequential, random, continuous or discontinuous, provided that the maximum achievable cell size is recorded.
- One convenient way of ensuring this is to test the cell in a continuously changing environment so that all possible cell sizes are recorded, including the maximum.
- the second alteration in the cell environment is usually of the same type as the first alteration. It may even be of the same extent as the first alteration, but the time between initiation of the alteration and passage of the cells through the sensing zone may be different, thereby monitoring the rate of change in the cells properties when subjected to a particular change in environmental parameter. This technique may also be used to monitor cells which have been in storage for several years.
- the second alteration in environmental parameter is of the same type as the first alteration, but has a different extent.
- second and subsequent aliquots of cell suspension are subjected to successively increasing extents of alteration of the environmental parameter such that the change of said property produces a maximum and then decreases as the extent of alteration of environmental parameter is increased.
- the environmental change is varied until the cell volume passes a maximum.
- the preferred application of the method of the present invention is to analyse red blood cells, the following discussion is based mainly on the study of such cells. It will be realised, however, that the method is, as mentioned above, applicable to other cell types and to determine other information concerning an organism from a study of such cell types.
- cell shape is not estimated by any automated method.
- the present invention enables the user to determine cell shape and derive other data, such as cell volume, surface area, surface area to volume ratio, sphericity index, cell thickness, and surface area per millilitre. Aside from research and experimental laboratories, none of these measurements are currently available in any clinical laboratory and hitherto, none could be completed within 60 seconds.
- the preferred method where the sample cell suspension is subjected to a concentration gradient enables the automatic detection or a user to detect accurately when the cells adopt a substantially spherical shape immediately before lysis.
- the commercially available Coulter Counter particle counter instrument produces a signal in proportion to the volume of particles which pass through a sensing zone, typically a voltage pulse for each particle.
- the size of the signal is calibrated against spherical latex particles of known volume to produce a conversion factor to convert a measured signal, typically voltage, into a particle volume, typically femtolitres.
- a fixed shape correction factor is used in addition to the conversion factor.
- This fixed shape correction is designed to produce a correct volume estimate when measuring particles that are not spherical as the size of the voltage pulses are not solely related to cell volume. For instance, normal red blood cells produce sensor pulses which are too small by a factor of around 1.5 when measured on these instruments and therefore a fixed correction of 1.5 is entered into the calculation of cell volume to produce the correct value.
- this fixed shape correction factor is replaced with a sample specific shape correction factor f (K shape ), generated from a shape correction function.
- FIG. 1 shows schematically the arrangement of a blood sampler for use in the method of the present invention.
- the blood sampler comprises a sample preparation section 1, a gradient generator section 2 and a sensor section 3.
- a whole blood sample 4 contained in a sample container 5 acts as a sample reservoir for a sample probe 6.
- the sample probe 6 is connected along PTFE fluid line 26 to a diluter pump 7 via multi-position distribution valve 8 and multi-position distribution valve 9.
- the diluter pump 7 draws saline solution from a reservoir (not shown) via port #1 of the multi-position distribution valve 9.
- the diluter pump 7 is controlled to discharge a sample of blood together with a volume of saline into a first well 10 as part of a first dilution step in the sampling process.
- the diluter pump 7 draws a dilute sample of blood from the first well 10 via multi-position distribution valve 11 into PTFE fluid line 12 and discharges this sample together with an additional volume of saline into a second well 13.
- the second well 13 provides the dilute sample source for the gradient generator section 2 described in detail below.
- a pre-diluted sample of blood 14 in a sample container 15 may be used.
- a sample probe 16 is connected along PTFE fluid line 30, multi-position distribution valve 11, PTFE fluid line 12 and multi-position distribution value 9 to the diluter pump 7.
- the diluter pump 7 draws a volume of the pre-diluted sample 14 from the sample container 15 via fluid line 30 and multi-position distribution value 11 into fluid line 12 and discharges the sample together with an additional volume of saline into the second well 13 to provide the dilute sample source for the gradient generator section 2.
- the gradient generator section 2 comprises a first fluid delivery syringe 17 which draws water from a supply via multi-position distribution valve 18 and discharges water to a mixing chamber 19 along PTFE fluid line 20.
- the gradient generator section 2 also comprises a second fluid delivery syringe 21 which draws the diluted sample of blood from the second well 13 in the sample preparation section 1 via multi-position distribution valve 22 and discharges this to the mixing chamber 19 along PTFE fluid line 23 where it is mixed with the water from the first fluid delivery syringe 17.
- the rate of discharge of water from the first fluid delivery syringe 17 and the rate of discharge of dilute blood sample from the second fluid delivery syringe 21 to the mixing chamber is controlled to produce a predetermined concentration profile of the sample suspension which exits the mixing chamber 19 along PTFE fluid line 24.
- Fluid line 24 is typically up to 3 metres long.
- a suitable gradient generator is described in detail in WO 97/24600.
- the sample suspension exits the mixing chamber 19 along fluid line 24 and enters the sensor section 3 where it passes a sensing zone 25 which detects individual cells of the sample suspension before the sample is disposed of via a number of waste outlets.
- the diluter pump 7 comprises a fluid delivery syringe driven by a stepper motor (not shown) and is typically arranged initially to draw 5 to 10ml of saline from a saline reservoir (not shown) via port #1 of multi-position distribution valve 9 into the syringe body.
- a suitable fluid delivery syringe and stepper motor arrangement is described in detail in the Applicant's co-pending application also filed this day (Agents reference 80/4936/01).
- Port #1 of the multi-position distribution valve 9 is then closed and port #0 of both multi-position distribution valve 9 and multi-position distribution valve 8 are opened.
- 100 ⁇ l of whole blood is then drawn from the sample container 5 to take up the dead space in the fluid line 26.
- Port #0 of multi-position distribution valve 8 is then closed and any blood from the whole blood sample 4 which has been drawn into a fluid line 27 is discharged by the diluter pump 7 to waste via port #1 of multi-position distribution valve 8.
- port #0 of multi-position distribution value 8 is opened and the diluter pump 7 draws a known volume of whole blood, typically 1 to 20 ⁇ l, into PTFE fluid line 27. Port #0 is then closed, port #2 opened and the diluter pump 7 discharges the blood sample in fluid line 27 together with a known volume of saline in fluid line 27, typically 0.1 to 2ml, into the first well 10. Port #2 of multi-position distribution value 8 and port #0 of multi-position distribution value 9 are then closed.
- port #0 of multi-position distribution valve 11 and port #3 of multi-position distribution valve 9 are opened to allow the diluter pump 7 to draw the first sample dilution held in the first well 10 to take up the dead space in PTFE fluid line 28.
- Port #0 of multi-position distribution valve 11 is then closed and port #1 opened to allow the diluter pump 7 to discharge any of the first sample dilution which has been drawn into fluid line 12 to waste via port #1.
- a second dilution step port #0 of multi-position distribution valve 11 is re-opened and the diluter pump 7 draws a known volume, typically 1 to 20 ⁇ l, of the first sample dilution into fluid line 12.
- Fluid line 12 includes a delay coil 29 which provides a reservoir to prevent the sample contaminating the diluter pump 7.
- Port #0 of multi-position distribution valve 11 is then closed, port #3 opened, and the diluter pump 7 then discharges the first sample dilution in fluid line 12, together with a known volume of saline, typically 0.1 to 20ml, into the second well 13.
- Port #3 of multi-position distribution valve 11 is then closed.
- the whole blood sample has been diluted by a ratio of typically 10000:1.
- the instrument is arranged automatically to control the second dilution step to vary the dilution of the sample suspension to achieve a predetermined cell count to within a predetermined tolerance at the start of a test routine.
- the first fluid delivery syringe 17 is primed with water from a water reservoir.
- Port #3 of multi-position distribution valve 22 is opened and the second fluid delivery syringe draws a volume of the dilute blood sample from the second well 13 into the syringe body.
- Port #3 of multi-position distribution valve 22 is then closed and port #2 of both multi-position distribution valve 18 and multi-position distribution valve 22 are opened prior to the controlled discharge of water and dilute blood sample simultaneously into the mixing chamber 19.
- Figure 2 shows how the velocity of the fluid discharged from each of the first and second fluid delivery syringes is varied with time to achieve a predetermined continuous gradient of osmolality of the sample suspension exiting the mixing chamber 19 along fluid line 24.
- the flow rate of the sample suspension is typically in the region of 200 ⁇ l s -1 which is maintained constant whilst measurements are being made. This feature is described in WO 97/24529.
- a cam profile associated with a cam which drives fluid delivery syringe 21 accelerates the syringe plunger to discharge the sample at a velocity V 1
- a cam profile associated with a cam which drives fluid delivery syringe 17 accelerates the associated syringe plunger to discharge fluid at a lower velocity V 2 .
- the first delivery syringe 17 and the second fluid delivery syringe 21 have discharged their contents, the first delivery syringe is refilled with water in preparation for the next test. If a blood sample from a different subject is to be used, the second fluid delivery syringe 21 is flushed with saline from a saline supply via port #1 of multi-position distribution valve 22 to clean the contaminated body of the syringe.
- the sample suspension which exits the mixing chamber 19 passes along fluid line 24 to the sensor section 3.
- a suitable sensor section is described in detail in WO 97/24600.
- the sample suspension passes to a sensing zone 25 comprising an electrical field generated adjacent an aperture through which the individual cells of the sample suspension must pass.
- the response of the electrical field to the electrical resistance of each individual cell is recorded as a voltage pulse.
- the amplitude of each voltage pulse together with the total number of voltage pulses for a particular interrupt period, typically 0.2 seconds, is also recorded and stored for subsequent analysis including a comparison with the osmolality of the sample suspension at that instant which is measured simultaneously.
- the osmolality of the sample suspension may also be determined without measurement from a knowledge of the predetermined continuous osmotic gradient generated by the gradient generator section 2. As described below, the osmolality (pressure) is not required to determine the cell parameters.
- Figure 3 shows how data is collected and processed. Inside each instrument is a main microprocessor which is responsible for supervising and controlling the instrument, with dedicated hardware or low-cost embedded controllers responsible for specific jobs within the instrument, such as operating diluters, valves, and stepper motors or digitizing and transferring a pulse to buffer memory.
- the software which runs the instrument is written in C and assembly code and is slightly less than 32 K long.
- the amplitude and length of each voltage pulse produced by the sensor is digitized to 12-bit precision and stored in one of two 16K buffers, along with the sum of the amplitudes, the sum of the lengths, and the number of pulses tested. Whilst the instrument is collecting data for the sensors, one buffer is filled with the digitized values while the main microprocessor empties and processes the full buffer. This processing consists of filtering out unwanted pulses, analysing the data to alter the control of the instrument and finally compressing the data before it is sent to the personal computer for complex analysis.
- Optional processing performed by the instrument includes digital signal processing of each sensor pulse so as to improve filtering, improve the accuracy of the peak detection and to provide more information about the shape and size of the pulses.
- digital signal processing produces about 25 16-bit values per cell, generating about 25 megabytes of data per test.
- Data processing in the personal computer consists of a custom 400K program written in C and Pascal.
- the PC displays and analyses the data in real time, controls the user interface (windows, menus, etc.) and stores and prints each sample.
- the software also maintains a database of every sample tested enabling rapid comparison of any sample which has been previously tested. Additionally, the software monitors the instrument's operation to detect malfunctions and errors, such as low fluid levels, system crashes or the user forgetting to turn the instrument on.
- the voltage pulse generated by each cell of the sample suspension as it passes through the aperture of sensing zone 25 is displayed in graphical form on a VDU of a PC as a plot of osmolality against measured voltage.
- the sample suspension passes through the sensor section at a rate of 200 ⁇ ls -1 .
- the second dilution step is controlled to achieve an initial cell count of around 5000 cells per second, measured at the start of any test, so that in an interrupt period of 0.20 seconds, around 1000 cells are detected and measured. This is achieved by varying automatically the volume of saline discharged by the diluter pump 7 from the fluid line 12 in the second dilution step. Over a test period of 40 seconds, a total of 200 interrupt periods occur and this can be displayed as a continuous curve in a three-dimensional form to illustrate the frequency distribution of measured voltage at any particular osmolality, an example of which is shown in Figures 4 and 5.
- the measured cell voltage, stored and retrieved on an individual cell basis is shown displayed on a plot of voltage against the osmolality of the solution causing that voltage change.
- Using individual dots to display the measured parameter change for each individual cell results in a display whereby the distribution of cells by voltage, and thereby by volume, in the population is shown for the whole range of solutions covered by the osmolality gradient.
- the total effect is a three-dimensional display shown as a measured property change in terms of the amplitude of the measured voltage pulses against altered parameter, in this case the osmolality of the solution, to which the cells have been subjected and the distribution or density of the cells of particular sizes within the population subjected to the particular osmolality.
- the effect is to produce a display analogous to a contour map, which can be intensified by using colour to indicate the areas of greatest intensity.
- a four-dimensional display is obtained which may be likened to a change in weather map.
- This moving three-dimensional display, its motion in time being the fourth dimension, provides an additional pattern characteristic of a particular blood sample.
- the images shown in Figure 6 are the results of tests carried out at hourly intervals at a temperature of 37°C. As the measurements are so exact, the repeat values are superimposable using computer sequencing techniques.
- cells slowly lose their ability to function over time, but they also change in unexpected ways.
- the size and shape of the cells in a blood sample change in a complex, non-linear but repeatable way, repeating some of the characteristic patterns over the course of days and on successive testing.
- the patterns, emerging over time, show similarity among like samples and often show a characteristic wave motion.
- the pattern of change may vary between individuals reflecting the health of the individual, or the pattern may vary within a sample.
- a sample that is homogeneous when first tested may split into two or several sub-populations which change with time and their existence can be detected by subjecting the sample to a wide range of different tonicities and recording the voltage pulse in the way described.
- the three-dimensional pattern provides data which enables identification of the precise osmolality at which particular cells reach their maximum volume, when they become spheres. With appropriate calibration, which is described in detail below, and using the magnitude of the voltage pulse, it is possible to define precisely and accurately the actual volume of such cells and thereafter derive a number of other cell parameters of clinical interest.
- the amplitude of the voltage pulses produced by the sensor 25 as individual cells pass through the electrical field are proportional to the volume of each cell.
- the instrument requires calibration. This is performed using spherical latex particles of known volume and by comparison with cell volumes determined using conventional techniques.
- a shape correction factor is determined to take account of the fact that the average blood cell in the average individual has a bi-concave shape. Applying the above voltage conversion factor K volts assumes that, like the latex particles, blood cells are spherical and would therefore give an incorrect cell volume for cell shapes other than spherical.
- a variable shape correction function is determined so that the mean volume of the blood cells at any osmolality up to the critical osmolality causing lysis can be calculated extremely accurately.
- the true volume as determined by the packed cell volume technique, was 92.0f1, whilst the measured mean voltage was 670mV.
- volume iso Voltage iso x K volts x K shape
- Voltage iso is the measured voltage
- K shape is a shape correction factor
- Table 1 shows the shape correction factor K shape for each of the other aliquots and demonstrates that the factor to be applied to each sample is different with the maximum shape correction being applied at isotonic osmolalities where the blood cells are bi-concave rather than spherical.
- K shape correction function To automate the calculation of K shape at any osmolality of interest a shape correction function is required. The following general function describes a shape correction factor based on any two sensor readings i.e.
- f(K shape ) f (SR1, SR2)
- SR1 is a sensor reading (measured voltage) at a known shape, typically spherical
- SR2 is a sensor reading (measured voltage) at an osmolality of interest, typically isotonic.
- Figures 10a-10d show the results for a normal blood sample from a healthy individual.
- Figure 10a shows a three-dimensional plot of measured voltage against osmolality
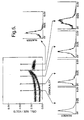
- Figure 10b shows a graph of osmolality against percentage change in measured voltage for a series of tests of a sample
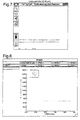
- Figure 10c shows the results in a tabulated form
- Figure 10d shows superimposed graphs of mean voltage and cell count for the test, respectively, against osmolality.
- the cell count which is initially 5000 cells per second at the beginning of a test, reduces throughout the test due to the dilution of the sample in the gradient generator section 2.
- the mean voltage rises to a maximum at a critical osmolality where the blood cells achieve a spherical shape and then reduces.
- the maxima of the curve in Figure 10b and therefore the mean voltage at the maxima, can be determined.
- the mean voltage at this point gives the value SR1 for the above equation. It is then possible to select any osmolality of interest, and the associated measured voltage SR2, and calculate the true volume of the cell at that osmolality.
- the isotonic osmolality is chosen, corresponding to approximately 290mosm.
- volume iso volume sph and the spherical cell radius
- SA Surface Area
- the surface area SA is virtually unchanged at all osmolalities, the cell membrane being virtually inelastic, and in particular between spherical and isotonic, the surface area SA may be calculated by substituting r into the expression:
- SAVR Surface Area to Volume Ratio
- SAVR is given by the expression:
- the present invention can easily measure the SAVR, a widely quoted but hitherto, rarely measured indication of cell shape.
- SAVR a widely quoted but hitherto, rarely measured indication of cell shape.
- SI a dimensionless unit independent of cell size
- the same parameter can be determined for all other osmolalities.
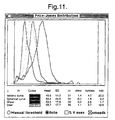
- the frequency distribution of the cell diameters is given both as dispersion statistics as well as a frequency distribution plot.
- the present invention provides an automated version of the known manual procedure of plotting a frequency distribution of isotonic cell diameters known as a Price-Jones curve.
- the present invention is capable of producing a Price-Jones curve of cell diameters for any shape of cell and, in particular, isotonic, spherical and ghost cells (at any osmolality) and is typically based on 250,000 cells. This is shown in Figure 10.
- the cell thickness can therefore be calculated as follows:
- SA surface area
- RBC cell count
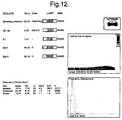
- Figure 12 illustrates the three-dimensional frequency distribution of a sample from a patient having an HbCC disease. As shown, the plot is grossly abnormal.
Landscapes
- Chemical & Material Sciences (AREA)
- Dispersion Chemistry (AREA)
- Physics & Mathematics (AREA)
- Health & Medical Sciences (AREA)
- Life Sciences & Earth Sciences (AREA)
- Analytical Chemistry (AREA)
- Biochemistry (AREA)
- General Health & Medical Sciences (AREA)
- General Physics & Mathematics (AREA)
- Immunology (AREA)
- Pathology (AREA)
- Investigating Or Analysing Biological Materials (AREA)
- Measuring Or Testing Involving Enzymes Or Micro-Organisms (AREA)
Applications Claiming Priority (5)
| Application Number | Priority Date | Filing Date | Title |
|---|---|---|---|
| GBGB9526649.0A GB9526649D0 (en) | 1995-12-29 | 1995-12-29 | Method for testing a cell sample |
| GB9526649 | 1995-12-29 | ||
| GBGB9526720.9A GB9526720D0 (en) | 1995-12-29 | 1995-12-29 | Method for testing a cell sample |
| GB9526720 | 1995-12-29 | ||
| EP96944117A EP0870187B1 (de) | 1995-12-29 | 1996-12-27 | Verfahren zum testen einer zellprobe |
Related Parent Applications (1)
| Application Number | Title | Priority Date | Filing Date |
|---|---|---|---|
| EP96944117A Division EP0870187B1 (de) | 1995-12-29 | 1996-12-27 | Verfahren zum testen einer zellprobe |
Publications (3)
| Publication Number | Publication Date |
|---|---|
| EP1180678A2 true EP1180678A2 (de) | 2002-02-20 |
| EP1180678A3 EP1180678A3 (de) | 2004-01-14 |
| EP1180678B1 EP1180678B1 (de) | 2005-11-02 |
Family
ID=26308401
Family Applications (2)
| Application Number | Title | Priority Date | Filing Date |
|---|---|---|---|
| EP01123393A Expired - Lifetime EP1180678B1 (de) | 1995-12-29 | 1996-12-27 | Verfahren zur Untersuchung einer Zellprobe |
| EP96944117A Expired - Lifetime EP0870187B1 (de) | 1995-12-29 | 1996-12-27 | Verfahren zum testen einer zellprobe |
Family Applications After (1)
| Application Number | Title | Priority Date | Filing Date |
|---|---|---|---|
| EP96944117A Expired - Lifetime EP0870187B1 (de) | 1995-12-29 | 1996-12-27 | Verfahren zum testen einer zellprobe |
Country Status (8)
| Country | Link |
|---|---|
| US (1) | US6422065B1 (de) |
| EP (2) | EP1180678B1 (de) |
| JP (1) | JP4160117B2 (de) |
| AT (2) | ATE224050T1 (de) |
| AU (1) | AU714953B2 (de) |
| CA (1) | CA2240573C (de) |
| DE (2) | DE69623650T2 (de) |
| WO (1) | WO1997024601A1 (de) |
Families Citing this family (15)
| Publication number | Priority date | Publication date | Assignee | Title |
|---|---|---|---|---|
| GB9828765D0 (en) * | 1998-12-29 | 1999-02-17 | Shine Thomas A | A method of testing a cell sample |
| NZ506590A (en) | 1998-12-29 | 2002-10-25 | Thomas Adam Shine | A method of analysing a sample of free cells |
| US7542131B2 (en) * | 2003-06-23 | 2009-06-02 | Sewon Meditech, Inc. | Apparatus for measuring blood cell deformability |
| US8372600B2 (en) | 2004-03-05 | 2013-02-12 | The Research Foundation Of State University Of New York | Method and apparatus for measuring changes in cell volume |
| US20050239046A1 (en) * | 2004-03-05 | 2005-10-27 | The Research Foundation Of State University Of New York | Method and apparatus for measuring changes in cell volume |
| ITUD20050118A1 (it) * | 2005-07-13 | 2007-01-14 | Sire Analytical Systems Srl | Procedimento per la taratura di macchine per l' analisi di parametri del sangue connessi alla densita' del sangue, quali la velocita' di eritrosedimentazione e/o di aggregazione dei globuli rossi |
| US7614302B2 (en) * | 2005-08-01 | 2009-11-10 | Baker Hughes Incorporated | Acoustic fluid analysis method |
| US7523640B2 (en) * | 2005-08-01 | 2009-04-28 | Baker Hughes Incorporated | Acoustic fluid analyzer |
| EP2064312B1 (de) * | 2006-09-29 | 2021-03-24 | The Administrators of the Tulane Educational Fund | Verfahren und vorrichtungen für simultane überwachung der eigenschaften mikroskopischer suspensionspartikel und der eigenschaften löslicher bestandteile während des ablaufes von reaktionen |
| CN103091232B (zh) * | 2011-10-31 | 2015-09-30 | 深圳迈瑞生物医疗电子股份有限公司 | 粒子分析仪及其粒子测试控制方法、装置 |
| CA3121784A1 (en) * | 2018-12-05 | 2020-06-11 | Thomas Adam Shine | Cell scanning technologies and methods of use thereof |
| CA3136353A1 (en) * | 2019-04-11 | 2020-10-15 | Ian Basil Shine | Cell membrane permeability restoring therapy |
| EP3958859A4 (de) | 2019-04-22 | 2023-04-12 | Ian Basil Shine | Vorbeugung und behandlung von malaria |
| US20230010400A1 (en) | 2019-12-04 | 2023-01-12 | Ian Basil Shine | Improved methods and devices for measuring cell numbers and/or cell properties |
| DK202330198A1 (da) * | 2023-09-07 | 2025-04-03 | Shaya Michael | Fremgangsmåde og apparat til automatisk detektering af forskellige celletyper, herunder kræftceller, i organisk væv |
Family Cites Families (26)
| Publication number | Priority date | Publication date | Assignee | Title |
|---|---|---|---|---|
| US3502412A (en) | 1967-10-16 | 1970-03-24 | Abbott Lab | Method and apparatus for measuring osmotic fragility of red blood cells by constantly reducing the concentration of the saline solution suspending the cells |
| CA988319A (en) * | 1973-10-11 | 1976-05-04 | Tomas Hirschfeld | System for differentiating particles |
| US3851246A (en) | 1973-11-26 | 1974-11-26 | Us Navy | Method of predicting the post transfusion viability of preserved erythrocytes and other similar cells |
| GB1481480A (en) | 1974-02-02 | 1977-07-27 | Kernforschungsanlage Juelich | Process and apparatus for increasing the permeability of the membrane of cells of organisms |
| DE2739834C2 (de) | 1977-09-03 | 1981-12-03 | Wigo Gottlob Widmann & Söhne GmbH und Co KG, 7730 Villingen-Schwenningen | Gerät zum Bereiten von Kaffee oder Tee |
| US4271001A (en) | 1978-03-23 | 1981-06-02 | Asahi Kasei Kogyo Kabushiki Kaisha | Apparatus for measuring membrane characteristics of vesicles |
| US4343782A (en) * | 1978-04-20 | 1982-08-10 | Shapiro Howard M | Cytological assay procedure |
| US4240027A (en) | 1978-08-31 | 1980-12-16 | The United States Of America As Represented By The Secretary Of The Army | Electromagnetic method for the noninvasive analysis of cell membrane physiology and pharmacology |
| US4298836A (en) * | 1979-11-23 | 1981-11-03 | Coulter Electronics, Inc. | Particle shape determination |
| US4278936A (en) | 1980-02-05 | 1981-07-14 | Coulter Electronics, Inc. | Biological cell parameter change test method and apparatus |
| US4374644A (en) * | 1981-04-06 | 1983-02-22 | Coulter Electronics, Inc. | Blood cell volume monitoring |
| US4535284A (en) | 1981-07-10 | 1985-08-13 | Coulter Electronics, Inc. | High and low frequency analysis of osmotic stress of cells |
| DE3215719C2 (de) * | 1982-04-28 | 1984-01-26 | Holger Dr. 5100 Aachen Kiesewetter | Meßeinrichtung zur Messung des Verformungsvermögens von roten Blutkörperchen |
| US4525666A (en) | 1982-05-03 | 1985-06-25 | Coulter Electronics, Inc. | Cell breakdown |
| US4528274A (en) * | 1982-07-06 | 1985-07-09 | Coulter Electronics, Inc. | Multi-purpose blood diluent and lysing agent for differential determination of lymphoid-myeloid population of leukocytes |
| GB8408529D0 (en) * | 1984-04-03 | 1984-05-16 | Health Lab Service Board | Concentration of biological particles |
| US4791355A (en) * | 1986-10-21 | 1988-12-13 | Coulter Electronics Inc. | Particle analyzer for measuring the resistance and reactance of a particle |
| US5223398A (en) * | 1987-03-13 | 1993-06-29 | Coulter Corporation | Method for screening cells or formed bodies for enumeration of populations expressing selected characteristics |
| JP2667867B2 (ja) * | 1988-03-30 | 1997-10-27 | 東亜医用電子株式会社 | 粒子解析装置 |
| US5006460A (en) * | 1988-05-26 | 1991-04-09 | Pantox Corporation | Method for measuring DNA damage in single cells |
| JP2799191B2 (ja) * | 1989-08-24 | 1998-09-17 | オリンパス光学工業株式会社 | 細胞内イオンの2次元濃度分布像を形成する方法 |
| US5548661A (en) * | 1991-07-12 | 1996-08-20 | Price; Jeffrey H. | Operator independent image cytometer |
| JP2565844B2 (ja) * | 1992-02-07 | 1996-12-18 | アボツト・ラボラトリーズ | 細胞溶解処理条件下で異種細胞集団を正確に計数し,感受性に関する格付けを行う方法 |
| US5369014A (en) * | 1992-08-17 | 1994-11-29 | Beth Israel Hospital Assoc. | In-vitro method for determining a surreptitious use of exogenous erythropoiesis stimulating agents by a normal living subject |
| US5532139A (en) | 1992-10-30 | 1996-07-02 | Micro-Med, Inc. | Micro lysis-analysis process to measure cell characteristics and diagnose diseases |
| US5595866A (en) | 1994-05-27 | 1997-01-21 | Methodist Hospital Of Indiana, Inc. | Step-wise method to remove cryoprotectant from sperm |
-
1996
- 1996-12-27 EP EP01123393A patent/EP1180678B1/de not_active Expired - Lifetime
- 1996-12-27 EP EP96944117A patent/EP0870187B1/de not_active Expired - Lifetime
- 1996-12-27 DE DE69623650T patent/DE69623650T2/de not_active Expired - Lifetime
- 1996-12-27 AU AU13847/97A patent/AU714953B2/en not_active Expired
- 1996-12-27 AT AT96944117T patent/ATE224050T1/de not_active IP Right Cessation
- 1996-12-27 AT AT01123393T patent/ATE308746T1/de not_active IP Right Cessation
- 1996-12-27 CA CA002240573A patent/CA2240573C/en not_active Expired - Lifetime
- 1996-12-27 DE DE69635391T patent/DE69635391T2/de not_active Expired - Lifetime
- 1996-12-27 JP JP52411697A patent/JP4160117B2/ja not_active Expired - Lifetime
- 1996-12-27 WO PCT/GB1996/003257 patent/WO1997024601A1/en not_active Ceased
- 1996-12-27 US US09/101,013 patent/US6422065B1/en not_active Expired - Fee Related
Also Published As
| Publication number | Publication date |
|---|---|
| DE69623650T2 (de) | 2003-02-13 |
| JP4160117B2 (ja) | 2008-10-01 |
| EP1180678A3 (de) | 2004-01-14 |
| US6422065B1 (en) | 2002-07-23 |
| JP2000502797A (ja) | 2000-03-07 |
| EP0870187B1 (de) | 2002-09-11 |
| CA2240573C (en) | 2004-11-09 |
| ATE308746T1 (de) | 2005-11-15 |
| DE69623650D1 (de) | 2002-10-17 |
| CA2240573A1 (en) | 1997-07-10 |
| AU714953B2 (en) | 2000-01-13 |
| AU1384797A (en) | 1997-07-28 |
| EP1180678B1 (de) | 2005-11-02 |
| DE69635391T2 (de) | 2006-08-03 |
| US20020035879A1 (en) | 2002-03-28 |
| ATE224050T1 (de) | 2002-09-15 |
| WO1997024601A1 (en) | 1997-07-10 |
| EP0870187A1 (de) | 1998-10-14 |
| DE69635391D1 (de) | 2005-12-08 |
Similar Documents
| Publication | Publication Date | Title |
|---|---|---|
| EP1180678B1 (de) | Verfahren zur Untersuchung einer Zellprobe | |
| KR100834588B1 (ko) | 정액 분석 | |
| US20140273076A1 (en) | Dynamic range extension systems and methods for particle analysis in blood samples | |
| JPH0352573B2 (de) | ||
| JP2015522165A (ja) | 白血球数の測定方法及び測定装置 | |
| Mundschenk et al. | An improved technique for the electronic measurement of platelet size and shape | |
| Lines | The electrical sensing zone method (the Coulter principle) | |
| US6668229B1 (en) | Method for testing a cell sample | |
| JP5314145B2 (ja) | 生体データの分類、可視化並びに探索の方法及び装置 | |
| Lombarts et al. | Basic principles and problems of haemocytometry | |
| US20210341371A1 (en) | Cell scanning technologies and methods of use thereof | |
| EP2322910B1 (de) | Ein Verfahren zur Analyse freier Zellen | |
| Ćwiklińska et al. | The results of external quality assessment programme on urine leukocyte and erythrocyte counting in Poland | |
| CN115053117B (zh) | 具有阻抗信号处理功能的医学分析设备 | |
| CN101140228B (zh) | 精液分析 | |
| Dondelinger | Hematology analyzers | |
| Dayhoff et al. | Examination of the dynamics of platelet aggregation and disaggregation using computerized image analysis |
Legal Events
| Date | Code | Title | Description |
|---|---|---|---|
| PUAI | Public reference made under article 153(3) epc to a published international application that has entered the european phase |
Free format text: ORIGINAL CODE: 0009012 |
|
| AC | Divisional application: reference to earlier application |
Ref document number: 870187 Country of ref document: EP |
|
| AK | Designated contracting states |
Kind code of ref document: A2 Designated state(s): AT BE CH DE DK ES FI FR GB GR IE IT LI LU MC NL PT SE |
|
| PUAL | Search report despatched |
Free format text: ORIGINAL CODE: 0009013 |
|
| AK | Designated contracting states |
Kind code of ref document: A3 Designated state(s): AT BE CH DE DK ES FI FR GB GR IE IT LI LU MC NL PT SE |
|
| RIC1 | Information provided on ipc code assigned before grant |
Ipc: 7G 01N 33/50 B Ipc: 7G 01N 15/10 A |
|
| 17P | Request for examination filed |
Effective date: 20040708 |
|
| AKX | Designation fees paid |
Designated state(s): AT BE CH DE DK ES FI FR GB GR IE IT LI LU MC NL PT SE |
|
| GRAP | Despatch of communication of intention to grant a patent |
Free format text: ORIGINAL CODE: EPIDOSNIGR1 |
|
| GRAS | Grant fee paid |
Free format text: ORIGINAL CODE: EPIDOSNIGR3 |
|
| GRAA | (expected) grant |
Free format text: ORIGINAL CODE: 0009210 |
|
| AC | Divisional application: reference to earlier application |
Ref document number: 0870187 Country of ref document: EP Kind code of ref document: P |
|
| AK | Designated contracting states |
Kind code of ref document: B1 Designated state(s): AT BE CH DE DK ES FI FR GB GR IE IT LI LU MC NL PT SE |
|
| PG25 | Lapsed in a contracting state [announced via postgrant information from national office to epo] |
Ref country code: IT Free format text: LAPSE BECAUSE OF FAILURE TO SUBMIT A TRANSLATION OF THE DESCRIPTION OR TO PAY THE FEE WITHIN THE PRESCRIBED TIME-LIMIT;WARNING: LAPSES OF ITALIAN PATENTS WITH EFFECTIVE DATE BEFORE 2007 MAY HAVE OCCURRED AT ANY TIME BEFORE 2007. THE CORRECT EFFECTIVE DATE MAY BE DIFFERENT FROM THE ONE RECORDED. Effective date: 20051102 Ref country code: AT Free format text: LAPSE BECAUSE OF FAILURE TO SUBMIT A TRANSLATION OF THE DESCRIPTION OR TO PAY THE FEE WITHIN THE PRESCRIBED TIME-LIMIT Effective date: 20051102 Ref country code: BE Free format text: LAPSE BECAUSE OF FAILURE TO SUBMIT A TRANSLATION OF THE DESCRIPTION OR TO PAY THE FEE WITHIN THE PRESCRIBED TIME-LIMIT Effective date: 20051102 Ref country code: FI Free format text: LAPSE BECAUSE OF FAILURE TO SUBMIT A TRANSLATION OF THE DESCRIPTION OR TO PAY THE FEE WITHIN THE PRESCRIBED TIME-LIMIT Effective date: 20051102 Ref country code: LI Free format text: LAPSE BECAUSE OF FAILURE TO SUBMIT A TRANSLATION OF THE DESCRIPTION OR TO PAY THE FEE WITHIN THE PRESCRIBED TIME-LIMIT Effective date: 20051102 Ref country code: CH Free format text: LAPSE BECAUSE OF FAILURE TO SUBMIT A TRANSLATION OF THE DESCRIPTION OR TO PAY THE FEE WITHIN THE PRESCRIBED TIME-LIMIT Effective date: 20051102 Ref country code: NL Free format text: LAPSE BECAUSE OF FAILURE TO SUBMIT A TRANSLATION OF THE DESCRIPTION OR TO PAY THE FEE WITHIN THE PRESCRIBED TIME-LIMIT Effective date: 20051102 |
|
| REG | Reference to a national code |
Ref country code: GB Ref legal event code: FG4D |
|
| REG | Reference to a national code |
Ref country code: CH Ref legal event code: EP |
|
| REF | Corresponds to: |
Ref document number: 69635391 Country of ref document: DE Date of ref document: 20051208 Kind code of ref document: P |
|
| PG25 | Lapsed in a contracting state [announced via postgrant information from national office to epo] |
Ref country code: IE Free format text: LAPSE BECAUSE OF NON-PAYMENT OF DUE FEES Effective date: 20051229 |
|
| PG25 | Lapsed in a contracting state [announced via postgrant information from national office to epo] |
Ref country code: MC Free format text: LAPSE BECAUSE OF NON-PAYMENT OF DUE FEES Effective date: 20051231 |
|
| PG25 | Lapsed in a contracting state [announced via postgrant information from national office to epo] |
Ref country code: LU Free format text: LAPSE BECAUSE OF NON-PAYMENT OF DUE FEES Effective date: 20060102 |
|
| PG25 | Lapsed in a contracting state [announced via postgrant information from national office to epo] |
Ref country code: DK Free format text: LAPSE BECAUSE OF FAILURE TO SUBMIT A TRANSLATION OF THE DESCRIPTION OR TO PAY THE FEE WITHIN THE PRESCRIBED TIME-LIMIT Effective date: 20060202 Ref country code: SE Free format text: LAPSE BECAUSE OF FAILURE TO SUBMIT A TRANSLATION OF THE DESCRIPTION OR TO PAY THE FEE WITHIN THE PRESCRIBED TIME-LIMIT Effective date: 20060202 Ref country code: GR Free format text: LAPSE BECAUSE OF FAILURE TO SUBMIT A TRANSLATION OF THE DESCRIPTION OR TO PAY THE FEE WITHIN THE PRESCRIBED TIME-LIMIT Effective date: 20060202 |
|
| PG25 | Lapsed in a contracting state [announced via postgrant information from national office to epo] |
Ref country code: ES Free format text: LAPSE BECAUSE OF FAILURE TO SUBMIT A TRANSLATION OF THE DESCRIPTION OR TO PAY THE FEE WITHIN THE PRESCRIBED TIME-LIMIT Effective date: 20060213 |
|
| PG25 | Lapsed in a contracting state [announced via postgrant information from national office to epo] |
Ref country code: PT Free format text: LAPSE BECAUSE OF FAILURE TO SUBMIT A TRANSLATION OF THE DESCRIPTION OR TO PAY THE FEE WITHIN THE PRESCRIBED TIME-LIMIT Effective date: 20060403 |
|
| NLV1 | Nl: lapsed or annulled due to failure to fulfill the requirements of art. 29p and 29m of the patents act | ||
| REG | Reference to a national code |
Ref country code: CH Ref legal event code: PL |
|
| ET | Fr: translation filed | ||
| PLBE | No opposition filed within time limit |
Free format text: ORIGINAL CODE: 0009261 |
|
| STAA | Information on the status of an ep patent application or granted ep patent |
Free format text: STATUS: NO OPPOSITION FILED WITHIN TIME LIMIT |
|
| REG | Reference to a national code |
Ref country code: IE Ref legal event code: MM4A |
|
| 26N | No opposition filed |
Effective date: 20060803 |
|
| REG | Reference to a national code |
Ref country code: FR Ref legal event code: PLFP Year of fee payment: 20 |
|
| PGFP | Annual fee paid to national office [announced via postgrant information from national office to epo] |
Ref country code: GB Payment date: 20151223 Year of fee payment: 20 |
|
| PGFP | Annual fee paid to national office [announced via postgrant information from national office to epo] |
Ref country code: FR Payment date: 20151110 Year of fee payment: 20 |
|
| PGFP | Annual fee paid to national office [announced via postgrant information from national office to epo] |
Ref country code: DE Payment date: 20151222 Year of fee payment: 20 |
|
| REG | Reference to a national code |
Ref country code: DE Ref legal event code: R071 Ref document number: 69635391 Country of ref document: DE |
|
| REG | Reference to a national code |
Ref country code: GB Ref legal event code: PE20 Expiry date: 20161226 |
|
| PG25 | Lapsed in a contracting state [announced via postgrant information from national office to epo] |
Ref country code: GB Free format text: LAPSE BECAUSE OF EXPIRATION OF PROTECTION Effective date: 20161226 |