EP1205143A2 - Verfahren und Vorrichtung zur Darstellung von physiologischen Patientendaten - Google Patents
Verfahren und Vorrichtung zur Darstellung von physiologischen Patientendaten Download PDFInfo
- Publication number
- EP1205143A2 EP1205143A2 EP01309548A EP01309548A EP1205143A2 EP 1205143 A2 EP1205143 A2 EP 1205143A2 EP 01309548 A EP01309548 A EP 01309548A EP 01309548 A EP01309548 A EP 01309548A EP 1205143 A2 EP1205143 A2 EP 1205143A2
- Authority
- EP
- European Patent Office
- Prior art keywords
- data
- physiological
- waveform
- patient data
- displaying
- Prior art date
- Legal status (The legal status is an assumption and is not a legal conclusion. Google has not performed a legal analysis and makes no representation as to the accuracy of the status listed.)
- Ceased
Links
Images


Classifications
-
- A—HUMAN NECESSITIES
- A61—MEDICAL OR VETERINARY SCIENCE; HYGIENE
- A61B—DIAGNOSIS; SURGERY; IDENTIFICATION
- A61B5/00—Measuring for diagnostic purposes; Identification of persons
- A61B5/24—Detecting, measuring or recording bioelectric or biomagnetic signals of the body or parts thereof
- A61B5/316—Modalities, i.e. specific diagnostic methods
- A61B5/318—Heart-related electrical modalities, e.g. electrocardiography [ECG]
- A61B5/339—Displays specially adapted therefor
Definitions
- the invention relates to a method and apparatus for displaying physiological patient data from a cyclic physiological waveform, and particularly, to a method and apparatus for displaying physiological patient data from a cyclic physiological waveform in a colorized three-dimensional representation.
- Medical patient monitors are typically employed by physicians and other health care providers to monitor the physiological data of patients in operating rooms, intensive care units and emergency rooms, and for conducting long-term trend monitoring such as Holter monitoring or stress testing.
- An array of sensors are typically connected to the patient to acquire the various physiological data. These data are then displayed on the screen of a monitor either in graphical or numerical form. These data may also be recorded or displayed on analog or digital strip chart recorders, spreadsheets and plotting programs.
- the invention provides a method of displaying physiological and/or pathological patient data from a cyclic physiological or pathological waveform.
- physiological data or “physiological patient data” shall be broadly defined as including pathological data, or any other type of patient information that is capable of being displayed using the invention.
- the method includes acquiring the physiological patient data, storing the physiological patient data in a waveform array, and displaying the physiological patient data on a display with a color component that is capable of plotting a three dimensional representation of the data.
- the display represents a three dimensional graph by stacking two dimensional waveforms offset of each other to denote perspective or depth.
- This method of displaying allows the operator to view a two dimensional image that represents a three dimensional image.
- the "X coordinate” shall denote the respective position of each data point with respect to time
- the "Y coordinate” shall denote the amplitude of each data point
- the "Z coordinate” shall denote the respective temporal alignment, or offset position of each successive waveform.
- the step of displaying the physiological patient data includes parsing the waveform array into a series of successive waveforms such that each successive waveform is plotted in a temporal alignment to allow easy detection of long term trends in physiological data, parsing each successive waveform into a series of successive data points such that each data point is plotted at a representative X coordinate, Y coordinate, and Z coordinate, and assigning a color (which may be a shade of gray in the case of a black and white monitor or a variation in intensity in the case of a monochrome monitor) according to the amplitude of the data point.
- the waveform array may be physiological data that represents individual physiological cycles such as heart beats, or the waveform array may be data that has been aggregated in some fashion such as averaging or filtering, or reduction to a median complex.
- the invention also provides an apparatus for acquiring and displaying physiological patient data.
- the apparatus includes a sensor or a transducer for acquiring physiological patient data from a patient, a processor for receiving the physiological patient data, storing the physiological data in a waveform array, and for generating a waveform display on a display.
- the processor parses the waveform array into a series of successive waveforms, and assigns each successive waveform a respective Z coordinate.
- the processor also divides each waveform into a series of successive data points and assigns each data point a respective X coordinate.
- the processor assigns a color (which may be a shade of gray in the case of a black and white monitor, or a variation in intensity in the case of a monochrome monitor) according to the Y coordinate of the data point and plots the data point on the display monitor so that the pixel at the respective coordinate is energized using that color.
- a color which may be a shade of gray in the case of a black and white monitor, or a variation in intensity in the case of a monochrome monitor
- Fig. 1 illustrates the patient monitoring system 10 of the invention.
- the patient monitoring system 10 acquires and displays physiological patient data from a cyclic physiological waveform. While the monitoring system 10 can be used in connection with any kind of clinical environment, in the preferred embodiment, the monitoring system 10 is for conducting long-term trend monitoring such as in Holter monitoring or stress testing.
- Monitoring system 10 is coupled to the patient 14 by an array of sensors or transducers which may include, for example, electrodes 18 mounted on the patient's chest for determining electrocardiogram and heart rate, an oximetry sensor 22 mounted on the patient's finger for measuring hemoglobin oxygen saturation, a catheter 26 for measuring hemoglobin oxygen saturation in the vena cava in the central venus pressure, an arterial canula 30 for measuring arterial systolic and diastolic pressures, flow meter 34 and a pressure sensor 38 in the endotrachial tube 42 for measuring trachial gas flow, and airway pressure, respectively, and sensors 46 in the patient's mask 50 for measuring the volume percentage of oxygen and CO 2 in the patient's mouth.
- sensors or transducers may include, for example, electrodes 18 mounted on the patient's chest for determining electrocardiogram and heart rate, an oximetry sensor 22 mounted on the patient's finger for measuring hemoglobin oxygen saturation, a catheter 26 for measuring hemoglobin oxygen saturation in the vena cava in the central venus
- the signals derived from the sensors are converted from analog form to digital form by the analog to digital converter 54 and are then provided to a processor 58 that prepares the data for display on display monitor 62.
- the monitor is a conventional computer-style display monitor having a generally rectangular cathode ray tube or CRT (not shown).
- the CRT includes a plurality of pixels. As is known in the art, each pixel is capable of being energized electronically so that the pixel emits light visible to the user of the monitoring system.
- the display monitor 12 is capable of displaying full color pixels, i.e., the display monitor is an RGB color monitor capable of displaying 256 colors or more. In other embodiments however, a black and white display capable of showing black, white and a plurality of gray shades (preferably no less than 64) in between is acceptable.
- color as used in this application is used to indicate either true color or shades of gray as described above unless the context indicates otherwise. Also, while any physiological patient data may be displayed in the format of the preferred embodiment, the invention will be discussed in the context of displaying long-term electrocardiogram ("ECG”) data.
- ECG electrocardiogram
- the ECG data is subjected to (input 2) a software program that averages or "incrementally” averages the data to produce a series of median waveform complexes.
- These median waveform complexes are often separated and visually stacked on a display to provide an easily viewable representation of a significant amount of ECG data.
- FIG. 2 illustrates a flowchart of a method embodying the invention.
- the waveforms (or in the case of the preferred embodiment, the median waveform complexes) are stored in a waveform array, are processed by the software routine stored in the processor 58, and are displayed on the display monitor 62 in a quasi-three-dimensional color display.
- the display includes x, y, and z axes where the x-axis coordinate represents the data point of a given median waveform complex, the y-axis coordinate represents the amplitude of the data point, and the z-axis coordinate represents the median waveform complex.
- the software increments the x coordinate value by one in order to read the next data point and then reads the amplitude of that data point 400.
- the software sets the variable (END POINT) to be the incremented xyz coordinate 500.
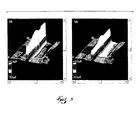
- the processor then draws two triangles between the data points and colors the triangles based on the amplitude color-code 600. While any color code can be used, including gray scale and variations in intensity, the color code of the preferred embodiment is illustrated in Figs. 3(a) and 3(b) in the lower left hand comer of these figures. As shown in Figs. 3(a) and 3(b), the color-code establishes a different color for amplitude values ranging between negative 0.5 millivolts and positive 0.5 millivolts.
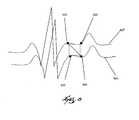
- the software program draws the triangles by establishing a quadrilateral around the START POINT and END POINT variables, 610 and 620, respectively, of the present median beat 625, and the START POINT and END POINT variables 630 and 640, respectively, of the previous median beat 645 with the same X-coordinate value as the START POINT and END POINT variables 610 and 620 (see Fig. 8).
- the software dissects the quadrilateral by establishing a line between the START POINT variable 610 and the END POINT variable 640.
- the color is then set for the display based on the amplitude value of the START POINT variable 610 using the amplitude color-code.
- the software then changes the START POINT variable to END POINT variable 700, and determines whether the data point is the last data point of the present median beat or median complex 800. If not, the software program returns to set the START POINT variable 300 and repeats process steps 300 through 800 until the last data point of the median beat is analyzed. At that point, the software program increments the z coordinate to read the next median beat 900. The software program then determines alternatively whether the median beat is the last median beat of the stress test or whether the data point being analyzed is the last data point of the data set 1000. If not, the software program repeats the process starting at act 200. If so, the software process ends.
- the color scheme of the monitoring system 10 is fully configurable. That is, the user can select any color to represent a given amplitude.
- the monitoring system 10 is programmed to provide the user with a set of manufacturer defined color schemes.
- the successive waveforms are plotted in a stacked colorized representation to provide a perspective or representative three dimensional view of the physiological patient data over an extended period of time.
- This presentation highlights subtle trends that may exist in the data, but are difficult to observe with ordinary display presentations.
- the representative three dimensional view of the data can be rotated by the processor so that it can be viewed on the display by the user from different perspectives.
- the use of color to enhance this display allows easy detection by the clinician of significant aspects of the data, for example, the yellow and orange portions of the data displayed in Fig. 3 indicate a significant S-T depression in the ECG data.
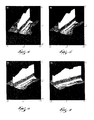
- Figs. 4 - 7 illustrate how the representative three dimensional view of the data can be rotated by the processor so that it can be viewed on the display by the user from different perspectives.
- the processor rotates the representative three dimensional image by rotating the X, Y, and Z axes.
- the operator is able to more easily characterize different segments of the median waveforms. For example, when using median ECG waveforms, the operator may be able to more easily characterize the difference in amplitudes of the median waveforms using a view similar to Fig. 7.
- the operator may rotate the image a full 360 degrees in order to view each side of the image.
Landscapes
- Health & Medical Sciences (AREA)
- Life Sciences & Earth Sciences (AREA)
- Molecular Biology (AREA)
- Surgery (AREA)
- Biophysics (AREA)
- Pathology (AREA)
- Engineering & Computer Science (AREA)
- Biomedical Technology (AREA)
- Heart & Thoracic Surgery (AREA)
- Medical Informatics (AREA)
- Cardiology (AREA)
- Physics & Mathematics (AREA)
- Animal Behavior & Ethology (AREA)
- General Health & Medical Sciences (AREA)
- Public Health (AREA)
- Veterinary Medicine (AREA)
- Measuring And Recording Apparatus For Diagnosis (AREA)
- Measurement And Recording Of Electrical Phenomena And Electrical Characteristics Of The Living Body (AREA)
- Apparatus For Radiation Diagnosis (AREA)
- Magnetic Resonance Imaging Apparatus (AREA)
Applications Claiming Priority (2)
| Application Number | Priority Date | Filing Date | Title |
|---|---|---|---|
| US711691 | 2000-11-13 | ||
| US09/711,691 US6967652B1 (en) | 2000-11-13 | 2000-11-13 | Method and apparatus for displaying physiological patient data |
Publications (2)
| Publication Number | Publication Date |
|---|---|
| EP1205143A2 true EP1205143A2 (de) | 2002-05-15 |
| EP1205143A3 EP1205143A3 (de) | 2003-08-06 |
Family
ID=24859118
Family Applications (1)
| Application Number | Title | Priority Date | Filing Date |
|---|---|---|---|
| EP01309548A Ceased EP1205143A3 (de) | 2000-11-13 | 2001-11-13 | Verfahren und Vorrichtung zur Darstellung von physiologischen Patientendaten |
Country Status (2)
| Country | Link |
|---|---|
| US (1) | US6967652B1 (de) |
| EP (1) | EP1205143A3 (de) |
Cited By (3)
| Publication number | Priority date | Publication date | Assignee | Title |
|---|---|---|---|---|
| US8089349B2 (en) | 2005-07-18 | 2012-01-03 | Diego Giuseppe Tognola | Signal process and system |
| US20220223276A1 (en) * | 2012-04-16 | 2022-07-14 | Airstrip Ip Holdings, Llc | Systems and methods for and displaying patient data |
| US12026811B2 (en) | 2012-04-16 | 2024-07-02 | Airstrip Ip Holdings, Llc | Systems and methods for displaying patient data |
Families Citing this family (16)
| Publication number | Priority date | Publication date | Assignee | Title |
|---|---|---|---|---|
| US7187966B2 (en) * | 2004-04-15 | 2007-03-06 | Ge Medical Systems Information Technologies, Inc. | Method and apparatus for displaying alternans data |
| US7555327B2 (en) | 2005-09-30 | 2009-06-30 | Nellcor Puritan Bennett Llc | Folding medical sensor and technique for using the same |
| US7483731B2 (en) | 2005-09-30 | 2009-01-27 | Nellcor Puritan Bennett Llc | Medical sensor and technique for using the same |
| US7881762B2 (en) | 2005-09-30 | 2011-02-01 | Nellcor Puritan Bennett Llc | Clip-style medical sensor and technique for using the same |
| US20070244721A1 (en) * | 2005-10-31 | 2007-10-18 | Sackner-Bernstein Jonathan D | Systems and methods for improved assessment and reporting of the efficacy and safety of drug, biologic, botanical, vitamin, medical food and medical device treatments |
| US8073518B2 (en) * | 2006-05-02 | 2011-12-06 | Nellcor Puritan Bennett Llc | Clip-style medical sensor and technique for using the same |
| US8145288B2 (en) | 2006-08-22 | 2012-03-27 | Nellcor Puritan Bennett Llc | Medical sensor for reducing signal artifacts and technique for using the same |
| US8754889B2 (en) * | 2009-03-18 | 2014-06-17 | National Instruments Corporation | Cursor synchronization in a plurality of graphs |
| US8515510B2 (en) * | 2009-03-31 | 2013-08-20 | Covidien Lp | Electroadhesive medical devices |
| US20110021936A1 (en) * | 2009-07-24 | 2011-01-27 | Shen Luo | Medical data display with 3-D and 2-D color mapping |
| USD649972S1 (en) | 2009-07-24 | 2011-12-06 | Cardiac Science Corporation | Display screen with user interface for medical data |
| JP2019511334A (ja) | 2016-04-12 | 2019-04-25 | アイセンティア インク | 医療電極用接着性エキステンダ及び着用可能監視装置によるその使用 |
| US11521740B2 (en) * | 2018-06-06 | 2022-12-06 | International Business Machines Corporation | Natural language processing of a motion alphabet for unsupervised clinical scoring |
| US10891766B1 (en) | 2019-09-04 | 2021-01-12 | Google Llc | Artistic representation of digital data |
| US11464460B2 (en) * | 2019-10-21 | 2022-10-11 | Pratyush Pavan Devarasetty | Systems, devices, and methods for detecting physical distress in infant tracheostomy patients |
| KR102886210B1 (ko) * | 2022-07-13 | 2025-11-14 | 주식회사 메디컬에이아이 | 심전도 판독에 기반한 시각화 콘텐츠를 제공하는 방법, 프로그램 및 장치 |
Family Cites Families (18)
| Publication number | Priority date | Publication date | Assignee | Title |
|---|---|---|---|---|
| US3585988A (en) * | 1968-11-20 | 1971-06-22 | Minnesota Mining & Mfg | Arrhythmia recording and control system and method of operation |
| US3638066A (en) | 1970-08-21 | 1972-01-25 | Thomas O Paine | Contourograph system for monitoring electrocardiograms |
| US4175264A (en) * | 1975-03-06 | 1979-11-20 | Peter Schiff | Electronic synchronizer-monitor system for controlling the timing of mechanical assistance and pacing of the heart |
| FR2414235A1 (fr) | 1978-01-10 | 1979-08-03 | Aerazur Const Electro | Procede de depouillement sur oscilloscope de trains de signaux normalement repetitifs |
| US5121470A (en) * | 1990-02-01 | 1992-06-09 | Intellimetrics Instrument Corporation | Automated interactive record system |
| US5109862A (en) | 1990-03-19 | 1992-05-05 | Del Mar Avionics | Method and apparatus for spectral analysis of electrocardiographic signals |
| US5348020A (en) | 1990-12-14 | 1994-09-20 | Hutson William H | Method and system for near real-time analysis and display of electrocardiographic signals |
| US5956013A (en) | 1992-02-28 | 1999-09-21 | Hewlett-Packard Company | Method and apparatus for synchronizing a continuous ECG waveform display with a display of superimposed heartbeats |
| US5361776A (en) * | 1993-08-06 | 1994-11-08 | Telectronics Pacing Systems, Inc. | Time domain reflectometer impedance sensor method of use and implantable cardiac stimulator using same |
| US5622178A (en) | 1994-05-04 | 1997-04-22 | Spacelabs Medical, Inc. | System and method for dynamically displaying cardiac interval data using scatter-plots |
| SE508285C2 (sv) | 1994-06-07 | 1998-09-21 | Biosys Ab | Metod och anordning för bedömning av vakenhetsgrad och dåsighet i olika stadier mellan vakenhet och sömn på ett för en övervakad ej störande sätt |
| US6001060A (en) | 1996-06-04 | 1999-12-14 | Regents Of The University Of California | Video data representation of physiological data |
| WO1998002090A1 (en) * | 1996-07-17 | 1998-01-22 | Cambridge Heart, Inc. | Generation of localized cardiac measures |
| US5830150A (en) | 1996-09-18 | 1998-11-03 | Marquette Electronics, Inc. | Method and apparatus for displaying data |
| US5827195A (en) | 1997-05-09 | 1998-10-27 | Cambridge Heart, Inc. | Electrocardiogram noise reduction using multi-dimensional filtering |
| US5967994A (en) | 1998-03-26 | 1999-10-19 | Hewlett-Packard Company | Method and system for characterizing the quality of signals indicative of heart function |
| US6409659B1 (en) * | 1998-11-04 | 2002-06-25 | Ge Medical Systems Information Technologies, Inc. | Method and apparatus for displaying physiological patient data |
| US6558325B1 (en) * | 2000-07-13 | 2003-05-06 | Acuson Corporation | Medical diagnostic ultrasonic imaging method and system for displaying multi-phase, multi-frame images |
-
2000
- 2000-11-13 US US09/711,691 patent/US6967652B1/en not_active Expired - Fee Related
-
2001
- 2001-11-13 EP EP01309548A patent/EP1205143A3/de not_active Ceased
Non-Patent Citations (1)
| Title |
|---|
| "Matlab Function Reference (Volume 2: Graphics), Version 5 (Matlab 5.2)", January 1998, THE MATHWORKS, ONLINE * |
Cited By (6)
| Publication number | Priority date | Publication date | Assignee | Title |
|---|---|---|---|---|
| US8089349B2 (en) | 2005-07-18 | 2012-01-03 | Diego Giuseppe Tognola | Signal process and system |
| US20220223276A1 (en) * | 2012-04-16 | 2022-07-14 | Airstrip Ip Holdings, Llc | Systems and methods for and displaying patient data |
| US12026811B2 (en) | 2012-04-16 | 2024-07-02 | Airstrip Ip Holdings, Llc | Systems and methods for displaying patient data |
| US12033754B2 (en) * | 2012-04-16 | 2024-07-09 | Airstrip Ip Holdings, Llc | Systems and methods for and displaying patient data |
| US20240321446A1 (en) * | 2012-04-16 | 2024-09-26 | Airstrip Ip Holdings, Llc | Systems and methods for and displaying patient data |
| US12482562B2 (en) | 2012-04-16 | 2025-11-25 | Airstrip Ip Holdings, Llc | Systems and methods for and displaying patient data |
Also Published As
| Publication number | Publication date |
|---|---|
| US6967652B1 (en) | 2005-11-22 |
| EP1205143A3 (de) | 2003-08-06 |
Similar Documents
| Publication | Publication Date | Title |
|---|---|---|
| US6967652B1 (en) | Method and apparatus for displaying physiological patient data | |
| US6409659B1 (en) | Method and apparatus for displaying physiological patient data | |
| JP6339677B2 (ja) | 長期生理的信号品質インジケーションに関する方法及びディスプレイ | |
| US6694178B1 (en) | Method and device for representing and monitoring functional parameters of a physiological system | |
| US20110021936A1 (en) | Medical data display with 3-D and 2-D color mapping | |
| CN102038495B (zh) | 生物参数显示装置 | |
| JP4141133B2 (ja) | 周期的データを表示する装置及び方法 | |
| JP3887798B2 (ja) | 生体情報表示方法及び生体情報表示装置 | |
| JP2003513693A (ja) | 心筋分析とモニタリングの方法及び装置 | |
| GB2479055A (en) | Graphical display of medical information | |
| EP3821807A1 (de) | Medizinisches überwachungsverfahren | |
| JPH02226073A (ja) | 2個の情報信号に含まれる情報の表示を相関させる方法および装置 | |
| US20120302905A1 (en) | Method, apparatus and computer program product for monitoring physiological signals | |
| US10950018B2 (en) | Interpolation of dynamic three-dimensional maps | |
| US6273855B1 (en) | Method and device for compressed optical representation of medical data | |
| WO2020133429A1 (zh) | 监护方法、监护仪及计算机存储介质 | |
| US7187966B2 (en) | Method and apparatus for displaying alternans data | |
| US7698234B2 (en) | Cardiac perfusion analysis | |
| CN105520723A (zh) | 生命体征测量装置、生命体征显示方法和程序 | |
| EP0932138B1 (de) | Verfahren zur Korrektur des durch eine unterabtastende Routine induzierten Phasenfehlers | |
| CN113662555A (zh) | 绘制方法、分析方法、绘制装置、移动终端及存储介质 | |
| CN117690575A (zh) | 一种基于增强现实的远程诊疗及时交互方法及系统 | |
| US7125381B2 (en) | Method of correcting for phase error induced by a down sampling routine | |
| Hennigs et al. | Towards a digital twin based monitoring tool for ventilated patients | |
| JP2834057B2 (ja) | 心電図解析装置 |
Legal Events
| Date | Code | Title | Description |
|---|---|---|---|
| PUAI | Public reference made under article 153(3) epc to a published international application that has entered the european phase |
Free format text: ORIGINAL CODE: 0009012 |
|
| AK | Designated contracting states |
Kind code of ref document: A2 Designated state(s): AT BE CH CY DE DK ES FI FR GB GR IE IT LI LU MC NL PT SE TR |
|
| AX | Request for extension of the european patent |
Free format text: AL;LT;LV;MK;RO;SI |
|
| PUAL | Search report despatched |
Free format text: ORIGINAL CODE: 0009013 |
|
| AK | Designated contracting states |
Designated state(s): AT BE CH CY DE DK ES FI FR GB GR IE IT LI LU MC NL PT SE TR |
|
| AX | Request for extension of the european patent |
Extension state: AL LT LV MK RO SI |
|
| RIC1 | Information provided on ipc code assigned before grant |
Ipc: 7G 06F 17/00 B Ipc: 7A 61B 5/044 A |
|
| 17P | Request for examination filed |
Effective date: 20040206 |
|
| AKX | Designation fees paid |
Designated state(s): DE FR GB |
|
| 17Q | First examination report despatched |
Effective date: 20040727 |
|
| 17Q | First examination report despatched |
Effective date: 20040727 |
|
| STAA | Information on the status of an ep patent application or granted ep patent |
Free format text: STATUS: THE APPLICATION HAS BEEN REFUSED |
|
| 18R | Application refused |
Effective date: 20080516 |