EP1221041B1 - Spectroscopie par impedance a haute resolution temporelle - Google Patents
Spectroscopie par impedance a haute resolution temporelle Download PDFInfo
- Publication number
- EP1221041B1 EP1221041B1 EP00967070A EP00967070A EP1221041B1 EP 1221041 B1 EP1221041 B1 EP 1221041B1 EP 00967070 A EP00967070 A EP 00967070A EP 00967070 A EP00967070 A EP 00967070A EP 1221041 B1 EP1221041 B1 EP 1221041B1
- Authority
- EP
- European Patent Office
- Prior art keywords
- time
- signal
- impedance
- spectra
- perturbation signal
- Prior art date
- Legal status (The legal status is an assumption and is not a legal conclusion. Google has not performed a legal analysis and makes no representation as to the accuracy of the status listed.)
- Expired - Lifetime
Links
- 238000001566 impedance spectroscopy Methods 0.000 title claims description 47
- 238000001453 impedance spectrum Methods 0.000 claims description 64
- 238000000034 method Methods 0.000 claims description 61
- 238000001228 spectrum Methods 0.000 claims description 29
- 230000009466 transformation Effects 0.000 claims description 26
- 230000004044 response Effects 0.000 claims description 20
- 230000008569 process Effects 0.000 claims description 16
- 238000004458 analytical method Methods 0.000 claims description 14
- 238000012545 processing Methods 0.000 claims description 10
- 238000005070 sampling Methods 0.000 claims description 5
- 239000007788 liquid Substances 0.000 claims description 3
- 230000006870 function Effects 0.000 description 25
- 238000005259 measurement Methods 0.000 description 23
- 108090000862 Ion Channels Proteins 0.000 description 12
- 102000004310 Ion Channels Human genes 0.000 description 12
- 239000012528 membrane Substances 0.000 description 11
- 238000012935 Averaging Methods 0.000 description 10
- 238000004088 simulation Methods 0.000 description 8
- 238000011835 investigation Methods 0.000 description 6
- 238000005457 optimization Methods 0.000 description 6
- 230000008901 benefit Effects 0.000 description 5
- 239000000758 substrate Substances 0.000 description 5
- 238000012360 testing method Methods 0.000 description 5
- 108091006146 Channels Proteins 0.000 description 4
- 150000002632 lipids Chemical class 0.000 description 4
- 239000004065 semiconductor Substances 0.000 description 4
- 230000003595 spectral effect Effects 0.000 description 4
- 230000006399 behavior Effects 0.000 description 3
- 238000006243 chemical reaction Methods 0.000 description 3
- 238000013500 data storage Methods 0.000 description 3
- 238000010586 diagram Methods 0.000 description 3
- 238000009826 distribution Methods 0.000 description 3
- 230000000694 effects Effects 0.000 description 3
- 238000000157 electrochemical-induced impedance spectroscopy Methods 0.000 description 3
- 238000011156 evaluation Methods 0.000 description 3
- 230000010355 oscillation Effects 0.000 description 3
- 230000005654 stationary process Effects 0.000 description 3
- 230000001052 transient effect Effects 0.000 description 3
- 230000007704 transition Effects 0.000 description 3
- 239000000232 Lipid Bilayer Substances 0.000 description 2
- 238000012512 characterization method Methods 0.000 description 2
- 238000005260 corrosion Methods 0.000 description 2
- 230000007797 corrosion Effects 0.000 description 2
- 238000007405 data analysis Methods 0.000 description 2
- 238000011157 data evaluation Methods 0.000 description 2
- 230000005518 electrochemistry Effects 0.000 description 2
- 230000005284 excitation Effects 0.000 description 2
- 230000002349 favourable effect Effects 0.000 description 2
- 239000011244 liquid electrolyte Substances 0.000 description 2
- 239000002184 metal Substances 0.000 description 2
- 239000007784 solid electrolyte Substances 0.000 description 2
- 238000009827 uniform distribution Methods 0.000 description 2
- XUIMIQQOPSSXEZ-UHFFFAOYSA-N Silicon Chemical compound [Si] XUIMIQQOPSSXEZ-UHFFFAOYSA-N 0.000 description 1
- 230000031018 biological processes and functions Effects 0.000 description 1
- 230000015572 biosynthetic process Effects 0.000 description 1
- 239000003990 capacitor Substances 0.000 description 1
- 230000008859 change Effects 0.000 description 1
- 230000008878 coupling Effects 0.000 description 1
- 238000010168 coupling process Methods 0.000 description 1
- 238000005859 coupling reaction Methods 0.000 description 1
- 238000002848 electrochemical method Methods 0.000 description 1
- 238000005516 engineering process Methods 0.000 description 1
- 238000005530 etching Methods 0.000 description 1
- 230000001747 exhibiting effect Effects 0.000 description 1
- 230000007274 generation of a signal involved in cell-cell signaling Effects 0.000 description 1
- 238000002847 impedance measurement Methods 0.000 description 1
- 230000006872 improvement Effects 0.000 description 1
- 238000011065 in-situ storage Methods 0.000 description 1
- 230000001788 irregular Effects 0.000 description 1
- 230000004807 localization Effects 0.000 description 1
- 239000000463 material Substances 0.000 description 1
- 238000013208 measuring procedure Methods 0.000 description 1
- 238000012576 optical tweezer Methods 0.000 description 1
- 230000035479 physiological effects, processes and functions Effects 0.000 description 1
- 229920006254 polymer film Polymers 0.000 description 1
- 229920005597 polymer membrane Polymers 0.000 description 1
- 102000004169 proteins and genes Human genes 0.000 description 1
- 108090000623 proteins and genes Proteins 0.000 description 1
- 239000010453 quartz Substances 0.000 description 1
- 238000006479 redox reaction Methods 0.000 description 1
- 230000009467 reduction Effects 0.000 description 1
- 238000011160 research Methods 0.000 description 1
- 230000000717 retained effect Effects 0.000 description 1
- 229910052710 silicon Inorganic materials 0.000 description 1
- 239000010703 silicon Substances 0.000 description 1
- VYPSYNLAJGMNEJ-UHFFFAOYSA-N silicon dioxide Inorganic materials O=[Si]=O VYPSYNLAJGMNEJ-UHFFFAOYSA-N 0.000 description 1
- 238000001179 sorption measurement Methods 0.000 description 1
- 230000003068 static effect Effects 0.000 description 1
- 238000003860 storage Methods 0.000 description 1
- 239000000126 substance Substances 0.000 description 1
- 239000010409 thin film Substances 0.000 description 1
Images



Classifications
-
- G—PHYSICS
- G01—MEASURING; TESTING
- G01R—MEASURING ELECTRIC VARIABLES; MEASURING MAGNETIC VARIABLES
- G01R27/00—Arrangements for measuring resistance, reactance, impedance, or electric characteristics derived therefrom
- G01R27/02—Measuring real or complex resistance, reactance, impedance, or other two-pole characteristics derived therefrom, e.g. time constant
-
- G—PHYSICS
- G01—MEASURING; TESTING
- G01N—INVESTIGATING OR ANALYSING MATERIALS BY DETERMINING THEIR CHEMICAL OR PHYSICAL PROPERTIES
- G01N27/00—Investigating or analysing materials by the use of electric, electrochemical, or magnetic means
- G01N27/02—Investigating or analysing materials by the use of electric, electrochemical, or magnetic means by investigating impedance
- G01N27/026—Dielectric impedance spectroscopy
-
- G—PHYSICS
- G01—MEASURING; TESTING
- G01R—MEASURING ELECTRIC VARIABLES; MEASURING MAGNETIC VARIABLES
- G01R23/00—Arrangements for measuring frequencies; Arrangements for analysing frequency spectra
- G01R23/16—Spectrum analysis; Fourier analysis
Definitions
- This invention relates generally to the measurement of electrical impedance and, more particularly, to electrochemical impedance spectroscopy.
- Impedance spectroscopy is a procedure used to characterize the electrical and electrochemical properties of investigated systems, and their changes over time.
- an a.c. voltage signal is applied between a working electrode and a counter electrode. If applicable, a simultaneously applied d.c. bias voltage is monitored with a reference electrode. Both the applied a.c. voltage signal, as well as the current response of the system, are measured.
- the complex electrical resistance (termed the impedance Z( ⁇ )) of a system can be calculated as a function of the frequency from the quotients of the voltage and current signals in the frequency domain according to equation (1).
- the impedance values for a number of frequencies define the impedance spectrum.
- Z ⁇ U ⁇ ⁇ I ⁇ ⁇ .
- impedance spectroscopy is a standard analysis technique for investigating e.g. corrosion processes, redox reactions, liquid and solid electrolytes, thin polymer films, membranes and batteries.
- Impedance spectroscopy is also used to characterize semiconductor materials. See A. Bard: Electrochemical Methods. (Wiley & Sons, New York: 1980 ); and in biotechnology. See B. A. Georgia, Braach-Maksvytis, L. G. King et al.: “A Biosensor that Uses Ion-Channel Switches.” Nature. 387, p.580-583 (1997 ). S. Gritsch, P. Nollert, F. Jahnig et al.: "Impedance Spectroscopy of Porin and Gramicidin Pores Reconstituted into Supported Lipid Bilayers on Indium-Tin-Oxide Electrodes.” Langmuir.
- impedance spectroscopy has increased greatly, particularly in the field of biotechnology.
- the electrodes are modified by chemical or physical coupling of biofunctional molecules and aggregates (e.g. lipid/protein membranes). Impedance spectroscopy is also used to detect adsorption processes.
- Method I frequency domain procedure: In the first form, a sinusoidal signal at a constant frequency and amplitude is applied within a discrete period, and the complex impedance of this discrete frequency is determined. To obtain a spectrum, sequential signals at different frequencies are applied. The time resolution, defined as the length of time in which the determined spectra follow each other, is low in this form of impedance spectroscopy. The time for acquiring the data records that compose the spectrum is a multiple of the period of the lowest frequency contained in the spectrum. The precise duration also depends on the number of the frequencies in the spectrum. Following a frequency change, a transition period is allowed for the system to attain an equilibrium. The time resolution of a typical sequence of spectra is a few seconds to minutes depending on the observed frequency band.
- Method II time domain procedure: In the second form, a frequency rich a.c. voltage signal is applied such as square wave pulses, structured or white noise.
- the impedance spectrum can be determined from a single data record of the time course of the voltage and current signal. Therefore, the impedance spectrum is limited regarding the bandwidth and frequency resolution by the known limitations of Fourier transformation.
- the measurement time is normally at least as long as one period of the lowest frequency in the spectrum of interest. Usually a measuring period of several periods of the lowest frequency in the spectrum is required to sufficiently improve the signal to noise ratio.
- the maximum time resolution depends on the repetition rate at which the data records, or sets, for Fourier transformation are acquired. Because the impedance of all frequencies of the spectrum are measured simultaneously in this method, the time resolution is usually much better than that of the first method.
- Method I is normally used to characterize stationary systems or systems exhibiting slow dynamics.
- Commercial devices frequency response analyzers (FRA)
- FFA frequency response analyzers
- method II is primarily used for measurements where the impedance spectra contain very low frequencies, for example, down to about 10 -4 Hz, as required in corrosion studies.
- the electrical properties of non-stationary systems which means systems whose properties are not constant over time, cannot be measured in many cases with a sufficient time resolution by either Method I or Method II procedures of impedance spectroscopy.
- the time averaging effect of method I (summing for several periods of all the frequencies in the spectrum) and method II (over several periods of the lowest frequency contained in the spectrum) does not allow changes in the system over time, which are faster than the averaging time, to be resolved by a sequence of impedance spectra.
- the averaging time must be greatly reduced for impedance spectrometers to measure non-stationary systems with sufficient time resolution.
- a single impedance spectrum would then indicate the electrical states of the system localized in time.
- the individual spectra must be determined with high repetition rate to determine the time course of the system-characterizing quantities with a maximum time resolution.
- lipid bilayer membranes with integrated, switching ion channels An example of a non-stationary system that have not been able to be measured with conventional impedance spectroscopy includes lipid bilayer membranes with integrated, switching ion channels.
- the kinetics of many biological processes such as opening and closing ion channels in lipid bilayer membranes occurs on a time scale of a few milliseconds.
- the present invention provides a method for measuring impedance, and impedance spectra in rapid sequence as described in claim 1, and an apparatus for measuring impedance and impedance spectra in rapid sequence as described in claim 2.
- Measurement of impedance, and impedance spectra, in rapid sequence provides repeated or continuous characterization of the electrical properties of the system under investigation.
- Highly time resolved impedance spectroscopy enhances the measurement of the dynamics of non-stationary systems due to its enhanced time resolution.
- Three aspects of highly time resolved impedance spectroscopy are: (1) an optimized, frequency rich a.c., or transient, voltage signal is used as the perturbation signal; (2) non-stationary time to frequency transformation algorithms are used when processing the measured time signals of the voltage U(t) and current I(t) to determine a sequence of impedance spectra, where each spectrum is localized in time; and (3) the system-characterizing quantities are determined from the impedance spectra using equivalent circuit fitting in a time-resolution-optimized form.
- Highly time resolved impedance spectroscopy is able to measure the dynamics of non-stationary systems with enhanced time resolution.
- Three aspects of highly time resolved impedance spectroscopy are: (1) an optimized, frequency rich a.c., or transient, voltage signal is used as the perturbation signal; (2) non-stationary time to frequency transformation algorithms are used when processing the measured time signals of the voltage U(t) and current I(t) to determine a sequence of impedance spectra, where each spectrum is localized in time; and (3) the system-characterizing quantities are determined from the impedance spectra using equivalent circuit fitting in a time-resolution-optimized form.
- the optimized frequency rich perturbation signal may be of many different formats.
- a frequency rich perturbation signal may contain any desired amount of contributing frequencies which are superimposed in one signal.
- a frequency rich perturbation signal may be the superposition of a specific number of sinusoidal oscillations, or voltage jumps, pulses, and noise signals. The higher the signal to noise ratio of the voltage perturbation and the current response signal, the lower the time expansion of the database that is required to attain a certain measuring precision.
- Structured noise may be used as the perturbation signal for highly time resolved impedance spectroscopy. Structured noise is defined as the superposition of of a finite number of sinusoidal oscillations.
- Figure 1 is a plot versus time of an example of a structured noise voltage signal U(t) (18).
- Figure 2 is a power spectrum density plot of a structured noise voltage and current signals U(f) (20) and I(f) (22).
- the structured noise illustrated in Figures 1 and 2 can be represented mathematically by equation (2):
- U o, i is the amplitude of the i-th sinusoidal oscillation with angular frequency ⁇ i and ⁇ i is the phase.
- a favorable signal to noise ratio may be obtained when the perturbation signal U(t) is tuned, or optimized, to the system and the focus of measurement. Optimization of perturbation signals has been the subject of some research. See G. S. Popkirov and R. N. Schindler: "A New Impedance Spectrometer for the Investigation of Electrochemical Systems.” Rev. Sci. Instrum. 63 (11), 5366-5372 (1992 ).; G. S. Popkirov and R. N. Schindler: "Optimization of the Perturbation Signal for Electrochemical Impedance Spectroscopy in the Time Domain.” Rev. Sci. Instrum. 64 (11), 3111-3115 (1993 ).
- Numerous optimization steps are an aspect of highly time resolved impedance spectroscopy including: the frequency band in which the impedance is measured; the number and frequency, amplitude and phase of the individual contributing frequencies.
- optimization of the perturbation signal includes selection of the frequency band in which the impedance spectrum is measured. Therefore, the frequency band of the perturbation signal should be selected to include the maximum spectral range to be covered by the measurement. However, when evaluating the impedance spectra one can use just selected frequencies of the n frequencies in the perturbation signal. This aspect is discussed further below.
- Optimization of the perturbation signal may also include selecting a desired number (n) and frequency position ( ⁇ i ) of the n individual contributing frequencies. Any desired number and frequency positions of the individual frequencies can be used. This maximizes for the user the adaptability of the high time resolution impedance spectrometer to the system under investigation.
- the power applied by a structured noise signal to the sample depends on the number of the frequencies in the noise signal. Because many systems exhibit linear behavior only with small amplitude or low power perturbation, it is desirable to keep the number of frequencies as low as possible. On the other hand, the reproduction of the characteristic system response requires a minimum number of frequencies in the impedance spectrum. Because in impedance spectroscopy the impedance is usually determined over several orders of magnitude of the frequency, a desired number of individual frequencies per frequency decade is selected, if special system requirements do not require deviating from this desired number. In one embodiment, five individual frequencies per frequency decade is a suitable number.
- the distribution of the frequency position of the individual frequencies is selected in a logarithmic uniform distribution over the entire frequency band. In another embodiment, the distribution of the frequency position of the individual frequencies selected is varied from a logarithmic uniform distribution in a manner to avoid the formation of harmonics. Preventing harmonics helps to prevent the corruption of the measured impedance spectra by nonlinear system responses or the excitation of higher harmonics.
- the amplitude U o,i of the individual frequencies is the amplitude U o,i of the individual frequencies. Any desired amplitude of the individual frequencies may be selected.
- the amplitudes of the individual frequencies are adapted to the measuring situation.
- the amplitudes of the individual frequencies in the perturbation signal are such that the power of the individual frequencies in the perturbation signal is constant (good for use with strongly nonlinear systems).
- the power of the current response of the excited individual frequencies is constant (reduction of the influence of non-linearity of the measuring amplifier, see Figure. 2 ).
- the power of the individual frequencies of the perturbation signal and the current response reveals minimal differences (optimum signal to noise ratio).
- phase ⁇ i of the individual frequencies is the phase ⁇ i of the individual frequencies. Any desired phase angle of the individual frequencies may be selected.
- a linear system response maybe ensured by the lowest possible overall amplitude of the perturbation signal.
- the phases of the individual frequencies in the structured noise are selected so that the overall amplitude of the signal is minimal while the amplitudes of the individual frequencies remain the same. Hence the power of the individual frequencies is retained despite reduced overall amplitude, or the power of the individual frequencies is maximized and the signal to noise ratio is improved, as the overall amplitude remains fixed.
- An aspect of highly time resolved impedance spectroscopy is the determination of impedance spectra, which are localized in time, with reduced averaging time in high repetition rate.
- Non-stationary time to frequency transformation algorithms are used in highly time resolved impedance spectroscopy.
- the averaging time corresponds to the prolongation of the database that is required for determining an individual impedance spectrum.
- Sequences of spectra X( ⁇ ), which are localized in time are determined from the time signals X(t) by applying window functions spanning a small period of time of the measuring signal X(t) (either U(t) or I(t)) and repeating this procedure, applying window functions shifted by brief, or short, intervals.
- the time signals including the a.c.
- a partly continuously recorded data set may be defined as a repeated recording of finite data sets of any length with arbitrary, or selected, interruption intervals between consecutive data sets.
- non-stationary, time to frequency transformation procedures include sliding short time Fourier transform, wavelet transformation and Wigner or Wigner-Ville distribution. Two of these methods will be described further below: (1) sliding short time Fourier transform; and (2) wavelet transformation.
- x(t) corresponds to the measured time signal
- g(t) is a window function whose characteristic is adjusted to optimize the spectrum X( ⁇ , ⁇ ) that is obtained as a result of the transformation step.
- the resulting impedance spectrum Z( ⁇ , ⁇ ) is obtained according to equation (1) from the quotients of the spectra of the voltage signal U( ⁇ , ⁇ ) and the current signal I( ⁇ , ⁇ ).
- This impedance spectrum is assigned to the time ⁇ , that is, it characterizes the investigated sample at time ⁇ of the measurement.
- the spectral information is hence localized at time ⁇ by considering, and weighting, only a section of the overall data record around time ⁇ for the time to frequency transformation.
- a sequence of impedance spectra is obtained by repeatedly calculating impedance spectra according to the described procedure where the time ⁇ shifts by interval ⁇ for each of the subsequent spectra.
- Figure 3 is a plot illustrating examples of a sequence of the real (32) and imaginary (34) impedance spectra as a function of the frequency fand the time ⁇ for a non-stationary system.
- the measured data records are completely analyzed when ⁇ is shifted as much as possible by interval ⁇ in the data record from the start of measurement. If the interval ⁇ is smaller than the prolongation of the window function g(t), one speaks of sliding short time Fourier transform since the window functions g(t- ⁇ ) applied to the data records overlap within the sequence.
- the interval ⁇ in which the window function shifts between each transformation defines the time resolution of the procedure.
- ⁇ must be correspondingly small.
- the time over which g(t) is not zero must be as small as possible to reduce the time averaging in the time to frequency transformation.
- T a is the sampling interval for data acquisition
- n the running variable for the number of observed data points
- N the total number of data points. All other quantities correspond to the definition in continuous short time Fourier transform.
- the shift interval ⁇ typically.is a whole-number multiple of T a .
- the frequency resolution ⁇ f and the upper frequency limit f max in each impedance spectrum are subject to the sampling theorem expressed in equation (6). See E. Schrufer: Signal kau. (Hanser, Kunststoff: 1990 ).
- ⁇ ⁇ f 1 N w ⁇ T o
- f max 1 2 ⁇ T a .
- N w is the number of data points above which the window function g(nT a ) is not zero.
- ⁇ 0 corresponds to the modulation frequency of the basic, or prototype, wavelet.
- the highly time resolved impedance spectroscopy offers many advantages over conventional impedance spectroscopy including the use of reduced impedance spectra.
- the impedance spectra obtained by short time Fourier transformation e.g. intrinsically includes N w /2 + 1 frequencies which can be reduced to the n frequencies that are contributing to the structured noise.
- the discrete algorithms only provide impedance values for discrete equidistant frequencies, frequencies are selected that are closest to the excited frequencies. This step eliminates most of the background noise of the measurement from the impedance spectra. Only the frequencies with the best signal to noise ratio are contributing to the impedance spectra, allowing the use of window functions which span a smaller period of time, resulting in a lower averaging time for the spectral information.
- the spectra may be analyzed by adapting suitable equivalent circuit models to determine the system-characteristic quantities and their time course.
- the elements that compose the equivalent circuits are derived from physical models for the dominant processes occurring in the system and frequently correspond to the behavior of ideal electrical components such as resistors, capacitors and inductors.
- distinct processes dominate the impedance response of the system in different ranges of frequencies.
- highly time resolved impedance spectroscopy either the measured and reduced impedance spectra are evaluated completely or in certain ranges of the spectra. In principle, you can determine whether or not each frequency contributing to the reduced impedance spectrum is used for evaluation.
- An advantage of highly time resolved impedance spectroscopy is the possibility of multiple analyses of the same data records with different analysis parameters, e.g. time resolutions ⁇ .
- first impedance spectra are determined with a longer window function leading to a long averaging time and a low time resolution, and therefore the reduced impedance spectra can be evaluated completely.
- the parameters of the stationary, i.e., constant processes are hence determined with a high degree of precision.
- the impedance spectra with a shorter window function, leading to a short averaging time and high time resolution, are determined in another analyses of the same data records.
- the spectra are evaluated, only the areas of reduced spectra are used that characterize the dynamic non-stationary processes, and the parameters for the static or stationary processes in the equivalent circuit are set to the previously-determined values.
- the complex impedance values can be represented in different forms.
- the reciprocal impedance (termed admittance) or related quantities can be used such as the complex frequency-dependant dielectric constant in both coordinate forms.
- the significance of individual processes in certain frequency ranges of the impedance spectra varies with the coordinate form used.
- highly time resolved impedance spectroscopy may use the electrical variables and coordinate form that significantly resolve the non-stationary processes in the highest frequency range. The higher the frequencies at which the investigated processes can be analyzed allows for the selection of a smaller time period spanned by the window functions and a smaller shift interval ⁇ for use in the sliding short time Fourier transform.
- a method for adapting the parameters of the equivalent circuit to the measured impedance spectra includes complex non linear least square fitting methods.
- a problem of the minimization algorithm for adapting the equivalent circuit to the impedance data e.g. Levenberg-Marquardt, Powell's minimization method in multidimensions
- Levenberg-Marquardt Powell's minimization method in multidimensions
- the algorithm frequently finds local minimums instead of the global minimum in the fitting. See W. H. Press, S. A. Teukolsky, W. T. Vetterling et al. Numerical Recipes in C (Cambridge University Press, New York, 1992 ).
- the procedure described above is not limited to electrical impedance and can be used to determine mechanical impedance spectra such as in rheological measuring methods, magnetic and optical tweezers, quartz resonance balances and acoustic impedance measurements as well as other procedures in which the frequency rich perturbation of a system is related to the system response.
- the embodiment describes a scenario that would facilitate the measurement, or determination, of the impedance of individual ion channels in supported lipid membranes, biomembranes.
- the impedance of natural or artificial, freely-suspended or substrated supported lipid membranes with or without ion channels may be measured.
- the substrates bear planar thin-film microelectrodes that are in multiple electrode arrangements, facilitating parallel and sequential multiplex measurements on the substrate.
- the substrates can be fabricated from, for example, silicon substrates with metal or semiconductor electrodes.
- the substrates may be mounted in an electrochemical cell, of either one or multiple measuring chambers, in which liquid can be exchanged by a manual, or automated, liquid handling and control system 64 ( Figure 5 ) with or without temperature control.
- Such a scenario corresponds to the measurement of an electrical two-terminal network that is simplified by the circuit depicted in Figure 4 .
- Figure 4 is a schematic of a typical equivalent circuit.
- the typical equivalent circuit of Figure 4 has a resistor R 1 (42) in series with the paralleled combination of resistor R 2a (44), R 2b (46) and C (48).
- a switch is in series with R 2a (44).
- the excitation voltage U(t) (50) is measured across the equivalent circuit, and the response current I(t) (52) flowing through the circuit is measured.
- Typical values of the components can be assumed to range from R 1 ⁇ 100 k ⁇ , R 2a , 2b ⁇ 1 G ⁇ and C ⁇ 6 pF. Switching rates for the switch can be assumed to be e.g. 50 Hz.
- FIG. 5 is a schematic representation of one embodiment.
- a structured noise of the a.c. voltage perturbation signal was calculated by a computer and sent to the memory of the multifunctional generator (54) (Analogic ® 2030A). This device generates the perturbation signal and feeds it into the patch clamp amplifier (56) (HEKA ® EPC8).
- the transitions between the discrete voltage steps should be small and smoothed because this reduces the level of background noise of the perturbation signal.
- the sampling rate at which the data record is output by the function generator should be greater by a factor of about ten than the largest frequency of interest in the impedance spectra.
- the perturbation signal can be filtered with a lowpass filter, with the corner frequency of the filter greater by a factor of about ten above the highest frequency of interest in the impedance spectra.
- the patch clamp amplifier (56) transmits the a.c. voltage perturbation signal via an external preamplifier (58) to the sample (60) under test.
- This preamplification unit simultaneously measures the actual a.c. voltage applied to the sample and the current response of the sample.
- the current signal is filtered, amplified and undergoes current to voltage conversion.
- Both time signals U(t) and I(t) can be monitored as voltage signals at the corresponding outputs of the patch clamp amplifier (56). Both signals are acquired by two channels of the A/D converter board (National Instruments Lab-NB) in a measuring computer (Apple Macintosh IIfx) and saved in data records on the computer data storage media.
- the software necessary to operate the setup includes two programs.
- the first program performs the data acquisition on the measuring computer with the A/D converter board. It includes the data analysis software Igor Pro ® (WaveMetrics) with an expansion package for data acquisition (NIDAQ Tools).
- the second program performs the signal processing and data analysis of the measured data records of U(t) and I(t). It is a custom-written C++ program for Macintosh and Windows operated PCs.
- the implemented algorithm of the sliding short time Fourier transform is based on a modified Cooley-Tukey FFT algorithm.
- FIG. 6 is a table that shows examples of parameters for the structured noise signal (66) and data processing (68) in the "Simulations" column.
- Figure 7 the time course (72) of the switchable parallel resistor R 2 is shown as it was assumed for the simulation (74) (continuous line) and as determined by highly time resolved impedance spectroscopy (76) (circle).
- Figure 8 shows one jump (82) in R 2 enlarged from Figure 7 .
- the analysis of the time course reveals, that in the absence of any signal corruption, the time course of the system-characterizing quantities determined by the short time Fourier transform corresponds to the convolution of the real (ideal) time course of this quantity with the window function used.
- the circuit in Figure 4 was assembled by using electronic components. Such a circuit forms a model sample, which mimics the behavior of individual ion channels in supported lipid membranes. These model samples were measured by highly time resolved impedance spectroscopy.
- Deviations from the absolute values of up to 20% result from the insufficiently compensated filter effects of the setup.
- the step-like changes of R 2 are reproduced well.
- the attained time resolution was 1.1.ms, and the rise time was 8 ms.
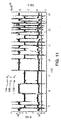
- Figure 10 (a) and (b) the real and negative imaginary part respectively of the underlying impedance spectra (112) and (104) for two points in the time courses of Figure 9 are shown. Not each of the contributing frequencies of the structured noise signal was used for the evaluation but just the limited range of 0.4-4 kHz.
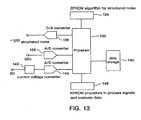
- FIG. 13 is a block diagram illustrating one embodiment of the highly time resolved impedance spectroscopy. As illustrated in Figure 13 , the basic setup for highly time resolved impedance spectroscopy requires just a few components.
- a main processor (132) unit controls signal generation and data acquisition on two channels.
- the data for the structured noise signal are generated by the processor unit according to a stored algorithm, stored in a memory device (134) and the voltage signal is applied to an output after a D to A converter (136).
- the measured voltage signal U(t) undergoes A to D conversion, at converter (138), at an input channel and is transferred to the memory.
- the current signal I(t) is received by a signal conditioner (142) and undergoes current to voltage conversion at an A to D converter (144).
- the output of the converter (144) is transferred to memory.
- the measured data of the voltage and current signal are processed and analyzed with a routine stored in a memory device (146), and the results are saved on the data storage media (140).
- the two memory devices (134) and (136) are the same memory device
- the use of the highly time resolved impedance spectroscopy has many advantages over conventional impedance spectroscopy. Some of the advantages include: substantial improvement in the time resolution of impedance spectroscopy; time resolution down to a fraction of each individual frequency in the impedance spectrum; continuous measurement with fast response times; real-time measurements; optimization of the measuring procedure by adapting the perturbation signal and the data processing and analysis to the investigated system; repeated analysis of the measured data records adapted to the focus of the evaluation; highly flexible technique; investigation of dynamic processes that previously could not be measured with impedance spectroscopy such as opening and closing individual ion channels on natural or artificial, free or supported membranes: and highly favorable signal to noise ratio.
Landscapes
- Physics & Mathematics (AREA)
- Chemical & Material Sciences (AREA)
- General Physics & Mathematics (AREA)
- Health & Medical Sciences (AREA)
- Chemical Kinetics & Catalysis (AREA)
- Electrochemistry (AREA)
- Spectroscopy & Molecular Physics (AREA)
- Life Sciences & Earth Sciences (AREA)
- Analytical Chemistry (AREA)
- Biochemistry (AREA)
- General Health & Medical Sciences (AREA)
- Immunology (AREA)
- Pathology (AREA)
- Investigating Or Analyzing Materials By The Use Of Electric Means (AREA)
- Measurement Of Resistance Or Impedance (AREA)
Claims (7)
- Procédé de spectroscopie d'impédances à haute résolution temporelle, comprenant :la génération d'un signal de perturbation en courant alternatif et son application à un système ;l'enregistrement du signal de perturbation en courant alternatif et d'un signal d'intensité en réponse au signal de perturbation produit dans un intervalle prédéterminé de temps comme un nombre entier d'échantillons de signal de perturbation en courant alternatif et d'échantillons de signal d'intensité, respectivement, obtenus à un intervalle Ta d'échantillonnage ; etla détermination d'une série de spectres de signal de perturbation en courant alternatif et de spectres de signal d'intensité en traitant de façon répétée les échantillons de signal enregistrés en utilisant une transformation non stationnaire de temps en fréquence dans un intervalle défini par une fonction fenêtre g(t), et le décalage de l'intervalle dans le temps, d'un décalage temporel Δτ, dans des répétitions successives pour obtenir la série respective de spectres de signal de perturbation et de spectres de signal d'intensité, dans lequel le décalage temporel Δτ est considérablement plus petit que l'intervalle défini par la fonction fenêtre g(t).
- Appareil destiné à mesurer des spectres d'impédances à haute résolution temporelle comprenant :un dispositif (134) de mémoire mémorisant un algorithme destiné à engendrer un signal de perturbation et des instructions pour traiter et évaluer des données mesurées selon le procédé de la revendication 1 ;au moins un convertisseur (138) d'analogique en numérique constitué pour recevoir un signal représentant un signal de perturbation et pour sortir des valeurs numériques représentant le signal de perturbation, et pour recevoir un signal représentant une réponse du système au signal de perturbation et pour sortir des valeurs numériques représentant la réponse du système ; etun processeur (132) constitué pour recevoir les valeurs numériques sorties par l'au moins un convertisseur (138) d'analogique en numérique, et pour recevoir, du dispositif de mémoire, l'algorithme et les instructions pour traiter et évaluer les données mesurées, et pour sortir un signal de perturbation et un spectre d'impédances, dans lequel les instructions pour traiter et évaluer les données mesurées sont basées sur une transformation non stationnaire de temps en fréquence qui est appliquée de façon répétée aux valeurs numériques représentant le signal de perturbation et la réponse du système avec des décalages temporels successifs qui sont considérablement plus courts qu'une durée associée aux valeurs numériques.
- Procédé selon la revendication 1, comprenant en outre l'étape d'utilisation d'un agencement à plusieurs électrodes.
- Procédé selon la revendication 1, comprenant en outre l'étape d'utilisation d'un système automatique de manipulation de liquides.
- Procédé selon la revendication 3, comprenant en outre l'étape d'utilisation d'un système à plusieurs chambres de mesures approprié pour acquisition et analyse de données en parallèle.
- Procédé selon la revendication 3, comprenant en outre l'étape d'utilisation d'un système à plusieurs chambres de mesures approprié pour acquisition et analyse séquentielles de données.
- Procédé selon la revendication 1, dans lequel le décalage temporel Δτ est un multiple entier de l'intervalle d'échantillonnage.
Applications Claiming Priority (5)
| Application Number | Priority Date | Filing Date | Title |
|---|---|---|---|
| DE19949107 | 1999-10-12 | ||
| DE19949107 | 1999-10-12 | ||
| DE10018745 | 2000-04-15 | ||
| DE10018745A DE10018745A1 (de) | 1999-10-12 | 2000-04-15 | Hoch-zeitauflösende Impedanzspektroskopie |
| PCT/US2000/026765 WO2001027605A1 (fr) | 1999-10-12 | 2000-09-29 | Spectroscopie par impedance a haute resolution temporelle |
Publications (2)
| Publication Number | Publication Date |
|---|---|
| EP1221041A1 EP1221041A1 (fr) | 2002-07-10 |
| EP1221041B1 true EP1221041B1 (fr) | 2010-01-20 |
Family
ID=26005324
Family Applications (1)
| Application Number | Title | Priority Date | Filing Date |
|---|---|---|---|
| EP00967070A Expired - Lifetime EP1221041B1 (fr) | 1999-10-12 | 2000-09-29 | Spectroscopie par impedance a haute resolution temporelle |
Country Status (6)
| Country | Link |
|---|---|
| US (2) | US6556001B1 (fr) |
| EP (1) | EP1221041B1 (fr) |
| JP (1) | JP2003511694A (fr) |
| AU (1) | AU777114B2 (fr) |
| CA (1) | CA2387998A1 (fr) |
| WO (1) | WO2001027605A1 (fr) |
Families Citing this family (58)
| Publication number | Priority date | Publication date | Assignee | Title |
|---|---|---|---|---|
| AUPQ113799A0 (en) | 1999-06-22 | 1999-07-15 | University Of Queensland, The | A method and device for measuring lymphoedema |
| US7505811B2 (en) * | 2001-11-19 | 2009-03-17 | Dune Medical Devices Ltd. | Method and apparatus for examining tissue for predefined target cells, particularly cancerous cells, and a probe useful in such method and apparatus |
| EP1471826B1 (fr) | 2002-02-08 | 2017-04-12 | Forstgarten International Holding GmbH | Appareil d'essai dental portable et son procédé d'utilisation |
| US6885960B2 (en) | 2002-02-25 | 2005-04-26 | Zyomyx, Inc. | Methods and devices for performing impedance spectroscopy |
| FR2842305B1 (fr) * | 2002-07-15 | 2004-10-01 | Inst Nat Polytech Grenoble | Procede de determination de l'independance d'un systeme electrochimique |
| AU2002951925A0 (en) * | 2002-10-09 | 2002-10-24 | Queensland University Of Technology | An Impedence Cardiography Device |
| US6911827B2 (en) * | 2002-10-21 | 2005-06-28 | Hewlett-Packard Development Company, L.P. | System and method of measuring low impedances |
| US20060275786A1 (en) * | 2003-03-05 | 2006-12-07 | Yi-Tao Long | Electrochemical detection of DNA binding |
| CA2516647A1 (fr) * | 2003-03-05 | 2004-09-16 | University Of Saskatchewan Technologies Inc. | Detection de mesappariement d'acides nucleiques |
| US8068906B2 (en) | 2004-06-21 | 2011-11-29 | Aorora Technologies Pty Ltd | Cardiac monitoring system |
| US8109981B2 (en) * | 2005-01-25 | 2012-02-07 | Valam Corporation | Optical therapies and devices |
| AU2006265761B2 (en) | 2005-07-01 | 2011-08-11 | Impedimed Limited | Monitoring system |
| EP2250963A3 (fr) * | 2005-07-01 | 2012-02-29 | Intersection Medical, Inc. | Système de surveillance des poumons |
| CA2609111C (fr) | 2005-07-01 | 2016-10-18 | Scott Chetham | Procede et appareil d'execution de mesures d'impedance en fonction de ladetermination d'une disposition d'electrode au moyen d'une representation affichee |
| EP1909642A1 (fr) * | 2005-07-20 | 2008-04-16 | Impedance Cardiology Systems Inc. | Determination d'indice |
| ES2476999T3 (es) | 2005-10-11 | 2014-07-15 | Impedimed Limited | Monitorización del estado de hidratación |
| CA2653406C (fr) | 2006-05-30 | 2015-03-17 | The University Of Queensland | Mesures d'impedance |
| WO2008064426A1 (fr) | 2006-11-30 | 2008-06-05 | Impedimed Limited | Appareil de mesure |
| CA2684324C (fr) | 2007-04-20 | 2017-05-30 | Impedimed Limited | Systeme et sonde de surveillance |
| WO2009018620A1 (fr) | 2007-08-09 | 2009-02-12 | Impedimed Limited | Mesure de l'impédance |
| US7877009B2 (en) * | 2007-12-20 | 2011-01-25 | 3M Innovative Properties Company | Method and system for electrochemical impedance spectroscopy |
| EP2262551A1 (fr) * | 2008-03-10 | 2010-12-22 | S.E.A. Medical Systems, Inc. | Contrôle de fluide intraveineux |
| FR2932893B1 (fr) * | 2008-06-23 | 2010-12-10 | Millipore Corp | Procede et dispositif de mesure de conductivite d'un liquide pur ou ultrapur. |
| WO2010016906A1 (fr) * | 2008-08-05 | 2010-02-11 | President And Fellows Of Harvard College | Procédés, appareils et systèmes permettant de déterminer la densité spectrale de puissance d’une modulation via signal du signal |
| WO2010037085A1 (fr) | 2008-09-29 | 2010-04-01 | The Board Of Trustees Of The University Of Illinois | Système de séquençage et d'amplification d'adn utilisant des batteries de détecteurs nanoscopiques à effet de champ |
| JP5616900B2 (ja) | 2008-11-28 | 2014-10-29 | インぺディメッド リミテッドImpedimed Limited | インピーダンス測定処理 |
| WO2010144482A2 (fr) * | 2009-06-08 | 2010-12-16 | S.E.A. Medical Systems, Inc. | Systèmes et procédés d'identification de composés dans des fluides médicaux à l'aide d'une spectroscopie d'admittance |
| US9052276B2 (en) | 2009-06-08 | 2015-06-09 | S.E.A. Medical Systems, Inc. | Systems and methods for the identification of compounds using admittance spectroscopy |
| US9376713B2 (en) * | 2009-09-23 | 2016-06-28 | The Board Of Trustees Of The University Of Illinois | Label free detection of nucleic acid amplification |
| JP5643829B2 (ja) | 2009-10-26 | 2014-12-17 | インぺディメッド リミテッドImpedimed Limited | インピーダンス測定の分析において用いるための方法及び装置 |
| AU2010321683B2 (en) | 2009-11-18 | 2014-06-26 | Impedimed Limited | Signal distribution for patient-electrode measurements |
| WO2011069997A2 (fr) * | 2009-12-09 | 2011-06-16 | Iti Scotland Limited | Détection d'analytes |
| US20110224909A1 (en) * | 2010-03-10 | 2011-09-15 | Sharp Laboratories Of America, Inc. | Signal processing technique for an impedance biosensor |
| US8296108B2 (en) * | 2010-04-02 | 2012-10-23 | Yugen Kaisha Suwa Torasuto | Time series data analyzer, and a computer-readable recording medium recording a time series data analysis program |
| MX2013002664A (es) | 2010-09-09 | 2013-04-19 | S E A Medical Systems Inc | Metodo y sistemas para el manejo de farmaco intravenoso utilizando espectroscopia de inmitancia. |
| US9488635B2 (en) * | 2010-12-21 | 2016-11-08 | The Hong Kong University Of Science And Technology | Pore structure analyzer based on non-contact impedance measurement for cement-based materials |
| US8700121B2 (en) | 2011-12-14 | 2014-04-15 | Intersection Medical, Inc. | Devices for determining the relative spatial change in subsurface resistivities across frequencies in tissue |
| US20130342211A1 (en) * | 2012-06-26 | 2013-12-26 | Schlumberger Technology Corporation | Impedance Spectroscopy Measurement Device And Methods For Analysis Of Live Reservoir Fluids And Assessment Of In-Situ Corrosion Of Multiple Alloys |
| US9658291B1 (en) | 2012-10-06 | 2017-05-23 | Hrl Laboratories, Llc | Methods and apparatus for dynamic estimation of battery open-circuit voltage |
| US9417290B1 (en) | 2012-10-06 | 2016-08-16 | Hrl Laboratories, Llc | Methods and apparatus for dynamic characterization of electrochemical systems |
| US9880061B2 (en) | 2013-06-14 | 2018-01-30 | Hrl Laboratories, Llc | Methods and apparatus for sensing the internal temperature of an electrochemical device |
| US10222426B2 (en) | 2013-06-14 | 2019-03-05 | Hrl Laboratories, Llc | Double-pulse technique for on-line diagnostics of electrochemical systems |
| US9847558B1 (en) | 2013-10-11 | 2017-12-19 | Hrl Laboratories, Llc | Methods and apparatus for real-time characterization of batteries with a reference electrode |
| US9742042B2 (en) | 2013-11-23 | 2017-08-22 | Hrl Laboratories, Llc | Voltage protection and health monitoring of batteries with reference electrodes |
| US10371753B1 (en) | 2013-12-20 | 2019-08-06 | Hrl Laboratories, Llc | Methods for online estimation of battery capacity and state of health |
| US9989595B1 (en) | 2013-12-31 | 2018-06-05 | Hrl Laboratories, Llc | Methods for on-line, high-accuracy estimation of battery state of power |
| JP6277864B2 (ja) * | 2014-05-26 | 2018-02-14 | 株式会社デンソー | 電池内部状態推定装置 |
| CN104950180B (zh) * | 2015-06-02 | 2018-10-30 | 国电南京自动化股份有限公司 | 基于eis的单体蓄电池内阻精确测量方法 |
| US10656233B2 (en) | 2016-04-25 | 2020-05-19 | Dynexus Technology, Inc. | Method of calibrating impedance measurements of a battery |
| WO2019077099A1 (fr) | 2017-10-19 | 2019-04-25 | Sanofi | Dispositif de mesure d'analyte |
| US11162913B2 (en) | 2019-03-21 | 2021-11-02 | Clemson University | Analysis of electrochemical impedance spectra using phase angle symmetry across log frequency |
| US12000902B2 (en) | 2019-05-02 | 2024-06-04 | Dynexus Technology, Inc. | Multispectral impedance determination under dynamic load conditions |
| EP3963345A4 (fr) * | 2019-05-02 | 2023-01-25 | Dynexus Technology, Inc. | Signal chirp d'excitation amélioré pour mesure d'impédance à large bande |
| US11422102B2 (en) | 2020-01-10 | 2022-08-23 | Dynexus Technology, Inc. | Multispectral impedance measurements across strings of interconnected cells |
| US11519969B2 (en) | 2020-01-29 | 2022-12-06 | Dynexus Technology, Inc. | Cross spectral impedance assessment for cell qualification |
| CN114280492B (zh) * | 2020-09-27 | 2024-10-11 | 比亚迪股份有限公司 | 电池电化学阻抗谱生成方法、系统、汽车及介质 |
| JP7807881B2 (ja) * | 2021-07-15 | 2026-01-28 | 株式会社Screenホールディングス | 信号処理装置、信号処理方法および信号処理プログラム |
| US12405312B2 (en) | 2023-09-26 | 2025-09-02 | Ford Global Technologies, Llc | Traction battery controller operable to control battery based on adaptive sampled electrochemical impedance spectroscopy battery measurements |
Family Cites Families (15)
| Publication number | Priority date | Publication date | Assignee | Title |
|---|---|---|---|---|
| US4099117A (en) * | 1976-04-26 | 1978-07-04 | Dick Gaut | Method and apparatus for measuring the quality of insulation on a buried pipeline and the quantity of metal oxide present at breaks in the insulation |
| US5006786A (en) * | 1984-02-02 | 1991-04-09 | Electric Power Research Institute, Inc. | Device for in situ monitoring of corrosion rates of polarized or unpolarized metals |
| US4658365A (en) * | 1984-02-02 | 1987-04-14 | Electric Power Research Institute, Inc. | Device for in-situ monitoring of corrosion rate of cathodically polarized metals |
| US4894376A (en) * | 1988-02-26 | 1990-01-16 | Trustees Of The University Of Pennsylvania | Methods of treating diseases characterized by hyperexcitability of neurons |
| US5112455A (en) * | 1990-07-20 | 1992-05-12 | I Stat Corporation | Method for analytically utilizing microfabricated sensors during wet-up |
| US5776672A (en) * | 1990-09-28 | 1998-07-07 | Kabushiki Kaisha Toshiba | Gene detection method |
| US5309917A (en) * | 1991-09-12 | 1994-05-10 | Drexel University | System and method of impedance cardiography and heartbeat determination |
| US5797840A (en) * | 1994-09-14 | 1998-08-25 | Ramot University Authority For Applied Research & Industrial Development Ltd. | Apparatus and method for time dependent power spectrum analysis of physiological signals |
| JP3566377B2 (ja) * | 1995-03-01 | 2004-09-15 | 株式会社神戸製鋼所 | ダイヤモンド薄膜バイオセンサ |
| US5807272A (en) | 1995-10-31 | 1998-09-15 | Worcester Polytechnic Institute | Impedance spectroscopy system for ischemia monitoring and detection |
| GB9712386D0 (en) * | 1997-06-14 | 1997-08-13 | Univ Coventry | Biosensor |
| US6151969A (en) * | 1998-07-14 | 2000-11-28 | Southwest Research Institute | Electromechanical and electrochemical impedance spectroscopy for measuring and imaging fatigue damage |
| US6144877A (en) * | 1998-08-11 | 2000-11-07 | The United States Of America As Represented By The Department Of Health And Human Services | Determining the hurst exponent for time series data |
| EP1102559B1 (fr) * | 1998-09-30 | 2003-06-04 | Cygnus, Inc. | Procede et dispositif de prediction de valeurs physiologiques |
| US6377057B1 (en) * | 1999-02-18 | 2002-04-23 | The Board Of Trustees Of The Leland Stanford Junior University | Classification of biological agents according to the spectral density signature of evoked changes in cellular electric potential |
-
2000
- 2000-09-29 JP JP2001530566A patent/JP2003511694A/ja active Pending
- 2000-09-29 US US09/675,705 patent/US6556001B1/en not_active Expired - Fee Related
- 2000-09-29 WO PCT/US2000/026765 patent/WO2001027605A1/fr not_active Ceased
- 2000-09-29 EP EP00967070A patent/EP1221041B1/fr not_active Expired - Lifetime
- 2000-09-29 AU AU77325/00A patent/AU777114B2/en not_active Ceased
- 2000-09-29 CA CA002387998A patent/CA2387998A1/fr not_active Abandoned
-
2003
- 2003-03-04 US US10/382,732 patent/US7015701B2/en not_active Expired - Fee Related
Also Published As
| Publication number | Publication date |
|---|---|
| JP2003511694A (ja) | 2003-03-25 |
| US7015701B2 (en) | 2006-03-21 |
| EP1221041A1 (fr) | 2002-07-10 |
| WO2001027605A1 (fr) | 2001-04-19 |
| US6556001B1 (en) | 2003-04-29 |
| AU777114B2 (en) | 2004-09-30 |
| CA2387998A1 (fr) | 2001-04-19 |
| AU7732500A (en) | 2001-04-23 |
| US20030173976A1 (en) | 2003-09-18 |
| WO2001027605A9 (fr) | 2002-11-21 |
Similar Documents
| Publication | Publication Date | Title |
|---|---|---|
| US6556001B1 (en) | Highly time resolved impedance spectroscopy | |
| US6885960B2 (en) | Methods and devices for performing impedance spectroscopy | |
| CA2334404C (fr) | Procede et appareil pour la mesure de la capacite d'une batterie | |
| Karden et al. | A method for measurement and interpretation of impedance spectra for industrial batteries | |
| Klotz et al. | New approach for the calculation of impedance spectra out of time domain data | |
| US6208147B1 (en) | Method of and apparatus for measuring battery capacity by impedance spectrum analysis | |
| Mitterdorfer et al. | Identification of the reaction mechanism of the Pt, O2 (g)| yttria-stabilized zirconia system: Part II: Model implementation, parameter estimation, and validation | |
| US7239155B2 (en) | Electrochemical impedance measurement system and method for use thereof | |
| US6502046B1 (en) | Laplace transform impedance spectrometer and its measurement method | |
| CN101629925B (zh) | 用于测量纯或超纯液体的电导率的方法和设备 | |
| KR20100005209A (ko) | 비선형 샘플 응답을 이용한 분석물 측정을 위한 시스템 및 방법 | |
| Suresh et al. | Rapid impedance spectroscopy using dual phase shifted chirp signals for electrochemical applications | |
| JP3407222B2 (ja) | 分析またはモニタ装置 | |
| CA2512378A1 (fr) | Dispositifs et procede de detection electrique directe de molecules et d'interactions entre molecules | |
| KR100530689B1 (ko) | 고시간 분해된 임피던스 분광학 | |
| US7930119B2 (en) | Method for analyzing AC voltage signals | |
| Wiegand et al. | Fast impedance spectroscopy: general aspects and performance study for single ion channel measurements | |
| Ehrensberger et al. | A time‐based potential step analysis of electrochemical impedance incorporating a constant phase element: A study of commercially pure titanium in phosphate buffered saline | |
| Yu et al. | Multi-channel impedance measurement system for polymer humidity sensors | |
| Yamamoto et al. | Instantaneous measurement of electrical parameters in a palm during electrodermal activity | |
| CN116359769A (zh) | 一种蓄电池充电过程原位电化学阻抗谱在线检测方法 | |
| McKubre | Techniques for AC Impedance Measurements in Corrosion Systems | |
| CN101536551A (zh) | 装置的响应信号的谐波部分和非谐波部分的确定方法 | |
| Gabrielli et al. | Frequency analysis of electrochemical step responses complex and operational impedances | |
| CN109959685B (zh) | 一种生物产品中硝酸盐离子含量的测量方法及其测量系统 |
Legal Events
| Date | Code | Title | Description |
|---|---|---|---|
| PUAI | Public reference made under article 153(3) epc to a published international application that has entered the european phase |
Free format text: ORIGINAL CODE: 0009012 |
|
| 17P | Request for examination filed |
Effective date: 20020412 |
|
| AK | Designated contracting states |
Kind code of ref document: A1 Designated state(s): AT BE CH CY DE DK ES FI FR GB GR IE IT LI LU MC NL PT SE |
|
| AX | Request for extension of the european patent |
Free format text: AL PAYMENT 20020412;LT PAYMENT 20020412;LV PAYMENT 20020412;MK PAYMENT 20020412;RO PAYMENT 20020412;SI PAYMENT 20020412 |
|
| 17Q | First examination report despatched |
Effective date: 20040406 |
|
| 17Q | First examination report despatched |
Effective date: 20040406 |
|
| GRAP | Despatch of communication of intention to grant a patent |
Free format text: ORIGINAL CODE: EPIDOSNIGR1 |
|
| GRAS | Grant fee paid |
Free format text: ORIGINAL CODE: EPIDOSNIGR3 |
|
| GRAA | (expected) grant |
Free format text: ORIGINAL CODE: 0009210 |
|
| AK | Designated contracting states |
Kind code of ref document: B1 Designated state(s): AT BE CH CY DE DK ES FI FR GB GR IE IT LI LU MC NL PT SE |
|
| AX | Request for extension of the european patent |
Extension state: AL LT LV MK RO SI |
|
| REG | Reference to a national code |
Ref country code: GB Ref legal event code: FG4D |
|
| REG | Reference to a national code |
Ref country code: CH Ref legal event code: EP |
|
| REG | Reference to a national code |
Ref country code: IE Ref legal event code: FG4D |
|
| REF | Corresponds to: |
Ref document number: 60043738 Country of ref document: DE Date of ref document: 20100311 Kind code of ref document: P |
|
| REG | Reference to a national code |
Ref country code: NL Ref legal event code: VDEP Effective date: 20100120 |
|
| LTIE | Lt: invalidation of european patent or patent extension |
Effective date: 20100120 |
|
| PG25 | Lapsed in a contracting state [announced via postgrant information from national office to epo] |
Ref country code: AT Free format text: LAPSE BECAUSE OF FAILURE TO SUBMIT A TRANSLATION OF THE DESCRIPTION OR TO PAY THE FEE WITHIN THE PRESCRIBED TIME-LIMIT Effective date: 20100120 |
|
| PG25 | Lapsed in a contracting state [announced via postgrant information from national office to epo] |
Ref country code: NL Free format text: LAPSE BECAUSE OF FAILURE TO SUBMIT A TRANSLATION OF THE DESCRIPTION OR TO PAY THE FEE WITHIN THE PRESCRIBED TIME-LIMIT Effective date: 20100120 Ref country code: PT Free format text: LAPSE BECAUSE OF FAILURE TO SUBMIT A TRANSLATION OF THE DESCRIPTION OR TO PAY THE FEE WITHIN THE PRESCRIBED TIME-LIMIT Effective date: 20100520 Ref country code: ES Free format text: LAPSE BECAUSE OF FAILURE TO SUBMIT A TRANSLATION OF THE DESCRIPTION OR TO PAY THE FEE WITHIN THE PRESCRIBED TIME-LIMIT Effective date: 20100501 |
|
| PG25 | Lapsed in a contracting state [announced via postgrant information from national office to epo] |
Ref country code: FI Free format text: LAPSE BECAUSE OF FAILURE TO SUBMIT A TRANSLATION OF THE DESCRIPTION OR TO PAY THE FEE WITHIN THE PRESCRIBED TIME-LIMIT Effective date: 20100120 |
|
| PG25 | Lapsed in a contracting state [announced via postgrant information from national office to epo] |
Ref country code: GR Free format text: LAPSE BECAUSE OF FAILURE TO SUBMIT A TRANSLATION OF THE DESCRIPTION OR TO PAY THE FEE WITHIN THE PRESCRIBED TIME-LIMIT Effective date: 20100421 Ref country code: BE Free format text: LAPSE BECAUSE OF FAILURE TO SUBMIT A TRANSLATION OF THE DESCRIPTION OR TO PAY THE FEE WITHIN THE PRESCRIBED TIME-LIMIT Effective date: 20100120 Ref country code: SE Free format text: LAPSE BECAUSE OF FAILURE TO SUBMIT A TRANSLATION OF THE DESCRIPTION OR TO PAY THE FEE WITHIN THE PRESCRIBED TIME-LIMIT Effective date: 20100120 Ref country code: CY Free format text: LAPSE BECAUSE OF FAILURE TO SUBMIT A TRANSLATION OF THE DESCRIPTION OR TO PAY THE FEE WITHIN THE PRESCRIBED TIME-LIMIT Effective date: 20100120 |
|
| PLBE | No opposition filed within time limit |
Free format text: ORIGINAL CODE: 0009261 |
|
| STAA | Information on the status of an ep patent application or granted ep patent |
Free format text: STATUS: NO OPPOSITION FILED WITHIN TIME LIMIT |
|
| 26N | No opposition filed |
Effective date: 20101021 |
|
| PG25 | Lapsed in a contracting state [announced via postgrant information from national office to epo] |
Ref country code: DK Free format text: LAPSE BECAUSE OF FAILURE TO SUBMIT A TRANSLATION OF THE DESCRIPTION OR TO PAY THE FEE WITHIN THE PRESCRIBED TIME-LIMIT Effective date: 20100120 |
|
| PG25 | Lapsed in a contracting state [announced via postgrant information from national office to epo] |
Ref country code: IT Free format text: LAPSE BECAUSE OF FAILURE TO SUBMIT A TRANSLATION OF THE DESCRIPTION OR TO PAY THE FEE WITHIN THE PRESCRIBED TIME-LIMIT Effective date: 20100120 |
|
| PG25 | Lapsed in a contracting state [announced via postgrant information from national office to epo] |
Ref country code: MC Free format text: LAPSE BECAUSE OF NON-PAYMENT OF DUE FEES Effective date: 20100930 |
|
| REG | Reference to a national code |
Ref country code: CH Ref legal event code: PL |
|
| PG25 | Lapsed in a contracting state [announced via postgrant information from national office to epo] |
Ref country code: CH Free format text: LAPSE BECAUSE OF NON-PAYMENT OF DUE FEES Effective date: 20100930 Ref country code: IE Free format text: LAPSE BECAUSE OF NON-PAYMENT OF DUE FEES Effective date: 20100929 Ref country code: LI Free format text: LAPSE BECAUSE OF NON-PAYMENT OF DUE FEES Effective date: 20100930 |
|
| PG25 | Lapsed in a contracting state [announced via postgrant information from national office to epo] |
Ref country code: LU Free format text: LAPSE BECAUSE OF NON-PAYMENT OF DUE FEES Effective date: 20100929 |
|
| PGFP | Annual fee paid to national office [announced via postgrant information from national office to epo] |
Ref country code: DE Payment date: 20130925 Year of fee payment: 14 |
|
| PGFP | Annual fee paid to national office [announced via postgrant information from national office to epo] |
Ref country code: GB Payment date: 20130925 Year of fee payment: 14 Ref country code: FR Payment date: 20130910 Year of fee payment: 14 |
|
| REG | Reference to a national code |
Ref country code: DE Ref legal event code: R119 Ref document number: 60043738 Country of ref document: DE |
|
| GBPC | Gb: european patent ceased through non-payment of renewal fee |
Effective date: 20140929 |
|
| REG | Reference to a national code |
Ref country code: FR Ref legal event code: ST Effective date: 20150529 |
|
| PG25 | Lapsed in a contracting state [announced via postgrant information from national office to epo] |
Ref country code: DE Free format text: LAPSE BECAUSE OF NON-PAYMENT OF DUE FEES Effective date: 20150401 Ref country code: GB Free format text: LAPSE BECAUSE OF NON-PAYMENT OF DUE FEES Effective date: 20140929 |
|
| PG25 | Lapsed in a contracting state [announced via postgrant information from national office to epo] |
Ref country code: FR Free format text: LAPSE BECAUSE OF NON-PAYMENT OF DUE FEES Effective date: 20140930 |