EP1221618A1 - Diagnoseverfahren für allergische Erkrankungen - Google Patents
Diagnoseverfahren für allergische Erkrankungen Download PDFInfo
- Publication number
- EP1221618A1 EP1221618A1 EP00126117A EP00126117A EP1221618A1 EP 1221618 A1 EP1221618 A1 EP 1221618A1 EP 00126117 A EP00126117 A EP 00126117A EP 00126117 A EP00126117 A EP 00126117A EP 1221618 A1 EP1221618 A1 EP 1221618A1
- Authority
- EP
- European Patent Office
- Prior art keywords
- group
- genes
- expression profiling
- asthma
- patients
- Prior art date
- Legal status (The legal status is an assumption and is not a legal conclusion. Google has not performed a legal analysis and makes no representation as to the accuracy of the status listed.)
- Withdrawn
Links
- 208000026935 allergic disease Diseases 0.000 title claims abstract description 42
- 238000000034 method Methods 0.000 title claims description 36
- 208000006673 asthma Diseases 0.000 claims abstract description 79
- 206010012438 Dermatitis atopic Diseases 0.000 claims abstract description 72
- 201000008937 atopic dermatitis Diseases 0.000 claims abstract description 72
- 238000010195 expression analysis Methods 0.000 claims abstract description 27
- 210000001744 T-lymphocyte Anatomy 0.000 claims abstract description 25
- 108020004999 messenger RNA Proteins 0.000 claims abstract description 19
- 210000004698 lymphocyte Anatomy 0.000 claims abstract description 17
- 238000000338 in vitro Methods 0.000 claims abstract description 12
- 108090000623 proteins and genes Proteins 0.000 claims description 84
- 108020003175 receptors Proteins 0.000 claims description 20
- 102000005962 receptors Human genes 0.000 claims description 20
- 108091034117 Oligonucleotide Proteins 0.000 claims description 19
- 210000004027 cell Anatomy 0.000 claims description 19
- 210000001616 monocyte Anatomy 0.000 claims description 17
- 239000003446 ligand Substances 0.000 claims description 16
- 210000002540 macrophage Anatomy 0.000 claims description 16
- 206010020751 Hypersensitivity Diseases 0.000 claims description 15
- 239000000126 substance Substances 0.000 claims description 15
- 239000012634 fragment Substances 0.000 claims description 14
- 239000002751 oligonucleotide probe Substances 0.000 claims description 14
- -1 DNAM Proteins 0.000 claims description 13
- 230000002009 allergenic effect Effects 0.000 claims description 12
- 230000007815 allergy Effects 0.000 claims description 11
- 210000004369 blood Anatomy 0.000 claims description 11
- 239000008280 blood Substances 0.000 claims description 11
- 239000002299 complementary DNA Substances 0.000 claims description 11
- 101100335081 Mus musculus Flt3 gene Proteins 0.000 claims description 10
- 201000009961 allergic asthma Diseases 0.000 claims description 10
- 239000012491 analyte Substances 0.000 claims description 10
- 102000004169 proteins and genes Human genes 0.000 claims description 10
- 108010025020 Nerve Growth Factor Proteins 0.000 claims description 9
- JLCPHMBAVCMARE-UHFFFAOYSA-N [3-[[3-[[3-[[3-[[3-[[3-[[3-[[3-[[3-[[3-[[3-[[5-(2-amino-6-oxo-1H-purin-9-yl)-3-[[3-[[3-[[3-[[3-[[3-[[5-(2-amino-6-oxo-1H-purin-9-yl)-3-[[5-(2-amino-6-oxo-1H-purin-9-yl)-3-hydroxyoxolan-2-yl]methoxy-hydroxyphosphoryl]oxyoxolan-2-yl]methoxy-hydroxyphosphoryl]oxy-5-(5-methyl-2,4-dioxopyrimidin-1-yl)oxolan-2-yl]methoxy-hydroxyphosphoryl]oxy-5-(6-aminopurin-9-yl)oxolan-2-yl]methoxy-hydroxyphosphoryl]oxy-5-(6-aminopurin-9-yl)oxolan-2-yl]methoxy-hydroxyphosphoryl]oxy-5-(6-aminopurin-9-yl)oxolan-2-yl]methoxy-hydroxyphosphoryl]oxy-5-(6-aminopurin-9-yl)oxolan-2-yl]methoxy-hydroxyphosphoryl]oxyoxolan-2-yl]methoxy-hydroxyphosphoryl]oxy-5-(5-methyl-2,4-dioxopyrimidin-1-yl)oxolan-2-yl]methoxy-hydroxyphosphoryl]oxy-5-(4-amino-2-oxopyrimidin-1-yl)oxolan-2-yl]methoxy-hydroxyphosphoryl]oxy-5-(5-methyl-2,4-dioxopyrimidin-1-yl)oxolan-2-yl]methoxy-hydroxyphosphoryl]oxy-5-(5-methyl-2,4-dioxopyrimidin-1-yl)oxolan-2-yl]methoxy-hydroxyphosphoryl]oxy-5-(6-aminopurin-9-yl)oxolan-2-yl]methoxy-hydroxyphosphoryl]oxy-5-(6-aminopurin-9-yl)oxolan-2-yl]methoxy-hydroxyphosphoryl]oxy-5-(4-amino-2-oxopyrimidin-1-yl)oxolan-2-yl]methoxy-hydroxyphosphoryl]oxy-5-(4-amino-2-oxopyrimidin-1-yl)oxolan-2-yl]methoxy-hydroxyphosphoryl]oxy-5-(4-amino-2-oxopyrimidin-1-yl)oxolan-2-yl]methoxy-hydroxyphosphoryl]oxy-5-(6-aminopurin-9-yl)oxolan-2-yl]methoxy-hydroxyphosphoryl]oxy-5-(4-amino-2-oxopyrimidin-1-yl)oxolan-2-yl]methyl [5-(6-aminopurin-9-yl)-2-(hydroxymethyl)oxolan-3-yl] hydrogen phosphate Polymers Cc1cn(C2CC(OP(O)(=O)OCC3OC(CC3OP(O)(=O)OCC3OC(CC3O)n3cnc4c3nc(N)[nH]c4=O)n3cnc4c3nc(N)[nH]c4=O)C(COP(O)(=O)OC3CC(OC3COP(O)(=O)OC3CC(OC3COP(O)(=O)OC3CC(OC3COP(O)(=O)OC3CC(OC3COP(O)(=O)OC3CC(OC3COP(O)(=O)OC3CC(OC3COP(O)(=O)OC3CC(OC3COP(O)(=O)OC3CC(OC3COP(O)(=O)OC3CC(OC3COP(O)(=O)OC3CC(OC3COP(O)(=O)OC3CC(OC3COP(O)(=O)OC3CC(OC3COP(O)(=O)OC3CC(OC3COP(O)(=O)OC3CC(OC3COP(O)(=O)OC3CC(OC3COP(O)(=O)OC3CC(OC3COP(O)(=O)OC3CC(OC3CO)n3cnc4c(N)ncnc34)n3ccc(N)nc3=O)n3cnc4c(N)ncnc34)n3ccc(N)nc3=O)n3ccc(N)nc3=O)n3ccc(N)nc3=O)n3cnc4c(N)ncnc34)n3cnc4c(N)ncnc34)n3cc(C)c(=O)[nH]c3=O)n3cc(C)c(=O)[nH]c3=O)n3ccc(N)nc3=O)n3cc(C)c(=O)[nH]c3=O)n3cnc4c3nc(N)[nH]c4=O)n3cnc4c(N)ncnc34)n3cnc4c(N)ncnc34)n3cnc4c(N)ncnc34)n3cnc4c(N)ncnc34)O2)c(=O)[nH]c1=O JLCPHMBAVCMARE-UHFFFAOYSA-N 0.000 claims description 9
- 108020005187 Oligonucleotide Probes Proteins 0.000 claims description 8
- 108010033760 Amphiregulin Proteins 0.000 claims description 7
- 108010078239 Chemokine CX3CL1 Proteins 0.000 claims description 7
- 102000013818 Fractalkine Human genes 0.000 claims description 7
- 238000007423 screening assay Methods 0.000 claims description 7
- 102100023700 C-C motif chemokine 16 Human genes 0.000 claims description 6
- 108020004635 Complementary DNA Proteins 0.000 claims description 6
- 102100040954 Ephrin-A1 Human genes 0.000 claims description 6
- 108010043945 Ephrin-A1 Proteins 0.000 claims description 6
- 102100033919 Ephrin-A2 Human genes 0.000 claims description 6
- 108010043942 Ephrin-A2 Proteins 0.000 claims description 6
- 101000978375 Homo sapiens C-C motif chemokine 16 Proteins 0.000 claims description 6
- 101000668165 Homo sapiens RNA-binding motif, single-stranded-interacting protein 1 Proteins 0.000 claims description 6
- 108010002350 Interleukin-2 Proteins 0.000 claims description 6
- 102000003990 Urokinase-type plasminogen activator Human genes 0.000 claims description 6
- 108090000435 Urokinase-type plasminogen activator Proteins 0.000 claims description 6
- 102000028416 insulin-like growth factor binding Human genes 0.000 claims description 6
- 108091022911 insulin-like growth factor binding Proteins 0.000 claims description 6
- PGHMRUGBZOYCAA-ADZNBVRBSA-N ionomycin Chemical compound O1[C@H](C[C@H](O)[C@H](C)[C@H](O)[C@H](C)/C=C/C[C@@H](C)C[C@@H](C)C(/O)=C/C(=O)[C@@H](C)C[C@@H](C)C[C@@H](CCC(O)=O)C)CC[C@@]1(C)[C@@H]1O[C@](C)([C@@H](C)O)CC1 PGHMRUGBZOYCAA-ADZNBVRBSA-N 0.000 claims description 6
- PGHMRUGBZOYCAA-UHFFFAOYSA-N ionomycin Natural products O1C(CC(O)C(C)C(O)C(C)C=CCC(C)CC(C)C(O)=CC(=O)C(C)CC(C)CC(CCC(O)=O)C)CCC1(C)C1OC(C)(C(C)O)CC1 PGHMRUGBZOYCAA-UHFFFAOYSA-N 0.000 claims description 6
- 229960005356 urokinase Drugs 0.000 claims description 6
- 108700021677 Agouti-Related Proteins 0.000 claims description 5
- 102000054930 Agouti-Related Human genes 0.000 claims description 5
- 101800001382 Betacellulin Proteins 0.000 claims description 5
- 102100036841 C-C motif chemokine 1 Human genes 0.000 claims description 5
- 108010005939 Ciliary Neurotrophic Factor Proteins 0.000 claims description 5
- 102100031614 Ciliary neurotrophic factor Human genes 0.000 claims description 5
- 101100481408 Danio rerio tie2 gene Proteins 0.000 claims description 5
- 102100037241 Endoglin Human genes 0.000 claims description 5
- 108010036395 Endoglin Proteins 0.000 claims description 5
- 108010055179 EphA4 Receptor Proteins 0.000 claims description 5
- 102100030322 Ephrin type-A receptor 1 Human genes 0.000 claims description 5
- 102100021616 Ephrin type-A receptor 4 Human genes 0.000 claims description 5
- 102100031983 Ephrin type-B receptor 4 Human genes 0.000 claims description 5
- 108091010837 Glial cell line-derived neurotrophic factor Proteins 0.000 claims description 5
- 102000034615 Glial cell line-derived neurotrophic factor Human genes 0.000 claims description 5
- 101000713104 Homo sapiens C-C motif chemokine 1 Proteins 0.000 claims description 5
- 101000938354 Homo sapiens Ephrin type-A receptor 1 Proteins 0.000 claims description 5
- 101000967918 Homo sapiens Left-right determination factor 2 Proteins 0.000 claims description 5
- 101000684730 Homo sapiens Secreted frizzled-related protein 5 Proteins 0.000 claims description 5
- 102100040511 Left-right determination factor 2 Human genes 0.000 claims description 5
- 102100030201 Matrix metalloproteinase-15 Human genes 0.000 claims description 5
- 108090000560 Matrix metalloproteinase-15 Proteins 0.000 claims description 5
- 101100369076 Mus musculus Tdgf1 gene Proteins 0.000 claims description 5
- 101100481410 Mus musculus Tek gene Proteins 0.000 claims description 5
- 102100029837 Probetacellulin Human genes 0.000 claims description 5
- 102100036467 Protein delta homolog 1 Human genes 0.000 claims description 5
- 101710119301 Protein delta homolog 1 Proteins 0.000 claims description 5
- 102100023744 Secreted frizzled-related protein 5 Human genes 0.000 claims description 5
- 230000003213 activating effect Effects 0.000 claims description 5
- PHEDXBVPIONUQT-UHFFFAOYSA-N Cocarcinogen A1 Natural products CCCCCCCCCCCCCC(=O)OC1C(C)C2(O)C3C=C(C)C(=O)C3(O)CC(CO)=CC2C2C1(OC(C)=O)C2(C)C PHEDXBVPIONUQT-UHFFFAOYSA-N 0.000 claims description 4
- 108010055196 EphA2 Receptor Proteins 0.000 claims description 4
- 108010055191 EphA3 Receptor Proteins 0.000 claims description 4
- 102100030340 Ephrin type-A receptor 2 Human genes 0.000 claims description 4
- 102100030324 Ephrin type-A receptor 3 Human genes 0.000 claims description 4
- 102100031984 Ephrin type-B receptor 6 Human genes 0.000 claims description 4
- 102000018651 Epithelial Cell Adhesion Molecule Human genes 0.000 claims description 4
- 108010066687 Epithelial Cell Adhesion Molecule Proteins 0.000 claims description 4
- 108010017213 Granulocyte-Macrophage Colony-Stimulating Factor Proteins 0.000 claims description 4
- 102100039620 Granulocyte-macrophage colony-stimulating factor Human genes 0.000 claims description 4
- 101001064451 Homo sapiens Ephrin type-B receptor 6 Proteins 0.000 claims description 4
- 101100369992 Homo sapiens TNFSF10 gene Proteins 0.000 claims description 4
- 108090000177 Interleukin-11 Proteins 0.000 claims description 4
- 108010047620 Phytohemagglutinins Proteins 0.000 claims description 4
- 102000046283 TNF-Related Apoptosis-Inducing Ligand Human genes 0.000 claims description 4
- 108700012411 TNFSF10 Proteins 0.000 claims description 4
- 208000003455 anaphylaxis Diseases 0.000 claims description 4
- PHEDXBVPIONUQT-RGYGYFBISA-N phorbol 13-acetate 12-myristate Chemical compound C([C@]1(O)C(=O)C(C)=C[C@H]1[C@@]1(O)[C@H](C)[C@H]2OC(=O)CCCCCCCCCCCCC)C(CO)=C[C@H]1[C@H]1[C@]2(OC(C)=O)C1(C)C PHEDXBVPIONUQT-RGYGYFBISA-N 0.000 claims description 4
- 230000001885 phytohemagglutinin Effects 0.000 claims description 4
- 206010002199 Anaphylactic shock Diseases 0.000 claims description 3
- 208000004262 Food Hypersensitivity Diseases 0.000 claims description 3
- 241000238631 Hexapoda Species 0.000 claims description 3
- 108090000174 Interleukin-10 Proteins 0.000 claims description 3
- 108090000772 Neuropilin-1 Proteins 0.000 claims description 3
- 102000006747 Transforming Growth Factor alpha Human genes 0.000 claims description 3
- 101800004564 Transforming growth factor alpha Proteins 0.000 claims description 3
- 235000020932 food allergy Nutrition 0.000 claims description 3
- 102100022987 Angiogenin Human genes 0.000 claims description 2
- 102100023702 C-C motif chemokine 13 Human genes 0.000 claims description 2
- 101710112613 C-C motif chemokine 13 Proteins 0.000 claims description 2
- 102100023698 C-C motif chemokine 17 Human genes 0.000 claims description 2
- 102100031107 Disintegrin and metalloproteinase domain-containing protein 11 Human genes 0.000 claims description 2
- 101710121366 Disintegrin and metalloproteinase domain-containing protein 11 Proteins 0.000 claims description 2
- 101000867232 Escherichia coli Heat-stable enterotoxin II Proteins 0.000 claims description 2
- 101150021185 FGF gene Proteins 0.000 claims description 2
- 108010039471 Fas Ligand Protein Proteins 0.000 claims description 2
- 108090000378 Fibroblast growth factor 3 Proteins 0.000 claims description 2
- 102100028043 Fibroblast growth factor 3 Human genes 0.000 claims description 2
- 102100028072 Fibroblast growth factor 4 Human genes 0.000 claims description 2
- 108090000381 Fibroblast growth factor 4 Proteins 0.000 claims description 2
- 108010014612 Follistatin Proteins 0.000 claims description 2
- 102000016970 Follistatin Human genes 0.000 claims description 2
- 108010017080 Granulocyte Colony-Stimulating Factor Proteins 0.000 claims description 2
- 102000004269 Granulocyte Colony-Stimulating Factor Human genes 0.000 claims description 2
- 102100039622 Granulocyte colony-stimulating factor receptor Human genes 0.000 claims description 2
- 101710142125 Granulocyte colony-stimulating factor receptor Proteins 0.000 claims description 2
- 102100031573 Hematopoietic progenitor cell antigen CD34 Human genes 0.000 claims description 2
- 101000978362 Homo sapiens C-C motif chemokine 17 Proteins 0.000 claims description 2
- 101000777663 Homo sapiens Hematopoietic progenitor cell antigen CD34 Proteins 0.000 claims description 2
- 101000851376 Homo sapiens Tumor necrosis factor receptor superfamily member 8 Proteins 0.000 claims description 2
- 101000851370 Homo sapiens Tumor necrosis factor receptor superfamily member 9 Proteins 0.000 claims description 2
- 108090000723 Insulin-Like Growth Factor I Proteins 0.000 claims description 2
- 102000004218 Insulin-Like Growth Factor I Human genes 0.000 claims description 2
- 108010064593 Intercellular Adhesion Molecule-1 Proteins 0.000 claims description 2
- 102000015271 Intercellular Adhesion Molecule-1 Human genes 0.000 claims description 2
- 108010002352 Interleukin-1 Proteins 0.000 claims description 2
- 108010002386 Interleukin-3 Proteins 0.000 claims description 2
- 108090000978 Interleukin-4 Proteins 0.000 claims description 2
- 108010002616 Interleukin-5 Proteins 0.000 claims description 2
- 108090001005 Interleukin-6 Proteins 0.000 claims description 2
- 108010002586 Interleukin-7 Proteins 0.000 claims description 2
- 108090001007 Interleukin-8 Proteins 0.000 claims description 2
- 102000004890 Interleukin-8 Human genes 0.000 claims description 2
- 102100020880 Kit ligand Human genes 0.000 claims description 2
- 108010092277 Leptin Proteins 0.000 claims description 2
- 102000016267 Leptin Human genes 0.000 claims description 2
- 108010046938 Macrophage Colony-Stimulating Factor Proteins 0.000 claims description 2
- 102100028123 Macrophage colony-stimulating factor 1 Human genes 0.000 claims description 2
- 101710187853 Macrophage metalloelastase Proteins 0.000 claims description 2
- 102100027998 Macrophage metalloelastase Human genes 0.000 claims description 2
- 102100030335 Midkine Human genes 0.000 claims description 2
- 108010092801 Midkine Proteins 0.000 claims description 2
- 101710090055 Nitric oxide synthase, endothelial Proteins 0.000 claims description 2
- 102000004140 Oncostatin M Human genes 0.000 claims description 2
- 108090000630 Oncostatin M Proteins 0.000 claims description 2
- 102100040557 Osteopontin Human genes 0.000 claims description 2
- 108010081689 Osteopontin Proteins 0.000 claims description 2
- 108010014608 Proto-Oncogene Proteins c-kit Proteins 0.000 claims description 2
- 102000016971 Proto-Oncogene Proteins c-kit Human genes 0.000 claims description 2
- 206010039085 Rhinitis allergic Diseases 0.000 claims description 2
- 102100030054 Secreted frizzled-related protein 2 Human genes 0.000 claims description 2
- 108050007987 Secreted frizzled-related protein 2 Proteins 0.000 claims description 2
- 102000008115 Signaling Lymphocytic Activation Molecule Family Member 1 Human genes 0.000 claims description 2
- 108010074687 Signaling Lymphocytic Activation Molecule Family Member 1 Proteins 0.000 claims description 2
- 108010039445 Stem Cell Factor Proteins 0.000 claims description 2
- 102100031988 Tumor necrosis factor ligand superfamily member 6 Human genes 0.000 claims description 2
- 102100036857 Tumor necrosis factor receptor superfamily member 8 Human genes 0.000 claims description 2
- 102100036856 Tumor necrosis factor receptor superfamily member 9 Human genes 0.000 claims description 2
- 102000009519 Vascular Endothelial Growth Factor D Human genes 0.000 claims description 2
- 108010073919 Vascular Endothelial Growth Factor D Proteins 0.000 claims description 2
- 102000005789 Vascular Endothelial Growth Factors Human genes 0.000 claims description 2
- 108010019530 Vascular Endothelial Growth Factors Proteins 0.000 claims description 2
- 230000002378 acidificating effect Effects 0.000 claims description 2
- 201000010105 allergic rhinitis Diseases 0.000 claims description 2
- 108010072788 angiogenin Proteins 0.000 claims description 2
- 230000002596 correlated effect Effects 0.000 claims description 2
- 231100000655 enterotoxin Toxicity 0.000 claims description 2
- 108700014844 flt3 ligand Proteins 0.000 claims description 2
- 108010067471 inhibin A Proteins 0.000 claims description 2
- NRYBAZVQPHGZNS-ZSOCWYAHSA-N leptin Chemical compound O=C([C@H](CO)NC(=O)[C@H](CC(C)C)NC(=O)[C@H](CC(O)=O)NC(=O)[C@H](CC(C)C)NC(=O)[C@H](CCC(N)=O)NC(=O)[C@H](CC=1C2=CC=CC=C2NC=1)NC(=O)[C@H](CC(C)C)NC(=O)[C@@H](NC(=O)[C@H](CC(O)=O)NC(=O)[C@H](CCC(N)=O)NC(=O)[C@H](CC(C)C)NC(=O)[C@H](CO)NC(=O)CNC(=O)[C@H](CCC(N)=O)NC(=O)[C@@H](N)CC(C)C)CCSC)N1CCC[C@H]1C(=O)NCC(=O)N[C@@H](CS)C(O)=O NRYBAZVQPHGZNS-ZSOCWYAHSA-N 0.000 claims description 2
- 229940039781 leptin Drugs 0.000 claims description 2
- 229920006008 lipopolysaccharide Polymers 0.000 claims description 2
- 230000001404 mediated effect Effects 0.000 claims description 2
- 239000003226 mitogen Substances 0.000 claims description 2
- 102100038778 Amphiregulin Human genes 0.000 claims 2
- 102100028762 Neuropilin-1 Human genes 0.000 claims 1
- 230000014509 gene expression Effects 0.000 abstract description 39
- 238000004458 analytical method Methods 0.000 abstract description 9
- 238000003491 array Methods 0.000 abstract description 6
- 238000003748 differential diagnosis Methods 0.000 abstract description 6
- 230000003247 decreasing effect Effects 0.000 description 24
- 230000007423 decrease Effects 0.000 description 22
- 239000013566 allergen Substances 0.000 description 12
- 239000012528 membrane Substances 0.000 description 9
- 238000001994 activation Methods 0.000 description 8
- 230000004913 activation Effects 0.000 description 7
- 208000037265 diseases, disorders, signs and symptoms Diseases 0.000 description 7
- 238000012360 testing method Methods 0.000 description 7
- 238000003745 diagnosis Methods 0.000 description 6
- 201000010099 disease Diseases 0.000 description 6
- 230000000638 stimulation Effects 0.000 description 6
- 108091032973 (ribonucleotides)n+m Proteins 0.000 description 5
- 102000007299 Amphiregulin Human genes 0.000 description 5
- 230000000172 allergic effect Effects 0.000 description 5
- 208000010668 atopic eczema Diseases 0.000 description 5
- 230000001105 regulatory effect Effects 0.000 description 5
- 102000004127 Cytokines Human genes 0.000 description 4
- 108090000695 Cytokines Proteins 0.000 description 4
- 108700039887 Essential Genes Proteins 0.000 description 4
- LFQSCWFLJHTTHZ-UHFFFAOYSA-N Ethanol Chemical compound CCO LFQSCWFLJHTTHZ-UHFFFAOYSA-N 0.000 description 4
- FAPWRFPIFSIZLT-UHFFFAOYSA-M Sodium chloride Chemical compound [Na+].[Cl-] FAPWRFPIFSIZLT-UHFFFAOYSA-M 0.000 description 4
- 239000000427 antigen Substances 0.000 description 4
- 102000036639 antigens Human genes 0.000 description 4
- 108091007433 antigens Proteins 0.000 description 4
- 208000024711 extrinsic asthma Diseases 0.000 description 4
- 238000009396 hybridization Methods 0.000 description 4
- 239000000523 sample Substances 0.000 description 4
- 241000282414 Homo sapiens Species 0.000 description 3
- HEMHJVSKTPXQMS-UHFFFAOYSA-M Sodium hydroxide Chemical compound [OH-].[Na+] HEMHJVSKTPXQMS-UHFFFAOYSA-M 0.000 description 3
- 210000000601 blood cell Anatomy 0.000 description 3
- 239000000872 buffer Substances 0.000 description 3
- 238000013461 design Methods 0.000 description 3
- 238000002405 diagnostic procedure Methods 0.000 description 3
- 238000005516 engineering process Methods 0.000 description 3
- 239000003550 marker Substances 0.000 description 3
- 239000002773 nucleotide Substances 0.000 description 3
- 125000003729 nucleotide group Chemical group 0.000 description 3
- 230000002441 reversible effect Effects 0.000 description 3
- 150000003431 steroids Chemical class 0.000 description 3
- YBJHBAHKTGYVGT-ZKWXMUAHSA-N (+)-Biotin Chemical compound N1C(=O)N[C@@H]2[C@H](CCCCC(=O)O)SC[C@@H]21 YBJHBAHKTGYVGT-ZKWXMUAHSA-N 0.000 description 2
- 206010066091 Bronchial Hyperreactivity Diseases 0.000 description 2
- 108020004414 DNA Proteins 0.000 description 2
- 102000004190 Enzymes Human genes 0.000 description 2
- 108090000790 Enzymes Proteins 0.000 description 2
- 229920001917 Ficoll Polymers 0.000 description 2
- 101000914514 Homo sapiens T-cell-specific surface glycoprotein CD28 Proteins 0.000 description 2
- 208000019693 Lung disease Diseases 0.000 description 2
- 102000004207 Neuropilin-1 Human genes 0.000 description 2
- 208000037065 Subacute sclerosing leukoencephalitis Diseases 0.000 description 2
- 206010042297 Subacute sclerosing panencephalitis Diseases 0.000 description 2
- 102100027213 T-cell-specific surface glycoprotein CD28 Human genes 0.000 description 2
- 235000010724 Wisteria floribunda Nutrition 0.000 description 2
- 230000003266 anti-allergic effect Effects 0.000 description 2
- 239000011324 bead Substances 0.000 description 2
- 238000006243 chemical reaction Methods 0.000 description 2
- 238000011161 development Methods 0.000 description 2
- 230000004069 differentiation Effects 0.000 description 2
- 239000003814 drug Substances 0.000 description 2
- 229940088598 enzyme Drugs 0.000 description 2
- 238000011156 evaluation Methods 0.000 description 2
- 238000001943 fluorescence-activated cell sorting Methods 0.000 description 2
- 230000006870 function Effects 0.000 description 2
- 239000011521 glass Substances 0.000 description 2
- 238000005259 measurement Methods 0.000 description 2
- 238000002844 melting Methods 0.000 description 2
- 230000008018 melting Effects 0.000 description 2
- 210000003819 peripheral blood mononuclear cell Anatomy 0.000 description 2
- 238000000926 separation method Methods 0.000 description 2
- 210000002966 serum Anatomy 0.000 description 2
- 239000011780 sodium chloride Substances 0.000 description 2
- DAEPDZWVDSPTHF-UHFFFAOYSA-M sodium pyruvate Chemical compound [Na+].CC(=O)C([O-])=O DAEPDZWVDSPTHF-UHFFFAOYSA-M 0.000 description 2
- 239000007787 solid Substances 0.000 description 2
- DGVVWUTYPXICAM-UHFFFAOYSA-N β‐Mercaptoethanol Chemical compound OCCS DGVVWUTYPXICAM-UHFFFAOYSA-N 0.000 description 2
- 101710141544 Allatotropin-related peptide Proteins 0.000 description 1
- 206010002198 Anaphylactic reaction Diseases 0.000 description 1
- 241000228212 Aspergillus Species 0.000 description 1
- 108050001427 Avidin/streptavidin Proteins 0.000 description 1
- 108091003079 Bovine Serum Albumin Proteins 0.000 description 1
- 102000004219 Brain-derived neurotrophic factor Human genes 0.000 description 1
- 108090000715 Brain-derived neurotrophic factor Proteins 0.000 description 1
- 102100023703 C-C motif chemokine 15 Human genes 0.000 description 1
- 102000004163 DNA-directed RNA polymerases Human genes 0.000 description 1
- 108090000626 DNA-directed RNA polymerases Proteins 0.000 description 1
- KCXVZYZYPLLWCC-UHFFFAOYSA-N EDTA Chemical compound OC(=O)CN(CC(O)=O)CCN(CC(O)=O)CC(O)=O KCXVZYZYPLLWCC-UHFFFAOYSA-N 0.000 description 1
- 101150084967 EPCAM gene Proteins 0.000 description 1
- 102100031181 Glyceraldehyde-3-phosphate dehydrogenase Human genes 0.000 description 1
- HTTJABKRGRZYRN-UHFFFAOYSA-N Heparin Chemical compound OC1C(NC(=O)C)C(O)OC(COS(O)(=O)=O)C1OC1C(OS(O)(=O)=O)C(O)C(OC2C(C(OS(O)(=O)=O)C(OC3C(C(O)C(O)C(O3)C(O)=O)OS(O)(=O)=O)C(CO)O2)NS(O)(=O)=O)C(C(O)=O)O1 HTTJABKRGRZYRN-UHFFFAOYSA-N 0.000 description 1
- 101000978376 Homo sapiens C-C motif chemokine 15 Proteins 0.000 description 1
- ZDXPYRJPNDTMRX-VKHMYHEASA-N L-glutamine Chemical compound OC(=O)[C@@H](N)CCC(N)=O ZDXPYRJPNDTMRX-VKHMYHEASA-N 0.000 description 1
- 229930182816 L-glutamine Natural products 0.000 description 1
- 102000007072 Nerve Growth Factors Human genes 0.000 description 1
- 102000002111 Neuropilin Human genes 0.000 description 1
- 108050009450 Neuropilin Proteins 0.000 description 1
- 239000004677 Nylon Substances 0.000 description 1
- OAICVXFJPJFONN-UHFFFAOYSA-N Phosphorus Chemical compound [P] OAICVXFJPJFONN-UHFFFAOYSA-N 0.000 description 1
- 239000012980 RPMI-1640 medium Substances 0.000 description 1
- 102000006382 Ribonucleases Human genes 0.000 description 1
- 108010083644 Ribonucleases Proteins 0.000 description 1
- 108091081021 Sense strand Proteins 0.000 description 1
- VYPSYNLAJGMNEJ-UHFFFAOYSA-N Silicium dioxide Chemical compound O=[Si]=O VYPSYNLAJGMNEJ-UHFFFAOYSA-N 0.000 description 1
- VMHLLURERBWHNL-UHFFFAOYSA-M Sodium acetate Chemical compound [Na+].CC([O-])=O VMHLLURERBWHNL-UHFFFAOYSA-M 0.000 description 1
- 239000000150 Sympathomimetic Substances 0.000 description 1
- 230000006044 T cell activation Effects 0.000 description 1
- 208000036142 Viral infection Diseases 0.000 description 1
- 239000013543 active substance Substances 0.000 description 1
- 230000001154 acute effect Effects 0.000 description 1
- 208000038016 acute inflammation Diseases 0.000 description 1
- 230000006022 acute inflammation Effects 0.000 description 1
- 230000006978 adaptation Effects 0.000 description 1
- 230000004075 alteration Effects 0.000 description 1
- 230000036783 anaphylactic response Effects 0.000 description 1
- 239000000739 antihistaminic agent Substances 0.000 description 1
- 238000013459 approach Methods 0.000 description 1
- 238000010560 atom transfer radical polymerization reaction Methods 0.000 description 1
- 210000003719 b-lymphocyte Anatomy 0.000 description 1
- 230000008901 benefit Effects 0.000 description 1
- 229960002685 biotin Drugs 0.000 description 1
- 235000020958 biotin Nutrition 0.000 description 1
- 239000011616 biotin Substances 0.000 description 1
- 230000036427 bronchial hyperreactivity Effects 0.000 description 1
- 230000006721 cell death pathway Effects 0.000 description 1
- 238000001516 cell proliferation assay Methods 0.000 description 1
- 230000001413 cellular effect Effects 0.000 description 1
- 238000005119 centrifugation Methods 0.000 description 1
- 238000004891 communication Methods 0.000 description 1
- 230000000295 complement effect Effects 0.000 description 1
- 230000001276 controlling effect Effects 0.000 description 1
- 239000003246 corticosteroid Substances 0.000 description 1
- 229960001334 corticosteroids Drugs 0.000 description 1
- RGWHQCVHVJXOKC-SHYZEUOFSA-J dCTP(4-) Chemical compound O=C1N=C(N)C=CN1[C@@H]1O[C@H](COP([O-])(=O)OP([O-])(=O)OP([O-])([O-])=O)[C@@H](O)C1 RGWHQCVHVJXOKC-SHYZEUOFSA-J 0.000 description 1
- HAAZLUGHYHWQIW-KVQBGUIXSA-N dGTP Chemical compound C1=NC=2C(=O)NC(N)=NC=2N1[C@H]1C[C@H](O)[C@@H](COP(O)(=O)OP(O)(=O)OP(O)(O)=O)O1 HAAZLUGHYHWQIW-KVQBGUIXSA-N 0.000 description 1
- NHVNXKFIZYSCEB-XLPZGREQSA-N dTTP Chemical compound O=C1NC(=O)C(C)=CN1[C@@H]1O[C@H](COP(O)(=O)OP(O)(=O)OP(O)(O)=O)[C@@H](O)C1 NHVNXKFIZYSCEB-XLPZGREQSA-N 0.000 description 1
- 238000001514 detection method Methods 0.000 description 1
- 230000003828 downregulation Effects 0.000 description 1
- 229940079593 drug Drugs 0.000 description 1
- 239000000428 dust Substances 0.000 description 1
- 230000000694 effects Effects 0.000 description 1
- 239000003344 environmental pollutant Substances 0.000 description 1
- 239000003797 essential amino acid Substances 0.000 description 1
- 235000020776 essential amino acid Nutrition 0.000 description 1
- 239000012894 fetal calf serum Substances 0.000 description 1
- 239000012530 fluid Substances 0.000 description 1
- 238000011223 gene expression profiling Methods 0.000 description 1
- 239000003862 glucocorticoid Substances 0.000 description 1
- 108020004445 glyceraldehyde-3-phosphate dehydrogenase Proteins 0.000 description 1
- 239000010931 gold Substances 0.000 description 1
- 229910052737 gold Inorganic materials 0.000 description 1
- 229960002897 heparin Drugs 0.000 description 1
- 229920000669 heparin Polymers 0.000 description 1
- 230000001900 immune effect Effects 0.000 description 1
- 238000009169 immunotherapy Methods 0.000 description 1
- 238000010348 incorporation Methods 0.000 description 1
- 208000027866 inflammatory disease Diseases 0.000 description 1
- 102000006495 integrins Human genes 0.000 description 1
- 108010044426 integrins Proteins 0.000 description 1
- 201000010659 intrinsic asthma Diseases 0.000 description 1
- 238000002955 isolation Methods 0.000 description 1
- 238000002372 labelling Methods 0.000 description 1
- 239000012139 lysis buffer Substances 0.000 description 1
- 239000000463 material Substances 0.000 description 1
- 230000002297 mitogenic effect Effects 0.000 description 1
- 239000000203 mixture Substances 0.000 description 1
- 238000012986 modification Methods 0.000 description 1
- 230000004048 modification Effects 0.000 description 1
- 210000005036 nerve Anatomy 0.000 description 1
- 230000000926 neurological effect Effects 0.000 description 1
- 210000002569 neuron Anatomy 0.000 description 1
- 239000003900 neurotrophic factor Substances 0.000 description 1
- 238000010606 normalization Methods 0.000 description 1
- 108020004707 nucleic acids Proteins 0.000 description 1
- 102000039446 nucleic acids Human genes 0.000 description 1
- 150000007523 nucleic acids Chemical class 0.000 description 1
- 229920001778 nylon Polymers 0.000 description 1
- 210000005105 peripheral blood lymphocyte Anatomy 0.000 description 1
- 230000000144 pharmacologic effect Effects 0.000 description 1
- 238000002360 preparation method Methods 0.000 description 1
- 230000002285 radioactive effect Effects 0.000 description 1
- 230000009257 reactivity Effects 0.000 description 1
- 238000011160 research Methods 0.000 description 1
- 239000003161 ribonuclease inhibitor Substances 0.000 description 1
- 239000000741 silica gel Substances 0.000 description 1
- 229910002027 silica gel Inorganic materials 0.000 description 1
- 229960001866 silicon dioxide Drugs 0.000 description 1
- 238000007390 skin biopsy Methods 0.000 description 1
- 206010040882 skin lesion Diseases 0.000 description 1
- 231100000444 skin lesion Toxicity 0.000 description 1
- 239000001632 sodium acetate Substances 0.000 description 1
- 235000017281 sodium acetate Nutrition 0.000 description 1
- 239000001509 sodium citrate Substances 0.000 description 1
- AJPJDKMHJJGVTQ-UHFFFAOYSA-M sodium dihydrogen phosphate Chemical compound [Na+].OP(O)([O-])=O AJPJDKMHJJGVTQ-UHFFFAOYSA-M 0.000 description 1
- 229910000162 sodium phosphate Inorganic materials 0.000 description 1
- 229940054269 sodium pyruvate Drugs 0.000 description 1
- 238000007619 statistical method Methods 0.000 description 1
- 229940127230 sympathomimetic drug Drugs 0.000 description 1
- 229940037128 systemic glucocorticoids Drugs 0.000 description 1
- 238000002560 therapeutic procedure Methods 0.000 description 1
- 238000013334 tissue model Methods 0.000 description 1
- 230000003614 tolerogenic effect Effects 0.000 description 1
- 238000013518 transcription Methods 0.000 description 1
- 230000035897 transcription Effects 0.000 description 1
- 238000011282 treatment Methods 0.000 description 1
- 238000011269 treatment regimen Methods 0.000 description 1
- HRXKRNGNAMMEHJ-UHFFFAOYSA-K trisodium citrate Chemical compound [Na+].[Na+].[Na+].[O-]C(=O)CC(O)(CC([O-])=O)C([O-])=O HRXKRNGNAMMEHJ-UHFFFAOYSA-K 0.000 description 1
- 229940038773 trisodium citrate Drugs 0.000 description 1
- 230000009385 viral infection Effects 0.000 description 1
Images




Classifications
-
- G—PHYSICS
- G01—MEASURING; TESTING
- G01N—INVESTIGATING OR ANALYSING MATERIALS BY DETERMINING THEIR CHEMICAL OR PHYSICAL PROPERTIES
- G01N33/00—Investigating or analysing materials by specific methods not covered by groups G01N1/00 - G01N31/00
- G01N33/48—Biological material, e.g. blood, urine; Haemocytometers
- G01N33/50—Chemical analysis of biological material, e.g. blood, urine; Testing involving biospecific ligand binding methods; Immunological testing
- G01N33/53—Immunoassay; Biospecific binding assay; Materials therefor
- G01N33/569—Immunoassay; Biospecific binding assay; Materials therefor for microorganisms, e.g. protozoa, bacteria, viruses
- G01N33/56966—Animal cells
- G01N33/56972—White blood cells
Definitions
- Diagnosis of allergy and allergic asthma is of critical importance for disease management, research, epidemiology and development of specific therapies.
- diagnosis of allergic diseases is limited to a number of proteins such as serum IgE which suggests but not proofs allergic reactions. Only the reaction against a specific antigen defines the presence of an allergic disease, making the IgE test to the most valuable test in allergy diagnosis (1, 2).
- T lymphocytes are known to be the cells, which react in the first line against the allergens and are therefore believed to induce disease, by helping B cells to produce IgE.
- these cells were so far not been considered for diagnostic purposes, since the frequency of allergen specific in blood is very low (>0.1%; (4)). Even within skin lesions the frequency of a given allergen such as house dust mite is just 0.4% to 2.7% of all other T cells (5).
- T lymphocytes in proliferation assays allows the detection of a specific reaction of allergen reactive cells which is measurable following a week of in vitro cultivation (6, 7), and can be used to identify allergens of a given patient. These measurements, however, do not provide more information than any allergen-skin test, i.e. reactivity of a T cell against a given antigen.
- an object of the invention is to provide a simple and reliable method for diagnosing allergic diseases and without knowing any specific allergen.
- a further object of the present invention is to provide screening assays to evaluate the allergenic and/or anti-allergic potential of an analyte substance.
- the invention provides a method for diagnosing the presence of or predisposition for (a) allergic disease(s) using expression profiling images comprising the steps of:
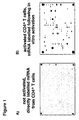
- step (c) As contacting hybridizations were performed without in vitro activation of the cells, signals, e.g. on an array, were inconsistent in quality or even absent except of a few housekeeping genes (Fig. 1a, housekeeping genes on the right side). This effect possibly reflects different activation conditions of individual patients.
- in vitro activation enhanced signals on the array, for example a membrane, surprisingly also of genes which are not regulated by anti-CD3/CD28 such as integrins. It appears that anti-CD3/CD28 stimulation enhances the allover transcription machinery, resulting in more mRNA transcripts.
- the T cell stimulation step therefore contributes to the normalization of the activation status of the cells and in turn for the standardization of the diagnostic procedure which is important for intra-patient comparisons.
- lymphocytes are selected from the group consisting of CD4 + T cells and CD8 + T cells.
- CD8 + T cells may be preferred, in particular when lung diseases are initiated by viral infections, or monocytes might be used for patients with additional inflammatory diseases.
- the activation or stimulation in step (a) of the inventive method can also be performed in full, unseparated blood prior to the separation of the cells. The latter modification allows automatic procedures, which will be critical for controlling the costs of the diagnostic procedure.
- the ligand in step (b) of the method is for example labelled with one or more label(s) selected from the group consisting of colored, fluorescent, bioluminescent, chemoluminescent, phosporescent or radioactive labels, an enzyme, an antibody or a functional fragment or derivative thereof, a protein A/gold based system, a biotin/avidin/streptavidin based system or an enzyme electrode based system is/are used.
- label(s) selected from the group consisting of colored, fluorescent, bioluminescent, chemoluminescent, phosporescent or radioactive labels, an enzyme, an antibody or a functional fragment or derivative thereof, a protein A/gold based system, a biotin/avidin/streptavidin based system or an enzyme electrode based system is/are used.
- the allergic disease(s) to be diagnosed is/are allergic asthma and atopic dermatitis.
- allergic asthma it is possible to diagnose non-allergic asthma, which differential diagnosis is of clinical importance.
- said set of receptors specifically representing a respective set of genes is selected from the group consisting of genes coding for EpCAM, DNAM, Endoglin, Flt-3/Flk-2 R, c-met, MPL R, MSP R, IL-18 R, Tie-2, fractalkine, HCC-4, I-309, Agouti-related transcript, PREF-1, SARP-3, Urokinase R, MMP-15, EBAF, TRAIL R2, amphiregulin, betacellulin, cripto, erbB1, erbB3, TGF- ⁇ , ephrin-A1, ephrin-A2, EphA1, EphA2, EphA3, EphA4, EphB4, EphB6, CNTF, GDNF, GFR ⁇ 1, GFR ⁇ 2, neurophilin-1, NGF R, ICAM-1, angiogenin, VEGF, VEGF-8, VEGF-D, CD34,
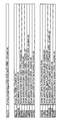
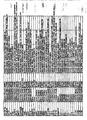
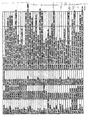
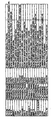
- said set of receptors is selected from oligonucleotide probes having a sequence defined by, or correlated to, or derived from the group of genes consisting of candidate genes indicated in the following list: Gene coding for Startposition lenght Accession No EpCAM 1259 40 X13425 DNAM 2369 40 U56102 Endoglin.
- suitable sequences which may be used for oligonucleotide design may be downloaded from the NCBI GenBank (http://www.ncbi.nlm.gov/GenBank/index.html) using the Accession number listed in Figure 8. All accession numbers give access to mRNA sequences; since the cDNA of the patients is reverse transcribed, the oligonucleotide have to sense strand and are therefore identical with the mRNA sequence.
- step (c) of the method said immobilized receptors are located on a surface, and may optionally form a patterned array thereon.
- the invention provides a screening assay for evaluating the allergenic and/or anti-allergical potential of (an) analyte substance(s) using expression profiling images comprising the steps of:
- the "risk degree” of an allergenic substance can be concluded by comparison of the expression profiles with substances of known risk (such as diesel exaust, Aspergillus allergens etc.).
- the current allergic status of a patient may be monitored easily with the inventive screening assay. This allows a prompt adaptation of the treating regime (for example dosing, type of administration) to the current allergic status.
- Antiallergic substances are for example sympathomimetic drugs, histamine antagonists, glucocorticoids, and corticosteroids. Specific examples may be found in any standard textbook on pharmacology, cf. for example Goodman & Gilman's, "The Pharmacological Basis of Therapeutics", Vols and 2, 8 th edition, McGraw-Hill International Editions, 1992, pages 217, 587, 1455 and 1575/76 the disclosure content of which is herein incorporated by reference.
- the invention provides a diagnostic tool suitable for use in the inventive methods comprising on its surface a set of immobilized receptors selected from the group consisting of oligonucleotide or cDNA probes and antibodies or functional fragments thereof, capable of specifically binding ligands selected from the group consisting of mRNA, oligonucleotides, cDNAs, proteins or functional fragments thereof, representing a respective set of genes involved with (a) specific allergic disease(s) or a predispositon therefor to be diagnosed.
- said immobilized receptors may form a patterned array on the surface. If, for example fluorescent nucleotides are used the surface may be made of glass or any other solid, non-fluorescent carrier.
- the inventive method generally allows the generation of characteristic expression profiling images for diagnosing allergic diseases based both on genes and the respective gene products, i.e. proteins.
- gene expression profiling images or gene expression profiles are used.
- the present invention proposes the use of mRNA isolated from for example CD4 + T cells or monocytes/macrophages activated in vitro, for example for 6h, as a basis for multigene analysis for differential diagnosis of allergic and asthmatic diseases.
- hybridization techniques are sensitive enough to profile T cell or monocytes/macrophages gene expression and that multigene approaches allow on the basis of activated CD4 + T cell or monocytes/macrophages mRNA the differentiation between clinically different allergic diseases, such as allergic asthma and atopic dermatitis by gene expression profiles.
- each gene, i.e. labelled cDNA derived therefrom, involved with the presence of or predisposition for (a) specific allergic disease(s) to be diagnosed is spotted in duplicates onto, for example, an array membrane with respective immobilized oligonucleotide probes capable of specifically hybridizing with the respective gene, i.e. labelled cDNA derived therefrom, and the mean of both measurements is used in subsequent evaluations.
- Differences in gene expression are accepted as different when the signals from patient material are at least two fold lower or higher than those from healthy volunteers. This threshold is commonly accepted for the evaluation of expression arrays. All genes are corrected against housekeeping genes to compensate minor differences in cell load of each sample.
- Fold differences are calculated for each gene and since the order and scale of each patient is the same an individual profile for each patient results.
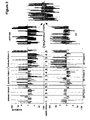
- These profiles are now overlaid (middle panel of Figure 2), for example for all atopic dermatitis and for all asthma patients, resulting in an (ideal) asthma or atopic dermatitis profile.
- This profile is defined by the probability value p , which will be defined for each individual gene or gene groups in correlation (Spearman Rank Test) with clinical parameters of asthma or atopic dermatitis. For normal profiles healthy volunteers are used.
- the inventive method is in addition supported by statistical analysis, which defines statistical confidence intervals, which link for example a 5 fold decrease in gene x with 10% confidence to phenotype y; a 7 fold decrease in gene x with 50% confidence to phenotype y. Again this confidence is defined on the basis of probability value P (precise formula given in (8)). Even if statistical correlation with a given phenotype is relatively low using the inventive method, the practically unlimited number of genes and their statistical confidence will be in sum 99%, since the p values are added for the confidence intervals (8).
- the number of genes necessary for the method of the invention depends finally on the phenotype to be described and its extend of correlation with each gene. For example 3 to 5 genes from each group in the table of Figure 8 may be sufficient to obtain a statistically significant normal or allergic profile.
- Figure 1 shows autoradiographs of labelled mRNA from not activated and activated CD4+ cells.
- Figures 2 shows gene expression profiles of individual patients suffering from allergic asthma or atopic dermatitis.
- Three blocks are representing three individual patients. Of note these bars represent changes in comparison to healthy volunteers.
- Within each patient block are 5 groups which contain genes which share certain functions. Each group is depicted separately in Figure 3-7 including the gene designation.
- On the right next to the individual patients are overlays of the patient groups shown. These overlays demonstrate that some genes are exclusive marker for atopic dermatitis or asthma respectively whereas other genes are "misregulated" both in atopic dermatitis and asthma.
- Figure 3 shows surface genes (group 1) which are likely to be expressed during the T cell activation process.
- the left panel shows the changes in atopic dermatitis patients (AD) and the right panel the asthma patients.
- the bars represent changes in fold expression.
- a bar upward from the black lines indicates an increase a bar downwards a decrease of expression.
- Epcam (lane 1) was in all three AD patients decreased, whereas asthma patients show either a weak decrease or even an increased expression.
- DNAM (lane 2) was increased in AD patients except in one patient, similarly to asthma patients, possibly indicating a common allergy gene.
- Endoglin (lane 3) was decreased in all asthma patients whereas AD patients showed increased expression in two cases and only a minor decrease in one case.
- the ladder patient is possibly predisposed for developing asthma.
- Flt-3/Flk-2 R (4) was always found to be increased in AD patients whereas asthma patients showed decreased expression except in one case.
- C-met (lane 5) was again decreased in all asthma patients and increased in AD patients with exception of the putative "asthma predisposed" patient.
- MPL R (lane 6) behaved as described for C-met.
- MSP-R (lane 7) was dramatically increased in two asthma patients with the exception of one patient who showed a minor decrease, in contrast two AD patients showed a decrease in gene expressionand only one patient showed a minor increase.
- the expression of the IL-18-R (lane 8) was more heterogeneously expressed, however increases observed both in asthma and also a single but dramatic decrease in an AD was observed.
- Tie-2 (lane 9) was unchanged in asthma patients but dramatically up regulated in two AD patients and rather to a minor degree decreased in another AD patient.
- FIG 4 shows cytokines (group 2) which are important for cross talk between lymphocytes and other cells.
- the left panel shows the changes in atopic dermatitis patients (AD) and the right panel the asthma patients.
- the bars represent changes in fold expression.
- a bar upward from the black lines indicates an increase a bar downwards a decrease of expression.
- Fractalkine (lane 1) was always found to be decreased in asthma patients and increased in two out of three AD patients.
- the AD patient which showed a decrease is identical with the putative "asthma predisposed" AD patient described in Figure 3.
- HCC-4 was decreased in all asthma and all AD patients, possibly representing a common allergy marker, which is known to be regulated by IL-10, a suppressive cytokine.
- I-309 (lane 3) beahves as described for Fractalkine.
- the Agouti-related transcript was decreased in two and increased to a minor degree in one asthma patient: in AD patients changes occured in a lower amplitude but reverse (increased) in comparison to the asthma patients.
- PREF-1 (lane 5) showed a dramatic increase in a single asthma patient and a decrease in the other two patients: in AD patients this gene behaved as described for Fractalkine.
- SARP-3 (lane 6) decreased in all asthma patients whereas expression was unchanged in AD patients except of one case where a minor increase was observed.
- the urokinase receptor was mostly upregulated both in asthma and AD, indicating an allergy related misregulation of this gene.
- MMP-15 (lane 8) expression is comparable with the urokinase receptor described above.
- EBAF (lane 9) showed only minor changes in AD patients, whereas downregulation was detected in all three asthma patients.
- TRAIL R2 (lane 10) was upregulated in all three AD patients and also in two asthma patients. Only one asthma patient showed a minor decrease in TRAIL R2 expression.
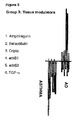
- Figure 5 shows factors important for tissue modeling (group 3).
- the left panel shows the changes in atopic dermatitis patients (AD) and the right panel the asthma patients.
- the bars represent changes in fold expression.
- a bar upward from the black lines indicates an increase a bar downwards a decrease of expression.
- Amphiregulin (lane 1) was downregulated in all three asthma patients. A mild increase in Amphiregulin expression was only observed in one AD patient and a decrease in the patient described above with the putative "asthma predisposition”.
- Betacellulin (lane 2) showed the same patterns as Amphiregulin.
- Cripto (lane 3) showed a decrease in two asthma patients and behaved for the AD patients as described for the preceding genes.
- ErbB1 (lane 4), ErbB3 (lane 5) and TGF-alpha (lane 6) were in all three asthma patients decreased and increased (in particular ErbB1 & 3) in the AD patients with the exception of the putative "asthma predisposition" patient.
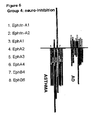
- Figure 6 shows factors (group 4) related to neurological biology which are however not yet functionally described.
- the left panel shows the changes in atopic dermatitis patients (AD) and the right panel the asthma patients.
- the bars represent changes in fold expression.
- a bar upward from the black lines indicates an increase a bar downwards a decrease of expression.
- all of the genes (lanes 1-8; Ephrin-A1, Ephrin-A2, EphA1-4 and EphB4 & 6) were decreased in all asthma patients with the exception EphA1 (lane 3) and EpHA3 (lane 5), which was increased in one asthma patient.
- EphA1 lane 3
- EpHA3 lane 5
- the putative "asthma predisposition" patient showed also a decrease in all genes.
- Ephrin-A1, A2 and EphA1-3 (lanes 1-5) were increased in all other AD patients.
- EphA4, B4 and B6 (lanes 6-8) were decreased in one AD patient and decreased in the third one
- GFRa1 (lane 3) was increased and decreased in both disease, but the greatest amplitude was seen in the increased expression of AD patients and the greatest in decrease in the asthma patient.
- GFRa2 (lane 4) behaved as BDNF in AD patients, whereas all three asthma patients showed an increase in gene expression.
- Neuropilin-1 (lane 5) was dramatically increased in two AD patients and decreased to a minor degree in another AD patient.
- Neuropilin was increased in one patient and decreased in another patient and unchanged in a third one.
- NGF R (lane 6) Increased in two AD patients to a minor degree and decreased to the same extend in another one. Although one asthma patient was observed with a mild increase in NGF R expression, the two other patients showed a marked decrease in NGF R expression.
- the AD patient with "asthma predisposition" was not observed to be asthma-like in this panel, indicating that genes of this group might correlate with acute clinical sympthoms.
- Figure 8 shows a table listing genes involved with allergic asthma or atopic dermatitis (AD).
- the genes are clustered as described in figures 3-7. Further, positions of sequences for oligonucleotide probes (with data bank accession numbers for the respective genes) are given.
- the oligonucleotides in a size of 40 ⁇ 2 base pairs were selected on the basis of a common melting temperature (Tm 75 ⁇ 3 °C, GC content: 45-60%).
- RNA is amplified following isolation and prior labelling.
- CD4 + T cells are separated from other blood cells using either Ficoll (Biocoll separating solution, Biochrom KG, Berlin, Germany) density centrifugation following the instructions of the manufacturer.
- Purified peripheral blood mononuclear cells (PBMC) are subsequently purified using the anti-CD4 coated magnetic beads (DetachaBead, Dynal, Oslo, Norway). The purity of the isolated population is verified by FACS® analysis and is always higher than 95%.
- Cells are cultured overnight with plate-bound anti-CD3 (1 ⁇ g / ml; OKT3 clone from ATCC, Manassas, VA, USA) and anti-CD28 (2 ⁇ g / ml; 15E8 from CLB, Amsterdam, The Netherlands) monoclonal antibodies. All cultures are carried out in RPMI 1640 supplemented with 1 mM L-glutamine, sodium pyruvate, non-essential amino acids, 5 x 10 -5 ⁇ M 2-mercaptoethanol and 10% heat-inactivated fetal calf serum (all from Life Technologies, Basel, Switzerland).
- RNA analysis 5 x 10 6 cells of each cell population are lysed with lysis buffer (Rneasy, Qiagen, Hamburg, Germany). Alternatively cells can be directly purified from blood by using the Dynal beads described above, avoiding the Ficoll step. There is preliminary evidence that stimulation with plate-bound antibodies can be replaced by mitogenic stimulation with phorbol 12-myristate 13-acetate (PMA) and ionomycin or phytohemagglutinin (PHA) and ionomycin. As already mentioned above, this stimulation can also be performed in full, unseparated blood prior separation of the cells.
- PMA phorbol 12-myristate 13-acetate
- PHA phytohemagglutinin
- RNA is isolated using the Rneasy® kit (Qiagen, Hamburg, Germany) following the instructions of the supplier and eluted in 100 ⁇ l H 2 O.
- the RNA is precipitated with sodium acetate and Ethanol, washed with 70 % ethanol and resuspended in 11 ⁇ l H 2 O.
- RNA is mixed with 4 ⁇ l dT 12 primers (Microsynth, Balgach, Switzerland) and incubated in a thermal cycler at 90° C for 2 minutes. The temperature is ramped to 42° C in 20 minutes. Following components are added: 6 ⁇ l 5 ⁇ reverse first strand buffer (GIBCO BRL, Basel, Switzerland), 2 ⁇ l 0,1 M DTT (Life Technologies, Basel, Switzerland), 20 U Rnase inhibitor (Roche, Mannheim, Germany), 1 ⁇ l of dCTP, dGTP, dTTP (each 10 mM; Perkin Elmer), 5 ⁇ l [ ⁇ - 33 P]-dATP (0,4 MBq/ ⁇ l; Hartmann, Braunschweig, Germany) and 1 ⁇ l RNase H-reverse transcriptase (Superscript II, Life Technologies).
- fluorescent nucleotides can be used in combination with e.g. glass arrays or any other solid, non-fluorescent carrier.
- the mixture is incubated at 42°C for 3 hours and filled up to 100 ⁇ l with H 2 O.
- the cDNA is purified using silica-gel columns (QIAquick, Qiagen) and eluted in 100 ⁇ l H 2 O. Again 1 ⁇ l are measured in a scintillation counter to estimate the percentage incorporation of labeled nucleotides in the cDNA.
- the oligonucleotide probes and an array may be constructed as described above, e.g. the oligonucleotides listed in Figure 8 can be spotted on nylon membrane: The oligonucleotides are spotted on the membrane using a 96 slot manifold (Schleicher & Schuell, Dassel, Germany). The DNA is denatured in 50 ⁇ l 1N NaOH incubated for 5 min at 37°C and subsequently mixed with 12x SSC buffer (1.8 M NaCl, 0.18 trisodium citrate). A total amount of 10 ng of each oligonucleotide is added in a volume of 100 ⁇ l to allow equal distribution on the membrane and are arranged in duplicates.
- SSC buffer 1.8 M NaCl, 0.18 trisodium citrate
- a commercially available array membrane is used.
- One probe from patient blood and one probe from healthy volunteer blood is each hybridized on a human cytokine expression array membrane (R&D Systems, Abingdon, UK). Hybridization in the present example is performed as described in the human cytokine expression array handbook (R&D).
- the membranes are washed 20 minutes with 30 ml of a 0,1 ⁇ SSPE buffer (SSPE stock is 20x: 3.6M NaCl, 0.2 M NaH 2 PO 4 , 0.02 M EDTA, pH7.7), 1% (w/v) SDS solution.
- the arrays are exposed 24 hours to imager-screens (Fuji Film, Tokyo, Japan).
- the screens are analyzed using the FLA 3000 phosphor imager system (Fuji) and evaluated with the AIDA program (Raytest, Urdorf, Switzerland). To compare the intensity of spots containing different membranes housekeeping genes like GAPDH and L19 are normalized.
- ATRP activate CD4 + T cell mRNA profiling system, according to one embodiment of the inventive method for differential diagnosis of allergic diseases
- Figure 2 A set of genes is measured by arrays or other systems. Fold differences are shown for each gene and the order and scale of each patient is the same, resulting in an individual profile for each patient. These profiles are now overlaid (middle panel) for all atopic dermatitis and for all asthma patients resulting in an (ideal) asthma or atopic dermatitis profile. It should be noted that this phenotype can be clinically more challenging such as revealing bronchial hyperreactivity, steroid resistance or yet unidentified subgroups of allergic disease.
- atopic dermatitis and asthma The comparison of atopic dermatitis and asthma is shown in the right panel: Although some genes can be increased or decreased both in asthma or atopic dermatitis, some genes clearly appear only changed in asthma or atopic dermatitis. This comparison is shown in more detail in figures 3-7. Generally it can be concluded that group 1 genes (Fig. 3, surface activation markers) are more frequently increased in AD patients whereas asthma patients showed rather reduced levels. Group 1 genes will give information how active/acute inflammation is going on. For group 2 (Fig. 4) there is generally a higher expression in AD, whereas asthma patients are more suppressed in these genes. Of note HCC-4 is regulated to a lower degree and acts as a marker of reduced tolerogenic capacity of the patient.
- TRAIL R2 was increased in both patients reflecting alterations in cell death pathways.
- Group 3 (Fig. 5) is consistently downregulated in asthma patients. AD patients with decreased expression levels in this field possibly carry a risk to develop asthma, group 4 genes (Fig. 6) are yet not characterized in their function, but are generally decreased in asthma patients. The same atopic dermatitis patient which showed asthma indicative decreases in group 3 genes is also decreased in group 4 genes, confirming the asthma like profile.
- Group 5 genes (Fig. 7) are parameters, which are related to nerve growth and activation relevant for pain diagnosis and for bronchial hyperactivity. A consistent high expression occurs within the asthma patients. The NGF R is an exception, which was decreased in asthma and increased in AD patients. The complete description of phenotype relation of each gene is listed in the table of Figure 8.
- mRNA of activated CD4 + T cells allows differential diagnosis of allergic diseases.
- the CD4 + T cells are isolated and stimulated under defined conditions in vitro. Subsequently, mRNA is subjected to multigene analysis such as DNA arrays. Gene expression profiles can be created, which allow on the basis of the activated T cell mRNA the prediction of certain phenotypes such as asthma or atopic dermatitis.
Landscapes
- Life Sciences & Earth Sciences (AREA)
- Health & Medical Sciences (AREA)
- Cell Biology (AREA)
- Hematology (AREA)
- Immunology (AREA)
- Engineering & Computer Science (AREA)
- Molecular Biology (AREA)
- Chemical & Material Sciences (AREA)
- Urology & Nephrology (AREA)
- Biomedical Technology (AREA)
- Virology (AREA)
- Physics & Mathematics (AREA)
- Biotechnology (AREA)
- Tropical Medicine & Parasitology (AREA)
- Zoology (AREA)
- Food Science & Technology (AREA)
- Medicinal Chemistry (AREA)
- Microbiology (AREA)
- Analytical Chemistry (AREA)
- Biochemistry (AREA)
- General Health & Medical Sciences (AREA)
- General Physics & Mathematics (AREA)
- Pathology (AREA)
- Measuring Or Testing Involving Enzymes Or Micro-Organisms (AREA)
- Medicines That Contain Protein Lipid Enzymes And Other Medicines (AREA)
Priority Applications (3)
| Application Number | Priority Date | Filing Date | Title |
|---|---|---|---|
| EP00126117A EP1221618A1 (de) | 2000-11-29 | 2000-11-29 | Diagnoseverfahren für allergische Erkrankungen |
| AU2002221906A AU2002221906A1 (en) | 2000-11-29 | 2001-11-29 | Method for diagnosing allergic diseases |
| PCT/EP2001/013937 WO2002044732A2 (en) | 2000-11-29 | 2001-11-29 | Method for diagnosing allergic diseases |
Applications Claiming Priority (1)
| Application Number | Priority Date | Filing Date | Title |
|---|---|---|---|
| EP00126117A EP1221618A1 (de) | 2000-11-29 | 2000-11-29 | Diagnoseverfahren für allergische Erkrankungen |
Publications (1)
| Publication Number | Publication Date |
|---|---|
| EP1221618A1 true EP1221618A1 (de) | 2002-07-10 |
Family
ID=8170530
Family Applications (1)
| Application Number | Title | Priority Date | Filing Date |
|---|---|---|---|
| EP00126117A Withdrawn EP1221618A1 (de) | 2000-11-29 | 2000-11-29 | Diagnoseverfahren für allergische Erkrankungen |
Country Status (3)
| Country | Link |
|---|---|
| EP (1) | EP1221618A1 (de) |
| AU (1) | AU2002221906A1 (de) |
| WO (1) | WO2002044732A2 (de) |
Cited By (6)
| Publication number | Priority date | Publication date | Assignee | Title |
|---|---|---|---|---|
| EP1430902A1 (de) * | 2002-12-20 | 2004-06-23 | Mondobiotech Laboratories Anstalt | Pharmazeutische Zusammensetzung enthaltend gamma-interferon zusammen mit molekularischen diagnostischen Methoden zur verbesserten Behandlung von Asthma |
| WO2012002775A3 (ko) * | 2010-07-02 | 2012-04-12 | 한국생명공학연구원 | 뉴로필린1 유전자를 이용한 천식 진단 및 천식 치료제 스크리닝 방법 |
| CN105713878A (zh) * | 2015-12-21 | 2016-06-29 | 杭州特马赛生物技术有限公司 | 一种体外扩增cd8+t细胞的方法 |
| KR101818672B1 (ko) | 2017-02-17 | 2018-01-16 | 가천대학교 산학협력단 | 아토피 피부염 진단용 조성물 및 상기 조성물을 이용한 아토피 피부염의 진단 방법 |
| CN111175519A (zh) * | 2020-01-09 | 2020-05-19 | 浙江大学 | Epo在制备肝细胞癌tace疗效评估试剂中的应用 |
| US11104727B2 (en) | 2015-10-14 | 2021-08-31 | Nippon Zenyaku Kogyo Co., Ltd. | Anti-canine TARC antibody used for treatment and diagnosis of canine atopic dermatitis |
Families Citing this family (12)
| Publication number | Priority date | Publication date | Assignee | Title |
|---|---|---|---|---|
| US6763307B2 (en) | 2000-03-06 | 2004-07-13 | Bioseek, Inc. | Patient classification |
| JP4798921B2 (ja) | 2000-03-06 | 2011-10-19 | バイオシーク インコーポレーティッド | 機能相同性スクリーニング |
| CA2412012C (en) | 2001-11-20 | 2011-08-02 | Ed. Geistlich Soehne Ag Fuer Chemische Industrie | Resorbable extracellular matrix containing collagen i and collagen ii for reconstruction of cartilage |
| US7598049B2 (en) | 2003-11-19 | 2009-10-06 | Satoris, Inc. | Methods for diagnosis of Alzheimer's Disease in blood samples |
| US20060094064A1 (en) | 2003-11-19 | 2006-05-04 | Sandip Ray | Methods and compositions for diagnosis, stratification, and monitoring of alzheimer's disease and other neurological disorders in body fluids |
| JP2006174740A (ja) * | 2004-12-21 | 2006-07-06 | Institute Of Physical & Chemical Research | アレルギー性疾患の疾患マーカーおよびその利用 |
| EP1722231A3 (de) * | 2005-04-27 | 2009-03-11 | MPB MelTec Patent- und Beteiligungsgesellschaft mbH | Verfahren zur Identifizierung von Körperstammzellen |
| EP1943523A2 (de) * | 2005-09-16 | 2008-07-16 | Biovator Technologies AB | In-vitro-test zur identifizierung allergener proteine |
| EP1905843A1 (de) * | 2006-09-29 | 2008-04-02 | Vlaamse Instelling voor Technologisch Onderzoek | Methode zur Feststellung des allergischen Potentials einer Substanz |
| CN107603948B (zh) * | 2017-08-14 | 2019-07-05 | 武汉圣济科技有限公司 | 一种直接体外诱导人外周血单个核细胞成为复合型抗原非特异性调节性t细胞的方法 |
| CN114544806A (zh) * | 2022-02-11 | 2022-05-27 | 复旦大学附属中山医院 | 血清肉豆蔻酸作为哮喘诊断标志物的用途 |
| CN116144748A (zh) * | 2022-09-22 | 2023-05-23 | 烟台毓璜顶医院 | 一种检测il-6表达异常的试剂在制备变应性鼻炎嗅觉障碍诊断和/或治疗工具中的应用 |
Citations (1)
| Publication number | Priority date | Publication date | Assignee | Title |
|---|---|---|---|---|
| WO1999057130A1 (en) * | 1998-05-05 | 1999-11-11 | Gene Logic, Inc. | A process to study changes in gene expression in t lymphocytes |
-
2000
- 2000-11-29 EP EP00126117A patent/EP1221618A1/de not_active Withdrawn
-
2001
- 2001-11-29 WO PCT/EP2001/013937 patent/WO2002044732A2/en not_active Ceased
- 2001-11-29 AU AU2002221906A patent/AU2002221906A1/en not_active Abandoned
Patent Citations (1)
| Publication number | Priority date | Publication date | Assignee | Title |
|---|---|---|---|---|
| WO1999057130A1 (en) * | 1998-05-05 | 1999-11-11 | Gene Logic, Inc. | A process to study changes in gene expression in t lymphocytes |
Non-Patent Citations (3)
| Title |
|---|
| DATABASE BIOSIS [online] BIOSCIENCES INFORMATION SERVICE, PHILADELPHIA, PA, US; August 1999 (1999-08-01), SYED F ET AL: "CCR7 (EBI1) receptor down-regulation in asthma: Differential gene expression in human CD4+ T lymphocytes.", XP002171598, Database accession no. PREV199900478919 * |
| HELLER RENU A ET AL: "Discovery and analysis of inflammatory disease-related genes using cDNA microarrays.", PROCEEDINGS OF THE NATIONAL ACADEMY OF SCIENCES OF THE UNITED STATES, vol. 94, no. 6, 1997, 1997, pages 2150 - 2155, XP002171597, ISSN: 0027-8424 * |
| QJM, vol. 92, no. 8, August 1999 (1999-08-01), pages 463 - 471, ISSN: 1460-2725 * |
Cited By (8)
| Publication number | Priority date | Publication date | Assignee | Title |
|---|---|---|---|---|
| EP1430902A1 (de) * | 2002-12-20 | 2004-06-23 | Mondobiotech Laboratories Anstalt | Pharmazeutische Zusammensetzung enthaltend gamma-interferon zusammen mit molekularischen diagnostischen Methoden zur verbesserten Behandlung von Asthma |
| WO2012002775A3 (ko) * | 2010-07-02 | 2012-04-12 | 한국생명공학연구원 | 뉴로필린1 유전자를 이용한 천식 진단 및 천식 치료제 스크리닝 방법 |
| US9078912B2 (en) | 2010-07-02 | 2015-07-14 | Korea Research Institute Of Bioscience And Biotechnology | Asthma diagnosis using the neuropilin-1 gene, and method for screening for a therapeutic agent for asthma |
| US11104727B2 (en) | 2015-10-14 | 2021-08-31 | Nippon Zenyaku Kogyo Co., Ltd. | Anti-canine TARC antibody used for treatment and diagnosis of canine atopic dermatitis |
| CN105713878A (zh) * | 2015-12-21 | 2016-06-29 | 杭州特马赛生物技术有限公司 | 一种体外扩增cd8+t细胞的方法 |
| KR101818672B1 (ko) | 2017-02-17 | 2018-01-16 | 가천대학교 산학협력단 | 아토피 피부염 진단용 조성물 및 상기 조성물을 이용한 아토피 피부염의 진단 방법 |
| CN111175519A (zh) * | 2020-01-09 | 2020-05-19 | 浙江大学 | Epo在制备肝细胞癌tace疗效评估试剂中的应用 |
| CN111175519B (zh) * | 2020-01-09 | 2020-11-27 | 浙江大学 | Epo在制备肝细胞癌tace疗效评估试剂中的应用 |
Also Published As
| Publication number | Publication date |
|---|---|
| WO2002044732A3 (en) | 2003-03-27 |
| AU2002221906A1 (en) | 2002-06-11 |
| WO2002044732A2 (en) | 2002-06-06 |
Similar Documents
| Publication | Publication Date | Title |
|---|---|---|
| WO2002044732A2 (en) | Method for diagnosing allergic diseases | |
| CN103299191B (zh) | 中风的生物标记 | |
| EP2370814B1 (de) | Verfahren zur diagnose allergischer reaktionen | |
| Zimmerman et al. | Cerebrospinal fluid and serum markers of inflammation in autism | |
| Shackel et al. | Insights into the pathobiology of hepatitis C virus-associated cirrhosis: analysis of intrahepatic differential gene expression | |
| LAHAT et al. | Cytokine profile in coeliac disease | |
| CN101627129B (zh) | 用于测量生理健康的生物介体的组合物和多路检验 | |
| Dearman et al. | Chemical allergy: considerations for the practical application of cytokine profiling | |
| HK1206796A1 (en) | Methods of prognosing, diagnosing and treating idiopathic pulmonary fibrosis | |
| Tsoi et al. | Noninvasive tape-stripping with high-resolution RNA profiling effectively captures a preinflammatory state in nonlesional psoriatic skin | |
| Schroeder et al. | IL-4 production by human basophils found in the lung following segmental allergen challenge | |
| WO2008143890A2 (en) | Biomarkers for septic shock patients | |
| CN111521807A (zh) | Spondin 1和CA125联合用作早期卵巢癌生物标志物以及试剂盒 | |
| Benson et al. | DNA microarrays to study gene expression in allergic airways | |
| EP2831275A1 (de) | Markersequenzen für rheumatoide arthritis | |
| US8609432B2 (en) | Method and kit for detection of autoimmune chronic urticaria | |
| JP2021532827A (ja) | 虚弱性の診断および/または予測のためのバイオマーカー | |
| KR102226826B1 (ko) | 버피 코트 시료에 사용하기 위한 췌장암 진단용 조성물 | |
| EP1563083A2 (de) | Verwendung von dendritischen zellen sezernierten cytokinen | |
| US20190226016A1 (en) | Extracellular vesicle ribonucleic acid (rna) cargo as a biomarker of hyperglycemia and type 1 diabetes | |
| Suhadolnik et al. | Clinical and biochemical characteristics differentiating chronic fatigue syndrome from major depression and healthy control populations: relation to dysfunction in the RNase L pathway | |
| US7875427B2 (en) | Compositions and methods for IL-13 biomarkers | |
| WO2008107701A1 (en) | Diagnosing psychotic disorders | |
| WO2008107699A1 (en) | Diagnosing psychotic disorders | |
| CN115702351B (zh) | 重症药疹的蛋白质诊断生物标记物 |
Legal Events
| Date | Code | Title | Description |
|---|---|---|---|
| PUAI | Public reference made under article 153(3) epc to a published international application that has entered the european phase |
Free format text: ORIGINAL CODE: 0009012 |
|
| 17P | Request for examination filed |
Effective date: 20010901 |
|
| AK | Designated contracting states |
Kind code of ref document: A1 Designated state(s): AT BE CH CY DE DK ES FI FR GB GR IE IT LI LU MC NL PT SE TR |
|
| AX | Request for extension of the european patent |
Free format text: AL;LT;LV;MK;RO;SI |
|
| AKX | Designation fees paid |
Designated state(s): AT BE CH CY DE DK ES FI FR GB GR IE IT LI LU MC NL PT SE TR |
|
| GRAP | Despatch of communication of intention to grant a patent |
Free format text: ORIGINAL CODE: EPIDOSNIGR1 |
|
| STAA | Information on the status of an ep patent application or granted ep patent |
Free format text: STATUS: THE APPLICATION IS DEEMED TO BE WITHDRAWN |
|
| 18D | Application deemed to be withdrawn |
Effective date: 20031209 |